***Last / Change / Volume data in this table is the closing quote data***
Symbol/Exchange
Company Name
Industry Group |
PRICE |
CHANGE
(%Change) |
Day High |
Volume
(% DAV)
(% 50 day avg vol) |
52 Wk Hi
% From Hi |
Featured
Date |
Price
Featured |
Pivot Featured |
|
Max Buy |
BIDU
-
NASDAQ
Baidu Inc Ads
INTERNET - Internet Information Providers
|
$120.59
|
+1.78
1.50% |
$121.72
|
4,826,566
63.49% of 50 DAV
50 DAV is 7,602,200
|
$131.63
-8.39%
|
2/1/2011
|
$117.74
|
PP = $112.08
|
|
MB = $117.68
|
Most Recent Note - 2/24/2011 6:21:57 PM
G - Posted a gain on lighter volume today following damaging losses with higher than average volume. Recently slumping near prior highs in the $112-115 area previously noted as defining initial chart support to watch above its 50 DMA line.
>>> The latest Featured Stock Update with an annotated graph appeared on 2/2/2011. Click here.
View all notes |
Alert me of new notes |
CANSLIM.net Company Profile |
SEC |
Zacks Reports |
StockTalk |
News |
Chart |
Request a new note
C
A N
S L
I M


|
CMG
-
NYSE
Chipotle Mexican Grill
LEISURE - Restaurants
|
$248.36
|
+3.06
1.25% |
$255.00
|
836,084
79.28% of 50 DAV
50 DAV is 1,054,600
|
$275.00
-9.69%
|
2/11/2011
|
$271.15
|
PP = $262.87
|
|
MB = $276.01
|
Most Recent Note - 2/23/2011 2:21:40 PM
G - Down today on higher volume, its color code is changed to green as distributional pressure sends it more than -7% below its pivot point, raising concerns. Recent highs and its 50 DMA line in the $235-237 area define technical chart support levels to watch where more damaging losses would raise greater concerns. Recently reported strong earnings and technically rallied "straight up from the bottom" from an 11-week cup shaped base without a handle.
>>> The latest Featured Stock Update with an annotated graph appeared on 2/11/2011. Click here.
View all notes |
Alert me of new notes |
CANSLIM.net Company Profile |
SEC |
Zacks Reports |
StockTalk |
News |
Chart |
Request a new note
C
A N
S L
I M
|
CRUS
-
NASDAQ
Cirrus Logic Inc
ELECTRONICS - Semiconductor - Specialized
|
$23.80
|
+1.01
4.43% |
$23.84
|
2,369,925
70.86% of 50 DAV
50 DAV is 3,344,600
|
$25.48
-6.59%
|
1/28/2011
|
$20.69
|
PP = $19.17
|
|
MB = $20.13
|
 Most Recent Note - 2/25/2011 1:47:36 PM
G - Rebounding from the week's lows after a pullback near prior chart highs amid widespread weakness. Subsequent deterioration below its 2/23/11 low ($21.17) would raise concerns, technically, and any close below its significant prior high close ($20.54 on 7/26/10) would raise even greater concerns.
>>> The latest Featured Stock Update with an annotated graph appeared on 1/28/2011. Click here.
View all notes |
Alert me of new notes |
CANSLIM.net Company Profile |
SEC |
Zacks Reports |
StockTalk |
News |
Chart |
Request a new note
C
A N
S L
I M
|
CTSH
-
NASDAQ
Cognizant Tech Sol Cl A
COMPUTER SOFTWARE and SERVICES - Business Software and Services
|
$76.51
|
+1.58
2.11% |
$76.60
|
1,868,267
82.96% of 50 DAV
50 DAV is 2,252,000
|
$77.74
-1.58%
|
2/7/2011
|
$75.09
|
PP = $76.46
|
|
MB = $80.28
|
Most Recent Note - 2/25/2011 5:34:34 PM
Y - Color code is changed to yellow after showing resilience and closing the week just above its pivot point after finding support near its 50 DMA line.
>>> The latest Featured Stock Update with an annotated graph appeared on 2/8/2011. Click here.
View all notes |
Alert me of new notes |
CANSLIM.net Company Profile |
SEC |
Zacks Reports |
StockTalk |
News |
Chart |
Request a new note
C
A N
S L
I M
|
DECK
-
NASDAQ
Deckers Outdoor Corp
CONSUMER NON-DURABLES - Textile - Apparel Footwear
|
$88.30
|
-1.50
-1.67% |
$94.70
|
5,210,318
337.17% of 50 DAV
50 DAV is 1,545,300
|
$92.69
-4.74%
|
2/3/2011
|
$79.61
|
PP = $82.67
|
|
MB = $86.80
|
Most Recent Note - 2/25/2011 12:04:18 PM
G - Reported earnings +30% on +24% sales revenues for the quarter ended December 31, 2010 versus the year earlier. Churning heavy volume this week without making meaningful price progress above its December highs is action indicative of distributional pressure following its 2/17/11 technical breakout.
>>> The latest Featured Stock Update with an annotated graph appeared on 1/26/2011. Click here.
View all notes |
Alert me of new notes |
CANSLIM.net Company Profile |
SEC |
Zacks Reports |
StockTalk |
News |
Chart |
Request a new note
C
A N
S L
I M
|
Symbol/Exchange
Company Name
Industry Group |
PRICE |
CHANGE
(%Change) |
Day High |
Volume
(% DAV)
(% 50 day avg vol) |
52 Wk Hi
% From Hi |
Featured
Date |
Price
Featured |
Pivot Featured |
|
Max Buy |
EZCH
-
NASDAQ
Ezchip Semiconductor Ltd
ELECTRONICS - Semiconductor - Specialized
|
$29.91
|
+0.72
2.47% |
$30.00
|
289,192
74.59% of 50 DAV
50 DAV is 387,700
|
$33.48
-10.66%
|
12/2/2010
|
$27.53
|
PP = $26.00
|
|
MB = $27.30
|
Most Recent Note - 2/24/2011 5:22:39 PM
G - Small gain today on average volume, still finishing below its 50 DMA line which may now act as resistance. A prompt rebound above its short-term average would help its outlook, meanwhile it faces overhead supply now up through the $33 area which may hinder its ability to rally.
>>> The latest Featured Stock Update with an annotated graph appeared on 1/21/2011. Click here.
View all notes |
Alert me of new notes |
CANSLIM.net Company Profile |
SEC |
Zacks Reports |
StockTalk |
News |
Chart |
Request a new note
C
A N
S L
I M
|
EZPW
-
NASDAQ
Ezcorp Inc Cl A
SPECIALTY RETAIL - Specialty Retail, Other
|
$28.55
|
+0.41
1.46% |
$28.72
|
278,372
70.74% of 50 DAV
50 DAV is 393,500
|
$29.94
-4.64%
|
2/18/2011
|
$27.94
|
PP = $30.04
|
|
MB = $31.54
|
Most Recent Note - 2/25/2011 5:42:52 PM
Y - Rose on light volume today, rising further above its 50 DMA line and showing resilience. Subsequent gains with heavy volume above its pivot point may trigger a new (or add-on) technical buy signal. Recent low ($25.56 on 1/25/11) defines an important support level now.
>>> The latest Featured Stock Update with an annotated graph appeared on 2/3/2011. Click here.
View all notes |
Alert me of new notes |
CANSLIM.net Company Profile |
SEC |
Zacks Reports |
StockTalk |
News |
Chart |
Request a new note
C
A N
S L
I M
|
FOSL
-
NASDAQ
Fossil Inc
CONSUMER DURABLES - Recreational Goods, Other
|
$77.87
|
+3.06
4.09% |
$78.00
|
1,220,551
155.17% of 50 DAV
50 DAV is 786,600
|
$83.68
-6.94%
|
2/1/2011
|
$73.30
|
PP = $74.44
|
|
MB = $78.16
|
Most Recent Note - 2/25/2011 5:19:22 PM
G - Finished near the session high with a solid gain backed by above average volume. Found support this week near its 50 DMA line and prior resistance in the $74 area previously noted as defining chart support. See the latest FSU analysis for more details and an annotated graph.
>>> The latest Featured Stock Update with an annotated graph appeared on 2/24/2011. Click here.
View all notes |
Alert me of new notes |
CANSLIM.net Company Profile |
SEC |
Zacks Reports |
StockTalk |
News |
Chart |
Request a new note
C
A N
S L
I M
|
GSIT
-
NASDAQ
G S I Technology Inc
ELECTRONICS - Semiconductor - Broad Line
|
$9.45
|
+0.16
1.72% |
$9.48
|
92,571
37.00% of 50 DAV
50 DAV is 250,200
|
$10.20
-7.35%
|
2/18/2011
|
$10.08
|
PP = $10.25
|
|
MB = $10.76
|
Most Recent Note - 2/25/2011 5:23:35 PM
G - Gains on lighter volume halted its slide at its 50 DMA line this week. A subsequent rally for a close above last week's close ($9.78) would help its outlook following its gap down on 2/22/11 and damaging losses on higher volume.
>>> The latest Featured Stock Update with an annotated graph appeared on 2/18/2011. Click here.
View all notes |
Alert me of new notes |
CANSLIM.net Company Profile |
SEC |
Zacks Reports |
StockTalk |
News |
Chart |
Request a new note
C
A N
S L
I M
|
HMSY
-
NASDAQ
H M S Holdings Corp
COMPUTER SOFTWARE and SERVICES - Healthcare Information Service
|
$74.50
|
+0.90
1.22% |
$74.50
|
191,606
119.53% of 50 DAV
50 DAV is 160,300
|
$77.43
-3.78%
|
11/19/2010
|
$61.89
|
PP = $63.01
|
|
MB = $66.16
|
Most Recent Note - 2/25/2011 5:40:29 PM
G - Held its ground since its 2/23/11 gap down broke a streak of 15 consecutive gains. Extended from any sound base pattern, support to watch is defined by prior chart highs and its 50 DMA line in the $67 area.
>>> The latest Featured Stock Update with an annotated graph appeared on 2/16/2011. Click here.
View all notes |
Alert me of new notes |
CANSLIM.net Company Profile |
SEC |
Zacks Reports |
StockTalk |
News |
Chart |
Request a new note
C
A N
S L
I M
|
Symbol/Exchange
Company Name
Industry Group |
PRICE |
CHANGE
(%Change) |
Day High |
Volume
(% DAV)
(% 50 day avg vol) |
52 Wk Hi
% From Hi |
Featured
Date |
Price
Featured |
Pivot Featured |
|
Max Buy |
JOBS
-
NASDAQ
Fifty One Job Inc Ads
DIVERSIFIED SERVICES - Staffing and; Outsourcing Service
|
$60.23
|
+3.82
6.77% |
$60.60
|
135,790
102.64% of 50 DAV
50 DAV is 132,300
|
$61.99
-2.84%
|
2/7/2011
|
$59.23
|
PP = $61.38
|
|
MB = $64.45
|
Most Recent Note - 2/25/2011 1:41:07 PM
Y - Small gap up today, finding support this week at its 50 DMA line. Its color code is changed to yellow based on its resilience near its short-term average. A subsequent rally to new highs with above average volume may confirm a new buy signal, meanwhile its recent low ($52.58 on 1/28/11) defines another important support level below its 50 DMA line where violations would raise serious concerns and trigger technical sell signals.
>>> The latest Featured Stock Update with an annotated graph appeared on 2/7/2011. Click here.
View all notes |
Alert me of new notes |
CANSLIM.net Company Profile |
SEC |
Zacks Reports |
StockTalk |
News |
Chart |
Request a new note
C
A N
S L
I M
|
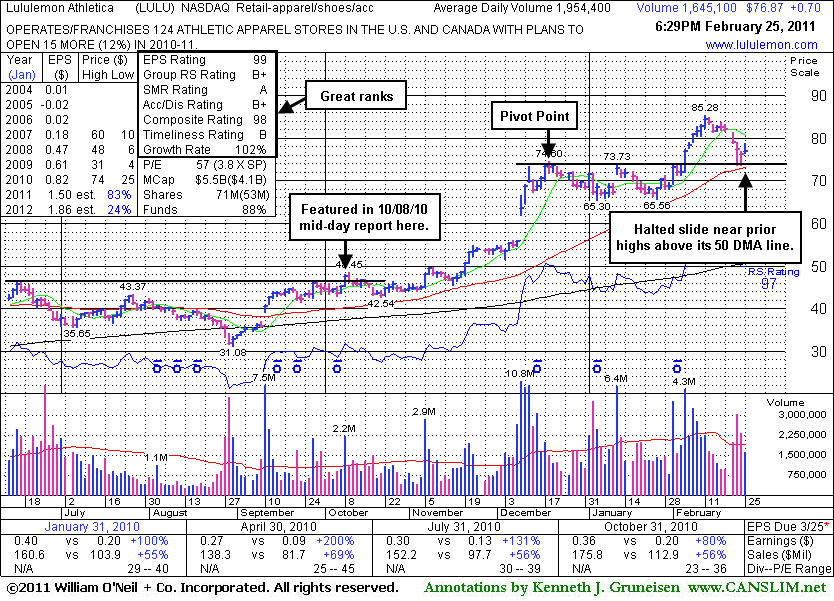
LULU
-
NASDAQ
Lululemon Athletica
MANUFACTURING - Textile Manufacturing
|
$76.83
|
+0.66
0.87% |
$78.66
|
1,656,238
80.43% of 50 DAV
50 DAV is 2,059,300
|
$85.28
-9.91%
|
1/26/2011
|
$68.11
|
PP = $74.70
|
|
MB = $78.44
|
Most Recent Note - 2/25/2011 6:57:37 PM
Y - Posted a small gain on light volume, halting its slide after 5 consecutive losses and some distributional pressure this week. See the latest FSU analysis for more details and a new annotated graph.
>>> The latest Featured Stock Update with an annotated graph appeared on 2/25/2011. Click here.
View all notes |
Alert me of new notes |
CANSLIM.net Company Profile |
SEC |
Zacks Reports |
StockTalk |
News |
Chart |
Request a new note
C
A N
S L
I M
|
MWIV
-
NASDAQ
M W I Veterinary Supply
HEALTH SERVICES - Medical Instruments and; Supplies
|
$70.55
|
+2.33
3.42% |
$70.68
|
114,172
163.57% of 50 DAV
50 DAV is 69,800
|
$72.27
-2.38%
|
11/4/2010
|
$61.79
|
PP = $59.60
|
|
MB = $62.58
|
Most Recent Note - 2/25/2011 5:28:18 PM
G - Closed near the session high again today with a second consecutive gain backed by above average volume. That helped it post a gain with above average volume for its best ever close on its weekly chart. It found support near prior highs and its 50 DMA line but has not built a sound new base pattern.
>>> The latest Featured Stock Update with an annotated graph appeared on 2/2/2011. Click here.
View all notes |
Alert me of new notes |
CANSLIM.net Company Profile |
SEC |
Zacks Reports |
StockTalk |
News |
Chart |
Request a new note
C
A N
S L
I M
|
NFLX
-
NASDAQ
Netflix Inc
SPECIALTY RETAIL - Music and Video Stores
|
$212.44
|
-2.74
-1.27% |
$217.49
|
4,214,025
76.57% of 50 DAV
50 DAV is 5,503,800
|
$247.55
-14.18%
|
1/10/2011
|
$187.88
|
PP = $209.34
|
|
MB = $219.81
|
Most Recent Note - 2/23/2011 2:47:50 PM
G - Gapped down for a second consecutive session, its damaging loss extends it losing streak to 6 consecutive trading days. It is -14.3% off its high and enduring distributional pressure amid widespread market weakness, now testing prior resistance near its old high ($209) previously noted as defining support to watch above its 50 DMA line.
>>> The latest Featured Stock Update with an annotated graph appeared on 2/23/2011. Click here.
View all notes |
Alert me of new notes |
CANSLIM.net Company Profile |
SEC |
Zacks Reports |
StockTalk |
News |
Chart |
Request a new note
C
A N
S L
I M
|
OPEN
-
NASDAQ
Opentable Inc
INTERNET - Internet Software and Services
|
$89.82
|
+1.10
1.24% |
$90.96
|
852,736
87.32% of 50 DAV
50 DAV is 976,600
|
$95.97
-6.41%
|
1/5/2011
|
$74.05
|
PP = $76.79
|
|
MB = $80.63
|
Most Recent Note - 2/24/2011 5:55:42 PM
G - Posted a gain today with above average volume and finished near the session high, breaking a streak of 4 consecutive losses. Prior highs near $82 define support to watch above its 50 DMA line.
>>> The latest Featured Stock Update with an annotated graph appeared on 2/15/2011. Click here.
View all notes |
Alert me of new notes |
CANSLIM.net Company Profile |
SEC |
Zacks Reports |
StockTalk |
News |
Chart |
Request a new note
C
A N
S L
I M
|
Symbol/Exchange
Company Name
Industry Group |
PRICE |
CHANGE
(%Change) |
Day High |
Volume
(% DAV)
(% 50 day avg vol) |
52 Wk Hi
% From Hi |
Featured
Date |
Price
Featured |
Pivot Featured |
|
Max Buy |
ORCL
-
NASDAQ
Oracle Corp
COMPUTER SOFTWARE and SERVICES - Application Software
|
$32.95
|
+0.70
2.17% |
$33.09
|
20,850,110
80.24% of 50 DAV
50 DAV is 25,983,200
|
$33.71
-2.25%
|
1/20/2011
|
$32.31
|
PP = $32.37
|
|
MB = $33.99
|
Most Recent Note - 2/25/2011 5:37:42 PM
Y - Found support at its 50 DMA line this week and rebounded back above its pivot point with a gain on light volume, closing -2.3% from its 52-week high.
>>> The latest Featured Stock Update with an annotated graph appeared on 2/22/2011. Click here.
View all notes |
Alert me of new notes |
CANSLIM.net Company Profile |
SEC |
Zacks Reports |
StockTalk |
News |
Chart |
Request a new note
C
A N
S L
I M
|
PAY
-
NYSE
Verifone Systems Inc
COMPUTER HARDWARE - Transaction Automation Systems
|
$45.94
|
+0.81
1.79% |
$46.67
|
1,626,063
108.43% of 50 DAV
50 DAV is 1,499,600
|
$49.91
-7.95%
|
1/27/2011
|
$41.77
|
PP = $44.97
|
|
MB = $47.22
|
Most Recent Note - 2/25/2011 1:53:17 PM
Y - Rebounding after distributional pressure earlier this week led to a brief slump just below its pivot point and old high close ($44.26 on 1/13/11). Support to watch is its 50 DMA line.
>>> The latest Featured Stock Update with an annotated graph appeared on 1/27/2011. Click here.
View all notes |
Alert me of new notes |
CANSLIM.net Company Profile |
SEC |
Zacks Reports |
StockTalk |
News |
Chart |
Request a new note
C
A N
S L
I M
|
PCLN
-
NASDAQ
Priceline.Com Inc
INTERNET - Internet Software and Services
|
$460.03
|
-2.31
-0.50% |
$465.97
|
1,229,801
125.32% of 50 DAV
50 DAV is 981,300
|
$469.40
-2.00%
|
1/3/2011
|
$399.55
|
PP = $428.20
|
|
MB = $449.61
|
Most Recent Note - 2/24/2011 12:52:13 PM
Y - Gapped up today for a considerable gain with heavy volume, reclaiming recently lost ground and touching a new 52-week high after reporting earnings +71% on +35% sales revenues for the quarter ended December 31, 2010 versus the year ago period. Prompt support near its 50 DMA line and its gap up are indicative of institutional accumulation in the face of widespread market weakness. More serious concerns and technical sell signals would be triggered by subsequent damaging losses below today's low ($116.00) coinciding with its 1/20/11 chart low.
>>> The latest Featured Stock Update with an annotated graph appeared on 2/14/2011. Click here.
View all notes |
Alert me of new notes |
CANSLIM.net Company Profile |
SEC |
Zacks Reports |
StockTalk |
News |
Chart |
Request a new note
C
A N
S L
I M
|
RAX
-
NYSE
Rackspace Hosting Inc
INTERNET - Internet Software and; Services
|
$37.16
|
+0.55
1.50% |
$37.44
|
1,337,440
74.18% of 50 DAV
50 DAV is 1,803,000
|
$40.62
-8.52%
|
1/10/2011
|
$22.84
|
PP = $32.76
|
|
MB = $34.40
|
Most Recent Note - 2/23/2011 5:00:27 PM
G - Down today with above average volume, finishing -11.7% off its all-time high. Amid widespread market weakness it has slumped back to prior highs near $35 previously noted as defining support to watch above its 50 DMA line.
>>> The latest Featured Stock Update with an annotated graph appeared on 2/9/2011. Click here.
View all notes |
Alert me of new notes |
CANSLIM.net Company Profile |
SEC |
Zacks Reports |
StockTalk |
News |
Chart |
Request a new note
C
A N
S L
I M
|
TIBX
-
NASDAQ
Tibco Software Inc
COMPUTER SOFTWARE and SERVICES - Business Software and Services
|
$24.58
|
+0.57
2.37% |
$24.81
|
1,322,460
47.88% of 50 DAV
50 DAV is 2,762,000
|
$25.94
-5.24%
|
2/1/2011
|
$24.35
|
PP = $22.18
|
|
MB = $23.29
|
Most Recent Note - 2/24/2011 6:13:29 PM
G - Up today with above average volume heavier than the 2 prior losing sessions. Consolidating above prior highs in the $22 area defining support along with its 50 DMA line.
>>> The latest Featured Stock Update with an annotated graph appeared on 2/10/2011. Click here.
View all notes |
Alert me of new notes |
CANSLIM.net Company Profile |
SEC |
Zacks Reports |
StockTalk |
News |
Chart |
Request a new note
C
A N
S L
I M
|
Symbol/Exchange
Company Name
Industry Group |
PRICE |
CHANGE
(%Change) |
Day High |
Volume
(% DAV)
(% 50 day avg vol) |
52 Wk Hi
% From Hi |
Featured
Date |
Price
Featured |
Pivot Featured |
|
Max Buy |
UA
-
NYSE
Under Armour Inc Cl A
CONSUMER NON-DURABLES - Textile - Apparel Clothing
|
$66.02
|
+1.46
2.26% |
$67.07
|
666,328
84.05% of 50 DAV
50 DAV is 792,800
|
$70.43
-6.26%
|
1/27/2011
|
$58.31
|
PP = $56.99
|
|
MB = $59.84
|
Most Recent Note - 2/25/2011 5:30:59 PM
G - Consolidating well above prior resistance and its 50 DMA line in the $60 area that define chart support to watch. It is extended from a sound base.
>>> The latest Featured Stock Update with an annotated graph appeared on 2/1/2011. Click here.
View all notes |
Alert me of new notes |
CANSLIM.net Company Profile |
SEC |
Zacks Reports |
StockTalk |
News |
Chart |
Request a new note
C
A N
S L
I M
|
ULTA
-
NASDAQ
Ulta Salon Cosm & Frag
SPECIALTY RETAIL - Specialty Retail, Other
|
$42.97
|
+1.79
4.35% |
$43.43
|
397,859
73.19% of 50 DAV
50 DAV is 543,600
|
$44.06
-2.47%
|
1/6/2011
|
$36.12
|
PP = $37.34
|
|
MB = $39.21
|
Most Recent Note - 2/25/2011 1:36:05 PM
G - Gapped up today, rallying near all-time highs without great volume conviction. It has repeatedly been noted - "Extended from a sound base pattern, and prior highs in the $37-38 area define chart support to watch above its 50 DMA line."
>>> The latest Featured Stock Update with an annotated graph appeared on 2/17/2011. Click here.
View all notes |
Alert me of new notes |
CANSLIM.net Company Profile |
SEC |
Zacks Reports |
StockTalk |
News |
Chart |
Request a new note
C
A N
S L
I M
|