Symbol/Exchange
Company Name
Industry Group |
PRICE |
CHANGE
(%Change) |
Day High |
Volume
(% DAV)
(% 50 day avg vol) |
52 Wk Hi
% From Hi |
Featured
Date |
Price
Featured |
Pivot Featured |
|
Max Buy |
BIDU
-
NASDAQ
Baidu Inc Ads
INTERNET - Internet Information Providers
|
$121.16
|
+0.57
0.47% |
$123.12
|
4,372,917
58.02% of 50 DAV
50 DAV is 7,536,600
|
$131.63
-7.95%
|
2/1/2011
|
$117.74
|
PP = $112.08
|
|
MB = $117.68
|
 Most Recent Note - 2/28/2011 6:04:05 PM
G - Posted 3 consecutive gains on lighter volume following damaging losses with higher than average volume. Recently slumped near prior highs in the $112-115 area previously noted as defining initial chart support to watch above its 50 DMA line.
>>> The latest Featured Stock Update with an annotated graph appeared on 2/2/2011. Click here.
View all notes |
Alert me of new notes |
CANSLIM.net Company Profile |
SEC |
Zacks Reports |
StockTalk |
News |
Chart |
Request a new note
C
A N
S L
I M


|
CMG
-
NYSE
Chipotle Mexican Grill
LEISURE - Restaurants
|
$245.00
|
-3.36
-1.35% |
$252.73
|
710,817
68.28% of 50 DAV
50 DAV is 1,041,100
|
$275.00
-10.91%
|
2/11/2011
|
$271.15
|
PP = $262.87
|
|
MB = $276.01
|
Most Recent Note - 2/28/2011 6:06:44 PM
G - Color code was changed to green after distributional pressure last week led to trading more than -7% below its pivot point, raising concerns. Recent highs and its 50 DMA line in the $235-237 area define technical chart support levels to watch where more damaging losses would raise greater concerns.
>>> The latest Featured Stock Update with an annotated graph appeared on 2/11/2011. Click here.
View all notes |
Alert me of new notes |
CANSLIM.net Company Profile |
SEC |
Zacks Reports |
StockTalk |
News |
Chart |
Request a new note
C
A N
S L
I M
|
CRUS
-
NASDAQ
Cirrus Logic Inc
ELECTRONICS - Semiconductor - Specialized
|
$23.35
|
-0.45
-1.89% |
$24.34
|
2,744,052
82.53% of 50 DAV
50 DAV is 3,324,800
|
$25.48
-8.36%
|
1/28/2011
|
$20.69
|
PP = $19.17
|
|
MB = $20.13
|
Most Recent Note - 2/28/2011 6:07:39 PM
G - Found support after a pullback near prior chart highs last week amid widespread weakness. Subsequent deterioration below its 2/23/11 low ($21.17) would raise concerns, technically, and any close below its significant prior high close ($20.54 on 7/26/10) would raise even greater concerns.
>>> The latest Featured Stock Update with an annotated graph appeared on 1/28/2011. Click here.
View all notes |
Alert me of new notes |
CANSLIM.net Company Profile |
SEC |
Zacks Reports |
StockTalk |
News |
Chart |
Request a new note
C
A N
S L
I M
|
CTSH
-
NASDAQ
Cognizant Tech Sol Cl A
COMPUTER SOFTWARE and SERVICES - Business Software and Services
|
$76.87
|
+0.36
0.47% |
$77.11
|
2,091,672
92.25% of 50 DAV
50 DAV is 2,267,400
|
$77.74
-1.12%
|
2/7/2011
|
$75.09
|
PP = $76.46
|
|
MB = $80.28
|
Most Recent Note - 2/28/2011 6:12:45 PM
Y - Color code was changed to yellow after showing resilience following a pullback near its 50 DMA line. No overhead supply remains to hinder its progress, but is has stalled since its 2/08/11 breakout with bare minimum volume. Confirming gains for new highs with above average volume would be a welcome reassurance of institutional accumulation.
>>> The latest Featured Stock Update with an annotated graph appeared on 2/8/2011. Click here.
View all notes |
Alert me of new notes |
CANSLIM.net Company Profile |
SEC |
Zacks Reports |
StockTalk |
News |
Chart |
Request a new note
C
A N
S L
I M
|
DECK
-
NASDAQ
Deckers Outdoor Corp
CONSUMER NON-DURABLES - Textile - Apparel Footwear
|
$88.22
|
-0.08
-0.09% |
$89.01
|
1,777,210
107.57% of 50 DAV
50 DAV is 1,652,100
|
$94.70
-6.84%
|
2/3/2011
|
$79.61
|
PP = $82.67
|
|
MB = $86.80
|
Most Recent Note - 2/28/2011 6:15:05 PM
G - Holding its ground near all-time highs, but "churning" higher volume action has been indicative of distributional pressure following its 2/17/11 technical breakout.. Reported earnings +30% on +24% sales revenues for the quarter ended December 31, 2010 versus the year earlier.
>>> The latest Featured Stock Update with an annotated graph appeared on 1/26/2011. Click here.
View all notes |
Alert me of new notes |
CANSLIM.net Company Profile |
SEC |
Zacks Reports |
StockTalk |
News |
Chart |
Request a new note
C
A N
S L
I M
|
Symbol/Exchange
Company Name
Industry Group |
PRICE |
CHANGE
(%Change) |
Day High |
Volume
(% DAV)
(% 50 day avg vol) |
52 Wk Hi
% From Hi |
Featured
Date |
Price
Featured |
Pivot Featured |
|
Max Buy |
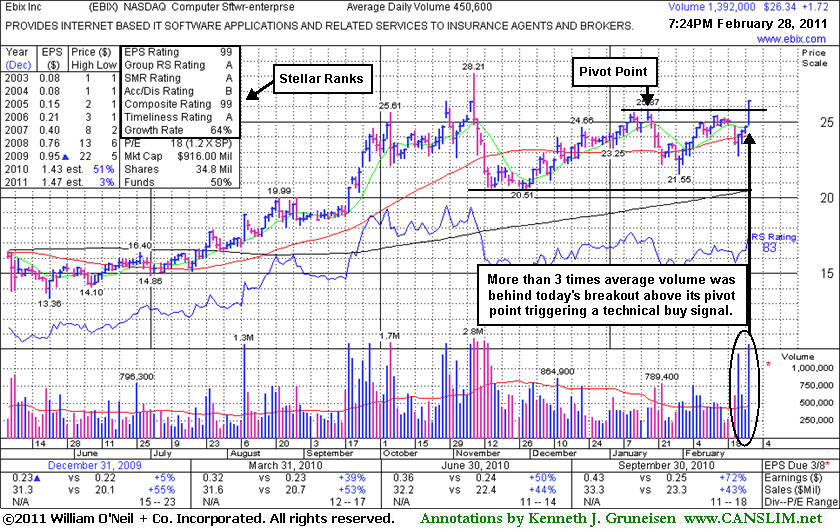
EBIX
-
NASDAQ
Ebix Inc
COMPUTER SOFTWARE and SERVICES - Business Software and Services
|
$26.34
|
+1.72
6.99% |
$26.42
|
1,478,552
328.13% of 50 DAV
50 DAV is 450,600
|
$28.21
-6.63%
|
2/28/2011
|
$25.70
|
PP = $25.97
|
|
MB = $27.27
|
Most Recent Note - 2/28/2011 6:19:04 PM
Y - Finished the session with more than 3 times average volume while closing near the day's high well above its pivot point, triggering a technical buy signal. Today's 4th consecutive gain helped it trade above its January high after a choppy new 6-week flat base. In the mid-day report today its color code was changed to yellow with new pivot point cited based on its 1/18/11 high plus ten cents as it was noted - "Little resistance remains due to overhead supply. Since dropped from the Featured Stocks list on 11/16/10 the prior resistance previously noted in the $20 area acted as support and its fundamentals have remained strong. "
>>> The latest Featured Stock Update with an annotated graph appeared on 9/24/2010. Click here.
View all notes |
Alert me of new notes |
CANSLIM.net Company Profile |
SEC |
Zacks Reports |
StockTalk |
News |
Chart |
Request a new note
C
A N
S L
I M
|
EZCH
-
NASDAQ
Ezchip Semiconductor Ltd
ELECTRONICS - Semiconductor - Specialized
|
$30.08
|
+0.17
0.57% |
$30.28
|
244,877
63.18% of 50 DAV
50 DAV is 387,600
|
$33.48
-10.16%
|
12/2/2010
|
$27.53
|
PP = $26.00
|
|
MB = $27.30
|
Most Recent Note - 2/28/2011 6:20:18 PM
G - Small gain for a 4th consecutive session today on below average volume, still lingering below its 50 DMA line which may now act as resistance. A convincing rebound above its short-term average would help its outlook, meanwhile it faces overhead supply now up through the $33 area which may hinder its ability to rally.
>>> The latest Featured Stock Update with an annotated graph appeared on 1/21/2011. Click here.
View all notes |
Alert me of new notes |
CANSLIM.net Company Profile |
SEC |
Zacks Reports |
StockTalk |
News |
Chart |
Request a new note
C
A N
S L
I M
|
EZPW
-
NASDAQ
Ezcorp Inc Cl A
SPECIALTY RETAIL - Specialty Retail, Other
|
$28.68
|
+0.13
0.46% |
$29.02
|
257,781
64.92% of 50 DAV
50 DAV is 397,100
|
$29.94
-4.21%
|
2/18/2011
|
$27.94
|
PP = $30.04
|
|
MB = $31.54
|
Most Recent Note - 2/28/2011 6:20:58 PM
Y - Up again on light volume today, rising further above its 50 DMA line and showing resilience. Subsequent gains with heavy volume above its pivot point may trigger a new (or add-on) technical buy signal. Recent low ($25.56 on 1/25/11) defines an important support level now.
>>> The latest Featured Stock Update with an annotated graph appeared on 2/3/2011. Click here.
View all notes |
Alert me of new notes |
CANSLIM.net Company Profile |
SEC |
Zacks Reports |
StockTalk |
News |
Chart |
Request a new note
C
A N
S L
I M
|
FOSL
-
NASDAQ
Fossil Inc
CONSUMER DURABLES - Recreational Goods, Other
|
$76.74
|
-1.13
-1.45% |
$78.26
|
1,108,562
136.35% of 50 DAV
50 DAV is 813,000
|
$83.68
-8.29%
|
2/1/2011
|
$73.30
|
PP = $74.44
|
|
MB = $78.16
|
Most Recent Note - 2/28/2011 6:22:24 PM
G - Found support last week near its 50 DMA line and it is consolidating above prior resistance in the $74 area previously noted as defining chart support. See the latest FSU analysis for more details and an annotated graph.
>>> The latest Featured Stock Update with an annotated graph appeared on 2/24/2011. Click here.
View all notes |
Alert me of new notes |
CANSLIM.net Company Profile |
SEC |
Zacks Reports |
StockTalk |
News |
Chart |
Request a new note
C
A N
S L
I M
|
GSIT
-
NASDAQ
G S I Technology Inc
ELECTRONICS - Semiconductor - Broad Line
|
$9.41
|
-0.04
-0.42% |
$9.69
|
154,434
63.68% of 50 DAV
50 DAV is 242,500
|
$10.20
-7.75%
|
2/18/2011
|
$10.08
|
PP = $10.25
|
|
MB = $10.76
|
Most Recent Note - 2/28/2011 6:23:56 PM
G - Holding its ground after gains on lighter volume halted its slide at its 50 DMA line last week. A subsequent rally for a close above its 2/18/11 close ($9.78) would help its outlook following its gap down on 2/22/11 and damaging losses on higher volume.
>>> The latest Featured Stock Update with an annotated graph appeared on 2/18/2011. Click here.
View all notes |
Alert me of new notes |
CANSLIM.net Company Profile |
SEC |
Zacks Reports |
StockTalk |
News |
Chart |
Request a new note
C
A N
S L
I M
|
Symbol/Exchange
Company Name
Industry Group |
PRICE |
CHANGE
(%Change) |
Day High |
Volume
(% DAV)
(% 50 day avg vol) |
52 Wk Hi
% From Hi |
Featured
Date |
Price
Featured |
Pivot Featured |
|
Max Buy |
HMSY
-
NASDAQ
H M S Holdings Corp
COMPUTER SOFTWARE and SERVICES - Healthcare Information Service
|
$75.56
|
+1.06
1.42% |
$76.00
|
139,532
86.02% of 50 DAV
50 DAV is 162,200
|
$77.43
-2.42%
|
11/19/2010
|
$61.89
|
PP = $63.01
|
|
MB = $66.16
|
Most Recent Note - 2/28/2011 6:25:09 PM
G - Rose on light volume today for its second-best close ever. Held its ground since its 2/23/11 gap down broke a streak of 15 consecutive gains. Extended from any sound base pattern, support to watch is defined by prior chart highs and its 50 DMA line in the $67 area.
>>> The latest Featured Stock Update with an annotated graph appeared on 2/16/2011. Click here.
View all notes |
Alert me of new notes |
CANSLIM.net Company Profile |
SEC |
Zacks Reports |
StockTalk |
News |
Chart |
Request a new note
C
A N
S L
I M
|
JOBS
-
NASDAQ
Fifty One Job Inc Ads
DIVERSIFIED SERVICES - Staffing and; Outsourcing Service
|
$59.67
|
-0.56
-0.93% |
$64.55
|
341,177
263.46% of 50 DAV
50 DAV is 129,500
|
$61.99
-3.74%
|
2/7/2011
|
$59.23
|
PP = $61.38
|
|
MB = $64.45
|
Most Recent Note - 2/28/2011 6:26:49 PM
Y - Slumped into the red today following a gap up for a new 52-week high after reporting earnings +39% on +38% sales revenues for the quarter ended December 31, 2010 versus the year ago period. Its color code was changed to yellow based on its resilience near its short-term average again last week as it was noted - "A subsequent rally to new highs with above average volume may confirm a new buy signal, meanwhile its recent low ($52.58 on 1/28/11) defines another important support level below its 50 DMA line where violations would raise serious concerns and trigger technical sell signals."
>>> The latest Featured Stock Update with an annotated graph appeared on 2/7/2011. Click here.
View all notes |
Alert me of new notes |
CANSLIM.net Company Profile |
SEC |
Zacks Reports |
StockTalk |
News |
Chart |
Request a new note
C
A N
S L
I M
|
LULU
-
NASDAQ
Lululemon Athletica
MANUFACTURING - Textile Manufacturing
|
$77.59
|
+0.76
0.99% |
$78.50
|
2,645,293
136.67% of 50 DAV
50 DAV is 1,935,500
|
$85.28
-9.02%
|
1/26/2011
|
$68.11
|
PP = $74.70
|
|
MB = $78.44
|
Most Recent Note - 2/28/2011 6:27:57 PM
Y - Posted a small gain today with higher volume. Halted its slide above its 50 DMA line after 5 consecutive losses and some distributional pressure last week.
>>> The latest Featured Stock Update with an annotated graph appeared on 2/25/2011. Click here.
View all notes |
Alert me of new notes |
CANSLIM.net Company Profile |
SEC |
Zacks Reports |
StockTalk |
News |
Chart |
Request a new note
C
A N
S L
I M
|
MWIV
-
NASDAQ
M W I Veterinary Supply
HEALTH SERVICES - Medical Instruments and; Supplies
|
$69.22
|
-1.33
-1.89% |
$71.01
|
86,495
119.14% of 50 DAV
50 DAV is 72,600
|
$72.27
-4.22%
|
11/4/2010
|
$61.79
|
PP = $59.60
|
|
MB = $62.58
|
Most Recent Note - 2/28/2011 6:29:11 PM
G - Down today after a gain on Friday with above average volume led to its best ever close on its weekly chart. It found support near prior highs and its 50 DMA line but has not built a sound new base pattern.
>>> The latest Featured Stock Update with an annotated graph appeared on 2/2/2011. Click here.
View all notes |
Alert me of new notes |
CANSLIM.net Company Profile |
SEC |
Zacks Reports |
StockTalk |
News |
Chart |
Request a new note
C
A N
S L
I M
|
NFLX
-
NASDAQ
Netflix Inc
SPECIALTY RETAIL - Music and Video Stores
|
$206.67
|
-5.77
-2.72% |
$214.31
|
5,790,277
108.15% of 50 DAV
50 DAV is 5,354,000
|
$247.55
-16.51%
|
1/10/2011
|
$187.88
|
PP = $209.34
|
|
MB = $219.81
|
Most Recent Note - 2/28/2011 6:33:49 PM
G - Down today for its lowest close since its 1/27/11 breakaway gap. It is -16.5% off its high and enduring distributional pressure. Deterioration leading to a close below its significant prior high close ($205.90 on 11/30/10) would raise greater concerns, and its 50 DMA line defines the next important support level.
>>> The latest Featured Stock Update with an annotated graph appeared on 2/23/2011. Click here.
View all notes |
Alert me of new notes |
CANSLIM.net Company Profile |
SEC |
Zacks Reports |
StockTalk |
News |
Chart |
Request a new note
C
A N
S L
I M
|
Symbol/Exchange
Company Name
Industry Group |
PRICE |
CHANGE
(%Change) |
Day High |
Volume
(% DAV)
(% 50 day avg vol) |
52 Wk Hi
% From Hi |
Featured
Date |
Price
Featured |
Pivot Featured |
|
Max Buy |
OPEN
-
NASDAQ
Opentable Inc
INTERNET - Internet Software and Services
|
$88.87
|
-0.95
-1.06% |
$90.52
|
741,843
76.02% of 50 DAV
50 DAV is 975,800
|
$95.97
-7.40%
|
1/5/2011
|
$74.05
|
PP = $76.79
|
|
MB = $80.63
|
Most Recent Note - 2/28/2011 6:35:04 PM
G - Consolidating above prior highs near $82 that define support above its 50 DMA line. It has not built any recent sound base pattern.
>>> The latest Featured Stock Update with an annotated graph appeared on 2/15/2011. Click here.
View all notes |
Alert me of new notes |
CANSLIM.net Company Profile |
SEC |
Zacks Reports |
StockTalk |
News |
Chart |
Request a new note
C
A N
S L
I M
|
ORCL
-
NASDAQ
Oracle Corp
COMPUTER SOFTWARE and SERVICES - Application Software
|
$32.90
|
-0.05
-0.15% |
$33.23
|
19,406,701
76.25% of 50 DAV
50 DAV is 25,450,000
|
$33.71
-2.40%
|
1/20/2011
|
$32.31
|
PP = $32.37
|
|
MB = $33.99
|
Most Recent Note - 2/28/2011 6:36:24 PM
Y - Perched -2.4% from its 52-week high now, it found support at its 50 DMA line last week and rebounded back above its pivot point with a gain on light volume.
>>> The latest Featured Stock Update with an annotated graph appeared on 2/22/2011. Click here.
View all notes |
Alert me of new notes |
CANSLIM.net Company Profile |
SEC |
Zacks Reports |
StockTalk |
News |
Chart |
Request a new note
C
A N
S L
I M
|
PAY
-
NYSE
Verifone Systems Inc
COMPUTER HARDWARE - Transaction Automation Systems
|
$45.44
|
-0.50
-1.09% |
$46.62
|
1,696,297
113.12% of 50 DAV
50 DAV is 1,499,500
|
$49.91
-8.96%
|
1/27/2011
|
$41.77
|
PP = $44.97
|
|
MB = $47.22
|
Most Recent Note - 2/28/2011 6:39:22 PM
Y - Consolidating above its pivot point and old high close ($44.26 on 1/13/11), with additional support to watch at its 50 DMA line (now $42.46).
>>> The latest Featured Stock Update with an annotated graph appeared on 1/27/2011. Click here.
View all notes |
Alert me of new notes |
CANSLIM.net Company Profile |
SEC |
Zacks Reports |
StockTalk |
News |
Chart |
Request a new note
C
A N
S L
I M
|
PCLN
-
NASDAQ
Priceline.Com Inc
INTERNET - Internet Software and Services
|
$453.88
|
-6.15
-1.34% |
$463.99
|
1,333,227
127.00% of 50 DAV
50 DAV is 1,049,800
|
$469.40
-3.31%
|
1/3/2011
|
$399.55
|
PP = $428.20
|
|
MB = $449.61
|
Most Recent Note - 2/28/2011 6:41:50 PM
Y - Hovering near its 52-week high since its 2/24/11 gap up after reporting earnings +71% on +35% sales revenues for the quarter ended December 31, 2010 versus the year ago period. Prompt support near its 50 DMA line and its gap up were indicative of institutional accumulation in the face of widespread market weakness last week. More serious concerns and technical sell signals would be triggered by subsequent damaging losses below the $116.00 low previously noted.
>>> The latest Featured Stock Update with an annotated graph appeared on 2/14/2011. Click here.
View all notes |
Alert me of new notes |
CANSLIM.net Company Profile |
SEC |
Zacks Reports |
StockTalk |
News |
Chart |
Request a new note
C
A N
S L
I M
|
RAX
-
NYSE
Rackspace Hosting Inc
INTERNET - Internet Software and; Services
|
$36.91
|
-0.25
-0.67% |
$37.89
|
1,276,559
71.72% of 50 DAV
50 DAV is 1,780,000
|
$40.62
-9.13%
|
1/10/2011
|
$22.84
|
PP = $32.76
|
|
MB = $34.40
|
Most Recent Note - 2/28/2011 6:43:26 PM
G - Consolidating -9.1% off its all-time high today. Prior highs near $35 were previously noted as defining support to watch above its 50 DMA line.
>>> The latest Featured Stock Update with an annotated graph appeared on 2/9/2011. Click here.
View all notes |
Alert me of new notes |
CANSLIM.net Company Profile |
SEC |
Zacks Reports |
StockTalk |
News |
Chart |
Request a new note
C
A N
S L
I M
|
Symbol/Exchange
Company Name
Industry Group |
PRICE |
CHANGE
(%Change) |
Day High |
Volume
(% DAV)
(% 50 day avg vol) |
52 Wk Hi
% From Hi |
Featured
Date |
Price
Featured |
Pivot Featured |
|
Max Buy |
TIBX
-
NASDAQ
Tibco Software Inc
COMPUTER SOFTWARE and SERVICES - Business Software and Services
|
$24.62
|
+0.04
0.16% |
$24.89
|
1,276,384
45.70% of 50 DAV
50 DAV is 2,792,800
|
$25.94
-5.09%
|
2/1/2011
|
$24.35
|
PP = $22.18
|
|
MB = $23.29
|
Most Recent Note - 2/28/2011 6:45:28 PM
G - Consolidating -5.1% off its 52-week high today. Found support amid widespread market weakness last week well above prior highs in the $22 area defining support along with its 50 DMA line.
>>> The latest Featured Stock Update with an annotated graph appeared on 2/10/2011. Click here.
View all notes |
Alert me of new notes |
CANSLIM.net Company Profile |
SEC |
Zacks Reports |
StockTalk |
News |
Chart |
Request a new note
C
A N
S L
I M
|
UA
-
NYSE
Under Armour Inc Cl A
CONSUMER NON-DURABLES - Textile - Apparel Clothing
|
$66.23
|
+0.21
0.32% |
$66.61
|
451,186
58.30% of 50 DAV
50 DAV is 773,900
|
$70.43
-5.96%
|
1/27/2011
|
$58.31
|
PP = $56.99
|
|
MB = $59.84
|
Most Recent Note - 2/28/2011 6:47:01 PM
G - Still quietly consolidating well above prior resistance and its 50 DMA line in the $60 area that define chart support to watch. It has not formed any recent sound base pattern.
>>> The latest Featured Stock Update with an annotated graph appeared on 2/1/2011. Click here.
View all notes |
Alert me of new notes |
CANSLIM.net Company Profile |
SEC |
Zacks Reports |
StockTalk |
News |
Chart |
Request a new note
C
A N
S L
I M
|
ULTA
-
NASDAQ
Ulta Salon Cosm & Frag
SPECIALTY RETAIL - Specialty Retail, Other
|
$41.73
|
-1.24
-2.89% |
$43.37
|
482,780
89.77% of 50 DAV
50 DAV is 537,800
|
$44.06
-5.29%
|
1/6/2011
|
$36.12
|
PP = $37.34
|
|
MB = $39.21
|
Most Recent Note - 2/28/2011 6:48:36 PM
G - Quietly consolidating -5.3% off its all-time high today. It has repeatedly been noted - "Extended from a sound base pattern, and prior highs in the $37-38 area define chart support to watch above its 50 DMA line."
>>> The latest Featured Stock Update with an annotated graph appeared on 2/17/2011. Click here.
View all notes |
Alert me of new notes |
CANSLIM.net Company Profile |
SEC |
Zacks Reports |
StockTalk |
News |
Chart |
Request a new note
C
A N
S L
I M
|