***Last / Change / Volume data in this table is the closing quote data***
Symbol/Exchange
Company Name
Industry Group |
PRICE |
CHANGE
(%Change) |
Day High |
Volume
(% DAV)
(% 50 day avg vol) |
52 Wk Hi
% From Hi |
Featured
Date |
Price
Featured |
Pivot Featured |
|
Max Buy |
BIDU
-
NASDAQ
Baidu Inc Ads
INTERNET - Internet Information Providers
|
$118.81
|
+2.91
2.51% |
$119.86
|
6,791,411
90.79% of 50 DAV
50 DAV is 7,480,100
|
$131.63
-9.74%
|
2/1/2011
|
$117.74
|
PP = $112.08
|
|
MB = $117.68
|
 Most Recent Note - 2/24/2011 6:21:57 PM
G - Posted a gain on lighter volume today following damaging losses with higher than average volume. Recently slumping near prior highs in the $112-115 area previously noted as defining initial chart support to watch above its 50 DMA line.
>>> The latest Featured Stock Update with an annotated graph appeared on 2/2/2011. Click here.
View all notes |
Alert me of new notes |
CANSLIM.net Company Profile |
SEC |
Zacks Reports |
StockTalk |
News |
Chart |
Request a new note
C
A N
S L
I M


|
CMG
-
NYSE
Chipotle Mexican Grill
LEISURE - Restaurants
|
$245.30
|
+1.11
0.45% |
$246.98
|
1,015,048
98.41% of 50 DAV
50 DAV is 1,031,500
|
$275.00
-10.80%
|
2/11/2011
|
$271.15
|
PP = $262.87
|
|
MB = $276.01
|
Most Recent Note - 2/23/2011 2:21:40 PM
G - Down today on higher volume, its color code is changed to green as distributional pressure sends it more than -7% below its pivot point, raising concerns. Recent highs and its 50 DMA line in the $235-237 area define technical chart support levels to watch where more damaging losses would raise greater concerns. Recently reported strong earnings and technically rallied "straight up from the bottom" from an 11-week cup shaped base without a handle.
>>> The latest Featured Stock Update with an annotated graph appeared on 2/11/2011. Click here.
View all notes |
Alert me of new notes |
CANSLIM.net Company Profile |
SEC |
Zacks Reports |
StockTalk |
News |
Chart |
Request a new note
C
A N
S L
I M
|
CRUS
-
NASDAQ
Cirrus Logic Inc
ELECTRONICS - Semiconductor - Specialized
|
$22.79
|
+0.57
2.57% |
$22.90
|
3,025,943
92.52% of 50 DAV
50 DAV is 3,270,700
|
$25.48
-10.56%
|
1/28/2011
|
$20.69
|
PP = $19.17
|
|
MB = $20.13
|
Most Recent Note - 2/24/2011 6:24:21 PM
G - Positive reversal for a gain with lighter volume today after initially gapping down. Subsequent deterioration below initial support at a significant prior high close ($20.54 on 7/26/10) would raise concerns. Additional support may be expected near its 50 DMA line and other more recent chart highs in the $19 area.
>>> The latest Featured Stock Update with an annotated graph appeared on 1/28/2011. Click here.
View all notes |
Alert me of new notes |
CANSLIM.net Company Profile |
SEC |
Zacks Reports |
StockTalk |
News |
Chart |
Request a new note
C
A N
S L
I M
|
CTSH
-
NASDAQ
Cognizant Tech Sol Cl A
COMPUTER SOFTWARE and SERVICES - Business Software and Services
|
$74.93
|
+1.02
1.38% |
$75.09
|
2,899,224
130.63% of 50 DAV
50 DAV is 2,219,500
|
$77.74
-3.61%
|
2/7/2011
|
$75.09
|
PP = $76.46
|
|
MB = $80.28
|
Most Recent Note - 2/23/2011 1:46:17 PM
G - Weakness today has it slumping below its 50 DMA line, raising concerns. Color code is changed to green while deteriorating further below its pivot point amid widespread market weakness.
>>> The latest Featured Stock Update with an annotated graph appeared on 2/8/2011. Click here.
View all notes |
Alert me of new notes |
CANSLIM.net Company Profile |
SEC |
Zacks Reports |
StockTalk |
News |
Chart |
Request a new note
C
A N
S L
I M
|
DECK
-
NASDAQ
Deckers Outdoor Corp
CONSUMER NON-DURABLES - Textile - Apparel Footwear
|
$89.80
|
+2.60
2.98% |
$90.08
|
3,303,513
213.96% of 50 DAV
50 DAV is 1,544,000
|
$92.69
-3.12%
|
2/3/2011
|
$79.61
|
PP = $82.67
|
|
MB = $86.80
|
Most Recent Note - 2/24/2011 5:20:38 PM
G - Posted a solid gain today with volume nearly 2 times its average, finishing near the session high for its 3rd best close ever. Reported strong earnings and sales for the quarter ended December 31, 2010 versus the year earlier after the close. Color code is changed to green following dips below its "max buy" level this week.
>>> The latest Featured Stock Update with an annotated graph appeared on 1/26/2011. Click here.
View all notes |
Alert me of new notes |
CANSLIM.net Company Profile |
SEC |
Zacks Reports |
StockTalk |
News |
Chart |
Request a new note
C
A N
S L
I M
|
Symbol/Exchange
Company Name
Industry Group |
PRICE |
CHANGE
(%Change) |
Day High |
Volume
(% DAV)
(% 50 day avg vol) |
52 Wk Hi
% From Hi |
Featured
Date |
Price
Featured |
Pivot Featured |
|
Max Buy |
EZCH
-
NASDAQ
Ezchip Semiconductor Ltd
ELECTRONICS - Semiconductor - Specialized
|
$29.19
|
+0.33
1.14% |
$30.06
|
381,077
99.81% of 50 DAV
50 DAV is 381,800
|
$33.48
-12.81%
|
12/2/2010
|
$27.53
|
PP = $26.00
|
|
MB = $27.30
|
Most Recent Note - 2/24/2011 5:22:39 PM
G - Small gain today on average volume, still finishing below its 50 DMA line which may now act as resistance. A prompt rebound above its short-term average would help its outlook, meanwhile it faces overhead supply now up through the $33 area which may hinder its ability to rally.
>>> The latest Featured Stock Update with an annotated graph appeared on 1/21/2011. Click here.
View all notes |
Alert me of new notes |
CANSLIM.net Company Profile |
SEC |
Zacks Reports |
StockTalk |
News |
Chart |
Request a new note
C
A N
S L
I M
|
EZPW
-
NASDAQ
Ezcorp Inc Cl A
SPECIALTY RETAIL - Specialty Retail, Other
|
$28.14
|
+0.75
2.74% |
$28.24
|
453,452
116.99% of 50 DAV
50 DAV is 387,600
|
$29.94
-6.01%
|
2/18/2011
|
$27.94
|
PP = $30.04
|
|
MB = $31.54
|
Most Recent Note - 2/24/2011 5:25:14 PM
Y - Rebounded for a close above its 50 DMA line today, still showing resilience. Subsequent gains with heavy volume above its pivot point may trigger a new (or add-on) technical buy signal. Recent low ($25.56 on 1/25/11) defines an important support level now.
>>> The latest Featured Stock Update with an annotated graph appeared on 2/3/2011. Click here.
View all notes |
Alert me of new notes |
CANSLIM.net Company Profile |
SEC |
Zacks Reports |
StockTalk |
News |
Chart |
Request a new note
C
A N
S L
I M
|
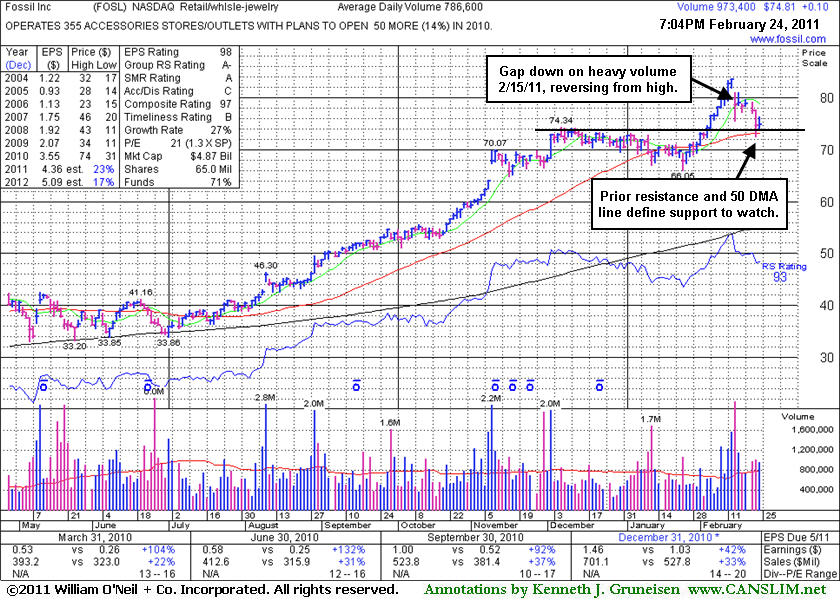
FOSL
-
NASDAQ
Fossil Inc
CONSUMER DURABLES - Recreational Goods, Other
|
$74.81
|
+0.10
0.13% |
$76.27
|
973,418
125.44% of 50 DAV
50 DAV is 776,000
|
$83.68
-10.60%
|
2/1/2011
|
$73.30
|
PP = $74.44
|
|
MB = $78.16
|
Most Recent Note - 2/24/2011 5:07:21 PM
G - Testing support this week near its 50 DMA line and prior resistance in the $74 area previously noted as defining initial chart support. Reversed from its high with its gap down on 2/15/11 for a damaging loss with heavy volume following 8 consecutive gains into new high territory.
>>> The latest Featured Stock Update with an annotated graph appeared on 2/24/2011. Click here.
View all notes |
Alert me of new notes |
CANSLIM.net Company Profile |
SEC |
Zacks Reports |
StockTalk |
News |
Chart |
Request a new note
C
A N
S L
I M
|
GSIT
-
NASDAQ
G S I Technology Inc
ELECTRONICS - Semiconductor - Broad Line
|
$9.29
|
+0.35
3.91% |
$9.33
|
141,320
57.80% of 50 DAV
50 DAV is 244,500
|
$10.20
-8.92%
|
2/18/2011
|
$10.08
|
PP = $10.25
|
|
MB = $10.76
|
Most Recent Note - 2/24/2011 5:09:48 PM
G - Gain today on lighter volume halted its slide at its 50 DMA line. Gapped down on 2/22/11 amid widespread market weakness and its color code was changed to green after erasing the prior session's gain. Closed the 2/18/11 session in the middle of its intra-day range with a gain backed by more than 4 times average volume, and disciplined investors should note that it did not trigger a proper technical buy signal. See the latest FSU analysis for details and an annotated graph.
>>> The latest Featured Stock Update with an annotated graph appeared on 2/18/2011. Click here.
View all notes |
Alert me of new notes |
CANSLIM.net Company Profile |
SEC |
Zacks Reports |
StockTalk |
News |
Chart |
Request a new note
C
A N
S L
I M
|
HMSY
-
NASDAQ
H M S Holdings Corp
COMPUTER SOFTWARE and SERVICES - Healthcare Information Service
|
$73.60
|
+0.21
0.29% |
$74.18
|
200,912
127.89% of 50 DAV
50 DAV is 157,100
|
$77.43
-4.95%
|
11/19/2010
|
$61.89
|
PP = $63.01
|
|
MB = $66.16
|
Most Recent Note - 2/23/2011 12:16:05 PM
G - Gapped down today, pulling back from its 52-week high hit on the prior session. After 15 consecutive gains with ever-increasing volume it is extended from any sound base pattern. Support to watch is defined by prior chart highs and its 50 DMA line.
>>> The latest Featured Stock Update with an annotated graph appeared on 2/16/2011. Click here.
View all notes |
Alert me of new notes |
CANSLIM.net Company Profile |
SEC |
Zacks Reports |
StockTalk |
News |
Chart |
Request a new note
C
A N
S L
I M
|
Symbol/Exchange
Company Name
Industry Group |
PRICE |
CHANGE
(%Change) |
Day High |
Volume
(% DAV)
(% 50 day avg vol) |
52 Wk Hi
% From Hi |
Featured
Date |
Price
Featured |
Pivot Featured |
|
Max Buy |
JOBS
-
NASDAQ
Fifty One Job Inc Ads
DIVERSIFIED SERVICES - Staffing and; Outsourcing Service
|
$56.41
|
+0.37
0.66% |
$57.54
|
219,923
166.10% of 50 DAV
50 DAV is 132,400
|
$61.99
-9.00%
|
2/7/2011
|
$59.23
|
PP = $61.38
|
|
MB = $64.45
|
Most Recent Note - 2/24/2011 6:16:00 PM
G - Halted its slide today with a gain on heavier above average volume, finding support at its 50 DMA line. Now -9.0% off its all-time high reached last week when gains lacked the volume conviction to produce a powerful breakout, its color code was changed to green. Its recent low ($52.58 on 1/28/11) defines another important support level where a violation would raise serious concerns and a trigger technical sell signal.
>>> The latest Featured Stock Update with an annotated graph appeared on 2/7/2011. Click here.
View all notes |
Alert me of new notes |
CANSLIM.net Company Profile |
SEC |
Zacks Reports |
StockTalk |
News |
Chart |
Request a new note
C
A N
S L
I M
|
LULU
-
NASDAQ
Lululemon Athletica
MANUFACTURING - Textile Manufacturing
|
$76.17
|
-1.10
-1.42% |
$76.81
|
2,349,438
111.08% of 50 DAV
50 DAV is 2,115,000
|
$85.28
-10.68%
|
1/26/2011
|
$68.11
|
PP = $74.70
|
|
MB = $78.44
|
Most Recent Note - 2/24/2011 6:19:33 PM
Y - Finished near the session high today with a 5th consecutive loss. Slumping near prior highs defining chart support coinciding closely with its 50 DMA line. Subsequent violations would trigger technical sell signals. Color code was changed to yellow while pulling back below its "max buy" level.
>>> The latest Featured Stock Update with an annotated graph appeared on 1/14/2011. Click here.
View all notes |
Alert me of new notes |
CANSLIM.net Company Profile |
SEC |
Zacks Reports |
StockTalk |
News |
Chart |
Request a new note
C
A N
S L
I M
|
MWIV
-
NASDAQ
M W I Veterinary Supply
HEALTH SERVICES - Medical Instruments and; Supplies
|
$68.22
|
+2.21
3.35% |
$68.34
|
100,893
146.65% of 50 DAV
50 DAV is 68,800
|
$72.27
-5.60%
|
11/4/2010
|
$61.79
|
PP = $59.60
|
|
MB = $62.58
|
Most Recent Note - 2/24/2011 5:52:47 PM
G - Closed near the session high today with a gain backed by above average volume. It has not built a sound new base pattern. Prior highs in the $67 area define initial chart support to watch above its 50 DMA line.
>>> The latest Featured Stock Update with an annotated graph appeared on 2/2/2011. Click here.
View all notes |
Alert me of new notes |
CANSLIM.net Company Profile |
SEC |
Zacks Reports |
StockTalk |
News |
Chart |
Request a new note
C
A N
S L
I M
|
NFLX
-
NASDAQ
Netflix Inc
SPECIALTY RETAIL - Music and Video Stores
|
$215.18
|
+3.98
1.88% |
$216.39
|
4,519,124
83.03% of 50 DAV
50 DAV is 5,442,500
|
$247.55
-13.08%
|
1/10/2011
|
$187.88
|
PP = $209.34
|
|
MB = $219.81
|
Most Recent Note - 2/23/2011 2:47:50 PM
G - Gapped down for a second consecutive session, its damaging loss extends it losing streak to 6 consecutive trading days. It is -14.3% off its high and enduring distributional pressure amid widespread market weakness, now testing prior resistance near its old high ($209) previously noted as defining support to watch above its 50 DMA line.
>>> The latest Featured Stock Update with an annotated graph appeared on 2/23/2011. Click here.
View all notes |
Alert me of new notes |
CANSLIM.net Company Profile |
SEC |
Zacks Reports |
StockTalk |
News |
Chart |
Request a new note
C
A N
S L
I M
|
NTAP
-
NASDAQ
Netapp Inc
COMPUTER HARDWARE - Data Storage Devices
|
$50.84
|
+0.20
0.39% |
$51.04
|
9,862,858
191.93% of 50 DAV
50 DAV is 5,138,900
|
$61.02
-16.68%
|
1/6/2011
|
$57.49
|
PP = $58.06
|
|
MB = $60.96
|
Most Recent Note - 2/23/2011 5:22:24 PM
Down today for a 4th consecutive loss with above average volume, finishing -17% off its 52-week high. Damaging losses were recently noted as it triggered technical sell signals and it will be dropped from the Featured Stocks list tonight. An earlier low (on 11/1710) and its 200 DMA line define the next chart support levels to watch.
>>> The latest Featured Stock Update with an annotated graph appeared on 2/4/2011. Click here.
View all notes |
Alert me of new notes |
CANSLIM.net Company Profile |
SEC |
Zacks Reports |
StockTalk |
News |
Chart |
Request a new note
C
A N
S L
I M
|
Symbol/Exchange
Company Name
Industry Group |
PRICE |
CHANGE
(%Change) |
Day High |
Volume
(% DAV)
(% 50 day avg vol) |
52 Wk Hi
% From Hi |
Featured
Date |
Price
Featured |
Pivot Featured |
|
Max Buy |
OPEN
-
NASDAQ
Opentable Inc
INTERNET - Internet Software and Services
|
$88.72
|
+4.61
5.48% |
$88.77
|
1,296,925
135.86% of 50 DAV
50 DAV is 954,600
|
$95.97
-7.55%
|
1/5/2011
|
$74.05
|
PP = $76.79
|
|
MB = $80.63
|
Most Recent Note - 2/24/2011 5:55:42 PM
G - Posted a gain today with above average volume and finished near the session high, breaking a streak of 4 consecutive losses. Prior highs near $82 define support to watch above its 50 DMA line.
>>> The latest Featured Stock Update with an annotated graph appeared on 2/15/2011. Click here.
View all notes |
Alert me of new notes |
CANSLIM.net Company Profile |
SEC |
Zacks Reports |
StockTalk |
News |
Chart |
Request a new note
C
A N
S L
I M
|
ORCL
-
NASDAQ
Oracle Corp
COMPUTER SOFTWARE and SERVICES - Application Software
|
$32.25
|
+0.07
0.22% |
$32.41
|
23,416,224
89.68% of 50 DAV
50 DAV is 26,111,400
|
$33.71
-4.33%
|
1/20/2011
|
$32.31
|
PP = $32.37
|
|
MB = $33.99
|
Most Recent Note - 2/24/2011 6:10:13 PM
Y - Traded below its 50 DMA line today following a small gap down, then rebounded to close the session above it for a positive reversal. Recently slumped below its pivot point from last week's new 52-week high.
>>> The latest Featured Stock Update with an annotated graph appeared on 2/22/2011. Click here.
View all notes |
Alert me of new notes |
CANSLIM.net Company Profile |
SEC |
Zacks Reports |
StockTalk |
News |
Chart |
Request a new note
C
A N
S L
I M
|
PAY
-
NYSE
Verifone Systems Inc
COMPUTER HARDWARE - Transaction Automation Systems
|
$45.13
|
+1.09
2.48% |
$45.29
|
1,660,319
112.02% of 50 DAV
50 DAV is 1,482,100
|
$49.91
-9.58%
|
1/27/2011
|
$41.77
|
PP = $44.97
|
|
MB = $47.22
|
Most Recent Note - 2/23/2011 4:42:53 PM
Y - Down again today with above average volume for 3rd consecutive loss, slumping below its pivot point and raising concerns while closing below its old high close ($44.26 on 1/13/11) completely negating the 2/14/11 technical buy signal. Support to watch is its 50 DMA line.
>>> The latest Featured Stock Update with an annotated graph appeared on 1/27/2011. Click here.
View all notes |
Alert me of new notes |
CANSLIM.net Company Profile |
SEC |
Zacks Reports |
StockTalk |
News |
Chart |
Request a new note
C
A N
S L
I M
|
PCLN
-
NASDAQ
Priceline.Com Inc
INTERNET - Internet Software and Services
|
$462.34
|
+36.35
8.53% |
$469.40
|
4,461,969
470.82% of 50 DAV
50 DAV is 947,700
|
$464.47
-0.46%
|
1/3/2011
|
$399.55
|
PP = $428.20
|
|
MB = $449.61
|
Most Recent Note - 2/24/2011 12:52:13 PM
Y - Gapped up today for a considerable gain with heavy volume, reclaiming recently lost ground and touching a new 52-week high after reporting earnings +71% on +35% sales revenues for the quarter ended December 31, 2010 versus the year ago period. Prompt support near its 50 DMA line and its gap up are indicative of institutional accumulation in the face of widespread market weakness. More serious concerns and technical sell signals would be triggered by subsequent damaging losses below today's low ($116.00) coinciding with its 1/20/11 chart low.
>>> The latest Featured Stock Update with an annotated graph appeared on 2/14/2011. Click here.
View all notes |
Alert me of new notes |
CANSLIM.net Company Profile |
SEC |
Zacks Reports |
StockTalk |
News |
Chart |
Request a new note
C
A N
S L
I M
|
RAX
-
NYSE
Rackspace Hosting Inc
INTERNET - Internet Software and; Services
|
$36.61
|
+0.74
2.06% |
$36.74
|
1,385,390
73.84% of 50 DAV
50 DAV is 1,876,200
|
$40.62
-9.87%
|
1/10/2011
|
$22.84
|
PP = $32.76
|
|
MB = $34.40
|
Most Recent Note - 2/23/2011 5:00:27 PM
G - Down today with above average volume, finishing -11.7% off its all-time high. Amid widespread market weakness it has slumped back to prior highs near $35 previously noted as defining support to watch above its 50 DMA line.
>>> The latest Featured Stock Update with an annotated graph appeared on 2/9/2011. Click here.
View all notes |
Alert me of new notes |
CANSLIM.net Company Profile |
SEC |
Zacks Reports |
StockTalk |
News |
Chart |
Request a new note
C
A N
S L
I M
|
Symbol/Exchange
Company Name
Industry Group |
PRICE |
CHANGE
(%Change) |
Day High |
Volume
(% DAV)
(% 50 day avg vol) |
52 Wk Hi
% From Hi |
Featured
Date |
Price
Featured |
Pivot Featured |
|
Max Buy |
TIBX
-
NASDAQ
Tibco Software Inc
COMPUTER SOFTWARE and SERVICES - Business Software and Services
|
$24.01
|
+0.72
3.09% |
$24.58
|
4,214,751
153.87% of 50 DAV
50 DAV is 2,739,100
|
$25.94
-7.44%
|
2/1/2011
|
$24.35
|
PP = $22.18
|
|
MB = $23.29
|
Most Recent Note - 2/24/2011 6:13:29 PM
G - Up today with above average volume heavier than the 2 prior losing sessions. Consolidating above prior highs in the $22 area defining support along with its 50 DMA line.
>>> The latest Featured Stock Update with an annotated graph appeared on 2/10/2011. Click here.
View all notes |
Alert me of new notes |
CANSLIM.net Company Profile |
SEC |
Zacks Reports |
StockTalk |
News |
Chart |
Request a new note
C
A N
S L
I M
|
UA
-
NYSE
Under Armour Inc Cl A
CONSUMER NON-DURABLES - Textile - Apparel Clothing
|
$64.56
|
+0.31
0.48% |
$65.27
|
641,342
81.67% of 50 DAV
50 DAV is 785,300
|
$70.43
-8.33%
|
1/27/2011
|
$58.31
|
PP = $56.99
|
|
MB = $59.84
|
Most Recent Note - 2/23/2011 2:27:17 PM
G - Down today without great volume conviction, slumping -8.1% off its 52-week high now. Following a recent spurt of gains with above average volume, prior resistance in the $60 area defines initial support to watch above its 50 DMA line.
>>> The latest Featured Stock Update with an annotated graph appeared on 2/1/2011. Click here.
View all notes |
Alert me of new notes |
CANSLIM.net Company Profile |
SEC |
Zacks Reports |
StockTalk |
News |
Chart |
Request a new note
C
A N
S L
I M
|
ULTA
-
NASDAQ
Ulta Salon Cosm & Frag
SPECIALTY RETAIL - Specialty Retail, Other
|
$41.18
|
+0.15
0.37% |
$42.58
|
542,363
101.04% of 50 DAV
50 DAV is 536,800
|
$44.06
-6.54%
|
1/6/2011
|
$36.12
|
PP = $37.34
|
|
MB = $39.21
|
Most Recent Note - 2/23/2011 2:29:16 PM
G - Pulling back from all-time highs without great volume conviction today. It has repeatedly been noted - "Extended from a sound base pattern, and prior highs in the $37-38 area define chart support to watch above its 50 DMA line."
>>> The latest Featured Stock Update with an annotated graph appeared on 2/17/2011. Click here.
View all notes |
Alert me of new notes |
CANSLIM.net Company Profile |
SEC |
Zacks Reports |
StockTalk |
News |
Chart |
Request a new note
C
A N
S L
I M
|