***Last / Change / Volume data in this table is the closing quote data***
Symbol/Exchange
Company Name
Industry Group |
PRICE |
CHANGE
(%Change) |
Day High |
Volume
(% DAV)
(% 50 day avg vol) |
52 Wk Hi
% From Hi |
Featured
Date |
Price
Featured |
Pivot Featured |
|
Max Buy |
ADS
-
NYSE
Alliance Data Sys Corp
COMPUTER SOFTWARE and SERVICES - Information and Delivery Service
|
$121.63
|
+1.40
1.16% |
$121.72
|
787,622
112.09% of 50 DAV
50 DAV is 702,700
|
$122.62
-0.81%
|
1/17/2012
|
$108.24
|
PP = $107.43
|
|
MB = $112.80
|
Most Recent Note - 2/16/2012 11:18:48 AM
G - Pulling back today after a streak of 6 consecutive gains into new high territory. Its 50 DMA line defines support to watch on pullbacks while it is now extended from its latest base.
>>> The latest Featured Stock Update with an annotated graph appeared on 1/17/2012. Click here.
View all notes |
Alert me of new notes |
CANSLIM.net Company Profile |
SEC |
Zacks Reports |
StockTalk |
News |
Chart |
Request a new note
C
A N
S L
I M


|
ALXN
-
NASDAQ
Alexion Pharmaceuticals
DRUGS - Drug Manufacturers - Other
|
$85.91
|
+2.45
2.94% |
$87.63
|
1,810,438
147.61% of 50 DAV
50 DAV is 1,226,500
|
$85.48
0.50%
|
11/30/2011
|
$68.66
|
PP = $70.52
|
|
MB = $74.05
|
Most Recent Note - 2/22/2012 4:14:45 PM
G - Up today with above average volume. After volume-driven gains for new all-time highs it is extended from its prior base. Support to watch is its 50 DMA line.
>>> The latest Featured Stock Update with an annotated graph appeared on 1/13/2012. Click here.
View all notes |
Alert me of new notes |
CANSLIM.net Company Profile |
SEC |
Zacks Reports |
StockTalk |
News |
Chart |
Request a new note
C
A N
S L
I M
|
BODY
-
NASDAQ
Body Central Corp
RETAIL - Catalog andamp; Mail Order Houses
|
$28.30
|
+0.18
0.64% |
$28.48
|
121,804
71.48% of 50 DAV
50 DAV is 170,400
|
$28.93
-2.18%
|
1/27/2012
|
$26.69
|
PP = $25.46
|
|
MB = $26.73
|
Most Recent Note - 2/22/2012 4:19:14 PM
G - Up today with light volume, extended from its prior base. Prior highs in the $25-26 area recently acted as support after encountering some distributional pressure.
>>> The latest Featured Stock Update with an annotated graph appeared on 1/27/2012. Click here.
View all notes |
Alert me of new notes |
CANSLIM.net Company Profile |
SEC |
Zacks Reports |
StockTalk |
News |
Chart |
Request a new note
C
A N
S L
I M
|
CATM
-
NASDAQ
Cardtronics Inc
DIVERSIFIED SERVICES - Business/Management Services
|
$27.81
|
+0.61
2.24% |
$27.85
|
360,555
87.92% of 50 DAV
50 DAV is 410,100
|
$28.74
-3.24%
|
12/23/2011
|
$28.64
|
PP = $28.56
|
|
MB = $29.99
|
Most Recent Note - 2/21/2012 1:48:29 PM
G - Still consolidating near its 50 DMA line since finding prompt support at its 200 DMA line. Its waning Relative Strength Rank (81) has slumped near the minimum 80+ guideline for buy candidates.
>>> The latest Featured Stock Update with an annotated graph appeared on 1/30/2012. Click here.
View all notes |
Alert me of new notes |
CANSLIM.net Company Profile |
SEC |
Zacks Reports |
StockTalk |
News |
Chart |
Request a new note
C
A N
S L
I M
|
CDNS
-
NASDAQ
Cadence Design Systems
COMPUTER SOFTWARE and SERVICES - Technical and System Software
|
$11.90
|
+0.10
0.85% |
$11.96
|
2,925,098
97.26% of 50 DAV
50 DAV is 3,007,600
|
$12.11
-1.73%
|
2/3/2012
|
$11.66
|
PP = $11.15
|
|
MB = $11.71
|
Most Recent Note - 2/21/2012 1:50:48 PM
G - Wedging to new 52-week highs with small gains above its "max buy" level. Recently making limited progress while no resistance remains due to overhead supply following strong technical action.
>>> The latest Featured Stock Update with an annotated graph appeared on 2/3/2012. Click here.
View all notes |
Alert me of new notes |
CANSLIM.net Company Profile |
SEC |
Zacks Reports |
StockTalk |
News |
Chart |
Request a new note
C
A N
S L
I M
|
Symbol/Exchange
Company Name
Industry Group |
PRICE |
CHANGE
(%Change) |
Day High |
Volume
(% DAV)
(% 50 day avg vol) |
52 Wk Hi
% From Hi |
Featured
Date |
Price
Featured |
Pivot Featured |
|
Max Buy |
CELG
-
NASDAQ
Celgene Corp
DRUGS - Drug Manufacturers - Major
|
$74.91
|
+0.27
0.36% |
$75.25
|
2,221,063
65.53% of 50 DAV
50 DAV is 3,389,200
|
$76.09
-1.55%
|
2/2/2012
|
$74.16
|
PP = $75.21
|
|
MB = $78.97
|
Most Recent Note - 2/21/2012 1:52:48 PM
Y - Stalled and slumped below the pivot point after recently rising from an advanced "3-weeks tight" base pattern previously noted. Still perched within close striking distance of its all-time high ($77.39 in Aug '08). Its 50 DMA line defines initial support above its prior highs in the $68 area.
>>> The latest Featured Stock Update with an annotated graph appeared on 2/2/2012. Click here.
View all notes |
Alert me of new notes |
CANSLIM.net Company Profile |
SEC |
Zacks Reports |
StockTalk |
News |
Chart |
Request a new note
C
A N
S L
I M
|
ECHO
-
NASDAQ
Echo Global Logistics
DIVERSIFIED SERVICES - Business/Management Services
|
$18.78
|
+0.28
1.51% |
$18.94
|
77,945
124.71% of 50 DAV
50 DAV is 62,500
|
$19.38
-3.10%
|
2/22/2012
|
$18.50
|
PP = $18.63
|
|
MB = $19.56
|
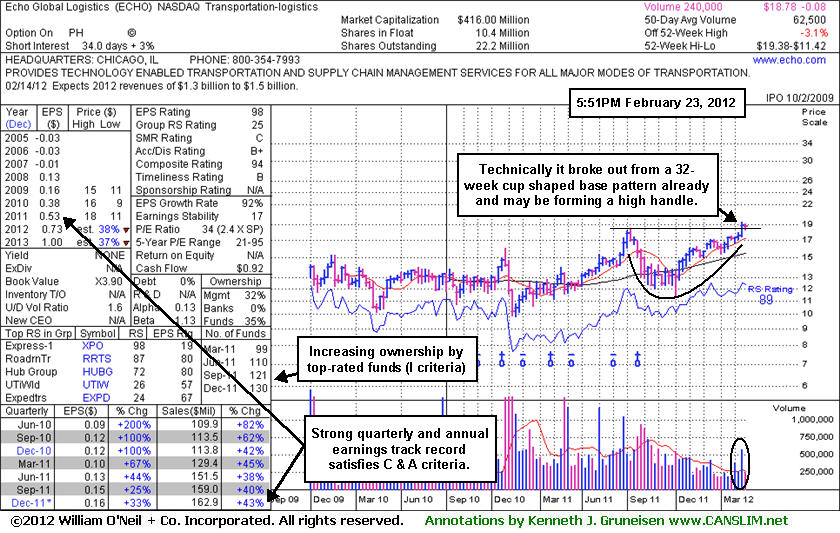
 Most Recent Note - 2/23/2012 6:29:23 PM
Y - Up today after holding its ground near its all-time high following volume-driven gains last week into new high territory. Technically it broke out from a 32-week cup shaped base pattern already and may be forming a high handle. See the latest FSU analysis for more details and a new annotated graph.
>>> The latest Featured Stock Update with an annotated graph appeared on 2/23/2012. Click here.
View all notes |
Alert me of new notes |
CANSLIM.net Company Profile |
SEC |
Zacks Reports |
StockTalk |
News |
Chart |
Request a new note
C
A N
S L
I M
|
FEIC
-
NASDAQ
F E I Co
ELECTRONICS - Diversified Electronics
|
$44.68
|
+0.44
0.99% |
$44.90
|
235,027
84.42% of 50 DAV
50 DAV is 278,400
|
$48.31
-7.51%
|
12/7/2011
|
$41.41
|
PP = $42.35
|
|
MB = $44.47
|
Most Recent Note - 2/16/2012 5:30:14 PM
G - Consolidating above its 50 DMA line and prior highs in the $43 area defining important chart support. Reported earnings +21% on +14% sales revenues for the latest quarter ended December 31, 2011 versus the year ago period (below the +25% minimum guideline for earnings growth).
>>> The latest Featured Stock Update with an annotated graph appeared on 1/25/2012. Click here.
View all notes |
Alert me of new notes |
CANSLIM.net Company Profile |
SEC |
Zacks Reports |
StockTalk |
News |
Chart |
Request a new note
C
A N
S L
I M
|
GNC
-
NYSE
G N C Holdings Inc
RETAIL - Drug Stores
|
$33.12
|
+0.57
1.75% |
$33.62
|
1,065,165
99.23% of 50 DAV
50 DAV is 1,073,400
|
$33.70
-1.72%
|
1/19/2012
|
$28.99
|
PP = $29.60
|
|
MB = $31.08
|
Most Recent Note - 2/21/2012 1:36:13 PM
G - Reported earnings +106% on +17% sales revenues for the quarter ended Dec 31, 2011 versus the year ago period. Color code was changed to green after trading up above it "max buy" level. Prior highs in the $29.50 area define initial support to watch on pullbacks.
>>> The latest Featured Stock Update with an annotated graph appeared on 1/19/2012. Click here.
View all notes |
Alert me of new notes |
CANSLIM.net Company Profile |
SEC |
Zacks Reports |
StockTalk |
News |
Chart |
Request a new note
C
A N
S L
I M
|
GOLD
-
NASDAQ
Randgold Resources Adr
METALS and MINING - Gold
|
$116.88
|
+2.14
1.87% |
$117.78
|
578,496
113.63% of 50 DAV
50 DAV is 509,100
|
$120.73
-3.19%
|
2/7/2012
|
$116.21
|
PP = $120.83
|
|
MB = $126.87
|
Most Recent Note - 2/21/2012 1:55:28 PM
Y - Found support at its 50 DMA line as it formed a downward sloping "handle" with losses on light volume following the previously noted base pattern. Subsequent volume-driven gains into new high territory may trigger a technical buy signal.
>>> The latest Featured Stock Update with an annotated graph appeared on 2/8/2012. Click here.
View all notes |
Alert me of new notes |
CANSLIM.net Company Profile |
SEC |
Zacks Reports |
StockTalk |
News |
Chart |
Request a new note
C
A N
S L
I M
|
Symbol/Exchange
Company Name
Industry Group |
PRICE |
CHANGE
(%Change) |
Day High |
Volume
(% DAV)
(% 50 day avg vol) |
52 Wk Hi
% From Hi |
Featured
Date |
Price
Featured |
Pivot Featured |
|
Max Buy |
HLF
-
NYSE
Herbalife Ltd
DRUGS - Nutrition and Weight Management
|
$66.57
|
-0.24
-0.36% |
$67.30
|
1,793,206
147.33% of 50 DAV
50 DAV is 1,217,100
|
$67.40
-1.23%
|
2/22/2012
|
$65.90
|
PP = $63.50
|
|
MB = $66.68
|
Most Recent Note - 2/22/2012 7:45:08 PM
Y - Gapped up today and triggered a technical buy signal with a considerable volume-driven gain for a new 52-week high (N criteria). Reported earnings +25% on +20% sales revenues for the quarter ended December 31, 2011 versus the year ago period. Ownership by top-rated funds rose from 560 in Jun '11 to 627 in Dec '11, a reassuring trend concerning institutional interest (I criteria). See the latest FSU analysis for more details and a new annotated graph.
>>> The latest Featured Stock Update with an annotated graph appeared on 2/22/2012. Click here.
View all notes |
Alert me of new notes |
CANSLIM.net Company Profile |
SEC |
Zacks Reports |
StockTalk |
News |
Chart |
Request a new note
C
A N
S L
I M
|
HMSY
-
NASDAQ
H M S Holdings Corp
COMPUTER SOFTWARE and SERVICES - Healthcare Information Service
|
$33.30
|
+0.49
1.49% |
$33.49
|
490,974
52.36% of 50 DAV
50 DAV is 937,600
|
$34.98
-4.80%
|
10/27/2011
|
$26.44
|
PP = $28.37
|
|
MB = $29.79
|
Most Recent Note - 2/21/2012 1:56:58 PM
G - Reported earnings +29% on +14% sales revenues for the quarter ended Dec 31,2011 versus the year ago period. Down today, and further deterioration below its 50 DMA line would raise more serious concerns.
>>> The latest Featured Stock Update with an annotated graph appeared on 2/9/2012. Click here.
View all notes |
Alert me of new notes |
CANSLIM.net Company Profile |
SEC |
Zacks Reports |
StockTalk |
News |
Chart |
Request a new note
C
A N
S L
I M
|
ISRG
-
NASDAQ
Intuitive Surgical Inc
HEALTH SERVICES - Medical Appliances and Equipment
|
$506.36
|
+2.28
0.45% |
$509.71
|
161,251
43.28% of 50 DAV
50 DAV is 372,600
|
$515.61
-1.79%
|
12/20/2011
|
$442.43
|
PP = $449.16
|
|
MB = $471.62
|
Most Recent Note - 2/21/2012 2:04:36 PM
G - Perched near its all-time high, stubbornly holding its ground extended from prior highs in the $475 area that define support to watch on pullbacks. Reported earnings +24% on +28% sales revenues for the quarter ended December 31, 2011 versus the year ago period.
>>> The latest Featured Stock Update with an annotated graph appeared on 1/18/2012. Click here.
View all notes |
Alert me of new notes |
CANSLIM.net Company Profile |
SEC |
Zacks Reports |
StockTalk |
News |
Chart |
Request a new note
C
A N
S L
I M
|
LULU
-
NASDAQ
Lululemon Athletica
MANUFACTURING - Textile Manufacturing
|
$66.70
|
+1.70
2.62% |
$67.13
|
1,681,842
64.61% of 50 DAV
50 DAV is 2,603,200
|
$67.22
-0.77%
|
1/10/2012
|
$60.97
|
PP = $59.46
|
|
MB = $62.43
|
Most Recent Note - 2/21/2012 7:24:55 PM
G - Hovering near its all-time high, stubbornly holding its ground with cooling volume totals in recent weeks suggesting that very few are exiting. See the latest FSU analysis for more details and a new annotated weekly graph.
>>> The latest Featured Stock Update with an annotated graph appeared on 2/21/2012. Click here.
View all notes |
Alert me of new notes |
CANSLIM.net Company Profile |
SEC |
Zacks Reports |
StockTalk |
News |
Chart |
Request a new note
C
A N
S L
I M
|
MA
-
NYSE
Mastercard Inc Cl A
DIVERSIFIED SERVICES - Business/Management Services
|
$406.10
|
-0.73
-0.18% |
$407.77
|
821,512
75.71% of 50 DAV
50 DAV is 1,085,100
|
$408.54
-0.60%
|
2/2/2012
|
$379.05
|
PP = $381.32
|
|
MB = $400.39
|
Most Recent Note - 2/22/2012 4:18:01 PM
G - Quietly rose to a new all-time high today and rallied beyond its "max buy" level. Color code is changed to green while getting extended from its prior highs. See the latest FSU analysis for more details and a new annotated graph.
>>> The latest Featured Stock Update with an annotated graph appeared on 2/17/2012. Click here.
View all notes |
Alert me of new notes |
CANSLIM.net Company Profile |
SEC |
Zacks Reports |
StockTalk |
News |
Chart |
Request a new note
C
A N
S L
I M
|
Symbol/Exchange
Company Name
Industry Group |
PRICE |
CHANGE
(%Change) |
Day High |
Volume
(% DAV)
(% 50 day avg vol) |
52 Wk Hi
% From Hi |
Featured
Date |
Price
Featured |
Pivot Featured |
|
Max Buy |
MELI
-
NASDAQ
Mercadolibre Inc
INTERNET - Internet Software and; Services
|
$97.00
|
-0.72
-0.74% |
$97.50
|
1,182,072
244.53% of 50 DAV
50 DAV is 483,400
|
$101.84
-4.75%
|
2/6/2012
|
$97.09
|
PP = $95.58
|
|
MB = $100.36
|
Most Recent Note - 2/23/2012 12:33:20 PM
Y - Up from the early session lows today. Consolidating near 52-week and all-time high territory with no resistance remaining due to overhead supply. Its 50 DMA line ($88.23 now) defines near-term chart support to watch.
>>> The latest Featured Stock Update with an annotated graph appeared on 2/6/2012. Click here.
View all notes |
Alert me of new notes |
CANSLIM.net Company Profile |
SEC |
Zacks Reports |
StockTalk |
News |
Chart |
Request a new note
C
A N
S L
I M
|
MKTX
-
NASDAQ
Marketaxess Holdings Inc
FINANCIAL SERVICES - Investment Brokerage - Nationa
|
$33.46
|
+2.93
9.60% |
$34.17
|
2,899,180
1,592.96% of 50 DAV
50 DAV is 182,000
|
$35.42
-5.53%
|
10/28/2011
|
$29.79
|
PP = $31.05
|
|
MB = $32.60
|
Most Recent Note - 2/22/2012 3:48:18 PM
G - Announced a proposed Secondary Offering of 3.6 million shares of common stock by selling stockholders. Gapped down today and traded below its 50 DMA line with a damaging loss on above average volume.
>>> The latest Featured Stock Update with an annotated graph appeared on 1/24/2012. Click here.
View all notes |
Alert me of new notes |
CANSLIM.net Company Profile |
SEC |
Zacks Reports |
StockTalk |
News |
Chart |
Request a new note
C
A N
S L
I M
|
RAX
-
NYSE
Rackspace Hosting Inc
INTERNET - Internet Software and; Services
|
$53.65
|
-0.06
-0.11% |
$54.18
|
1,473,524
74.02% of 50 DAV
50 DAV is 1,990,700
|
$56.94
-5.78%
|
2/2/2012
|
$46.69
|
PP = $45.55
|
|
MB = $47.83
|
Most Recent Note - 2/22/2012 4:08:16 PM
G - Up today with below average volume, still consolidating following a considerable 2/14/12 gap up gain with very heavy volume following strong earnings news. Now it is too extended from the previous base to be considered an ideal buy candidate under the fact-based investment system's guidelines.
>>> The latest Featured Stock Update with an annotated graph appeared on 2/16/2012. Click here.
View all notes |
Alert me of new notes |
CANSLIM.net Company Profile |
SEC |
Zacks Reports |
StockTalk |
News |
Chart |
Request a new note
C
A N
S L
I M
|
RRTS
-
NYSE
Roadrunner Trans Systems
TRANSPORTATION - Air Delivery and Freight Service
|
$18.02
|
+0.33
1.87% |
$18.11
|
308,383
228.94% of 50 DAV
50 DAV is 134,700
|
$18.44
-2.28%
|
2/10/2012
|
$17.40
|
PP = $17.50
|
|
MB = $18.38
|
Most Recent Note - 2/23/2012 6:25:50 PM
Y - Finished near the session high with a gain today with above average volume. Prior highs in the $17 area define initial support to watch on pullbacks.
>>> The latest Featured Stock Update with an annotated graph appeared on 2/13/2012. Click here.
View all notes |
Alert me of new notes |
CANSLIM.net Company Profile |
SEC |
Zacks Reports |
StockTalk |
News |
Chart |
Request a new note
C
A N
S L
I M
|
SWI
-
NYSE
Solarwinds Inc
COMPUTER SOFTWARE and SERVICES - Application Software
|
$39.20
|
+1.51
4.01% |
$39.23
|
912,073
76.57% of 50 DAV
50 DAV is 1,191,100
|
$38.65
1.42%
|
1/26/2012
|
$32.36
|
PP = $33.78
|
|
MB = $35.47
|
Most Recent Note - 2/23/2012 6:27:18 PM
G - Hit another new all-time high today with a gain on light volume, getting more extended from its latest base. Earnings below the +25% guideline for the Dec '11 quarter raised fundamental concerns.
>>> The latest Featured Stock Update with an annotated graph appeared on 1/26/2012. Click here.
View all notes |
Alert me of new notes |
CANSLIM.net Company Profile |
SEC |
Zacks Reports |
StockTalk |
News |
Chart |
Request a new note
C
A N
S L
I M
|
Symbol/Exchange
Company Name
Industry Group |
PRICE |
CHANGE
(%Change) |
Day High |
Volume
(% DAV)
(% 50 day avg vol) |
52 Wk Hi
% From Hi |
Featured
Date |
Price
Featured |
Pivot Featured |
|
Max Buy |
SXCI
-
NASDAQ
S X C Health Solutions
COMPUTER SOFTWARE and SERVICES - Healthcare Information Service
|
$67.36
|
+3.83
6.03% |
$68.74
|
1,110,781
333.57% of 50 DAV
50 DAV is 333,000
|
$66.40
1.45%
|
2/23/2012
|
$68.24
|
PP = $66.05
|
|
MB = $69.35
|
Most Recent Note - 2/23/2012 12:58:18 PM
Y - Color code is changed to yellow with new pivot point based on its 1/19/12 high plus 10 cents. Reported earnings +71% on +162% sales revenues for the quarter ended December 31, 2011 versus the year ago period. Gapped up today for a considerable volume-driven gain, rallying above the new pivot point cited. Recently found support above prior highs in the $60 area and its 50 DMA line.
>>> The latest Featured Stock Update with an annotated graph appeared on 1/20/2012. Click here.
View all notes |
Alert me of new notes |
CANSLIM.net Company Profile |
SEC |
Zacks Reports |
StockTalk |
News |
Chart |
Request a new note
C
A N
S L
I M
|
TDG
-
NYSE
Transdigm Group Inc
AEROSPACE/DEFENSE - Aerospace/Defense Products and; Services
|
$117.07
|
-0.32
-0.27% |
$117.39
|
308,877
89.45% of 50 DAV
50 DAV is 345,300
|
$118.83
-1.48%
|
1/10/2012
|
$98.83
|
PP = $102.83
|
|
MB = $107.97
|
Most Recent Note - 2/21/2012 1:40:29 PM
G - Still hovering near its all-time high, stubbornly holding its ground, extended from its prior base after a spurt of volume-driven gains. Prior highs near $102 define the initial support level to watch above its 50 DMA line.
>>> The latest Featured Stock Update with an annotated graph appeared on 2/10/2012. Click here.
View all notes |
Alert me of new notes |
CANSLIM.net Company Profile |
SEC |
Zacks Reports |
StockTalk |
News |
Chart |
Request a new note
C
A N
S L
I M
|
TNGO
-
NASDAQ
Tangoe Inc
COMPUTER SOFTWARE and SERVICES - Technical and System Software
|
$18.90
|
+0.85
4.71% |
$19.15
|
523,713
181.97% of 50 DAV
50 DAV is 287,800
|
$18.48
2.27%
|
2/13/2012
|
$15.39
|
PP = $16.51
|
|
MB = $17.34
|
Most Recent Note - 2/23/2012 12:59:20 PM
G - Gain today has getting more extended from its prior base. Found support near prior highs in the $16 area during the pullback following its technical breakout last week.
>>> The latest Featured Stock Update with an annotated graph appeared on 2/14/2012. Click here.
View all notes |
Alert me of new notes |
CANSLIM.net Company Profile |
SEC |
Zacks Reports |
StockTalk |
News |
Chart |
Request a new note
C
A N
S L
I M
|
TSCO
-
NASDAQ
Tractor Supply Co
SPECIALTY RETAIL - Specialty Retail, Other
|
$84.87
|
+1.32
1.58% |
$85.14
|
569,129
78.66% of 50 DAV
50 DAV is 723,500
|
$87.13
-2.59%
|
1/12/2012
|
$79.12
|
PP = $75.58
|
|
MB = $79.36
|
Most Recent Note - 2/21/2012 1:41:28 PM
G - Volume totals have still been cooling while stubbornly holding its ground near its all-time high. Reported earnings +43% on +20% sales revenues for the quarter ended December 31, 2011 versus the year ago period. Prior highs in the mid-$70s which were a resistance area now define initial support to watch on pullbacks.
>>> The latest Featured Stock Update with an annotated graph appeared on 1/12/2012. Click here.
View all notes |
Alert me of new notes |
CANSLIM.net Company Profile |
SEC |
Zacks Reports |
StockTalk |
News |
Chart |
Request a new note
C
A N
S L
I M
|
UA
-
NYSE
Under Armour Inc Cl A
CONSUMER NON-DURABLES - Textile - Apparel Clothing
|
$82.40
|
-0.41
-0.50% |
$83.71
|
470,042
37.10% of 50 DAV
50 DAV is 1,267,000
|
$87.40
-5.72%
|
2/15/2012
|
$85.77
|
PP = $84.86
|
|
MB = $89.10
|
Most Recent Note - 2/21/2012 1:43:32 PM
Y - Pulling back today on light volume, perched near its pivot point. Disciplined investors may watch for a gain above the pivot point with sufficient volume to trigger a proper technical buy signal. See the latest FSU analysis for more details and a new annotated graph.
>>> The latest Featured Stock Update with an annotated graph appeared on 2/15/2012. Click here.
View all notes |
Alert me of new notes |
CANSLIM.net Company Profile |
SEC |
Zacks Reports |
StockTalk |
News |
Chart |
Request a new note
C
A N
S L
I M
|
Symbol/Exchange
Company Name
Industry Group |
PRICE |
CHANGE
(%Change) |
Day High |
Volume
(% DAV)
(% 50 day avg vol) |
52 Wk Hi
% From Hi |
Featured
Date |
Price
Featured |
Pivot Featured |
|
Max Buy |
UBNT
-
NASDAQ
Ubiquiti Networks Inc
TELECOMMUNICATIONS - Diversified Communication Serv
|
$26.78
|
+1.43
5.64% |
$27.45
|
740,125
265.28% of 50 DAV
50 DAV is 279,000
|
$27.23
-1.65%
|
1/27/2012
|
$22.25
|
PP = $23.14
|
|
MB = $24.30
|
Most Recent Note - 2/23/2012 6:24:26 PM
G - Considerable volume-driven gain today for a best-ever close. Prior highs in the $23 area acted as support on pullbacks following its recent technical breakout.
>>> The latest Featured Stock Update with an annotated graph appeared on 2/1/2012. Click here.
View all notes |
Alert me of new notes |
CANSLIM.net Company Profile |
SEC |
Zacks Reports |
StockTalk |
News |
Chart |
Request a new note
C
A N
S L
I M
|
ULTA
-
NASDAQ
Ulta Salon Cosm & Frag
SPECIALTY RETAIL - Specialty Retail, Other
|
$83.40
|
+0.83
1.01% |
$84.02
|
502,893
65.22% of 50 DAV
50 DAV is 771,100
|
$84.48
-1.28%
|
1/11/2012
|
$71.97
|
PP = $75.80
|
|
MB = $79.59
|
Most Recent Note - 2/16/2012 11:31:36 AM
G - Inching further into all-time high territory, it is extended from any sound base pattern. Prior highs near $75 define initial chart support above its 50 DMA line.
>>> The latest Featured Stock Update with an annotated graph appeared on 1/11/2012. Click here.
View all notes |
Alert me of new notes |
CANSLIM.net Company Profile |
SEC |
Zacks Reports |
StockTalk |
News |
Chart |
Request a new note
C
A N
S L
I M
|
V
-
NYSE
Visa Inc Cl A
DIVERSIFIED SERVICES - Business/Management Services
|
$116.48
|
+0.12
0.10% |
$116.80
|
2,722,672
66.37% of 50 DAV
50 DAV is 4,102,300
|
$117.18
-0.60%
|
2/2/2012
|
$105.43
|
PP = $104.30
|
|
MB = $109.52
|
Most Recent Note - 2/22/2012 4:12:05 PM
G - Up today with below average volume for a best-ever close. Prior highs in the $103-104 area define initial support to watch on pullbacks.
>>> The latest Featured Stock Update with an annotated graph appeared on 1/23/2012. Click here.
View all notes |
Alert me of new notes |
CANSLIM.net Company Profile |
SEC |
Zacks Reports |
StockTalk |
News |
Chart |
Request a new note
C
A N
S L
I M
|