You are not logged in.
This means you
CAN ONLY VIEW reports that were published prior to Monday, February 26, 2024.
You
MUST UPGRADE YOUR MEMBERSHIP if you want to see any current reports.
AFTER MARKET UPDATE - TUESDAY, FEBRUARY 22ND, 2022
Previous After Market Report Next After Market Report >>>
|
|
|
|
DOW |
-482.57 |
33,596.61 |
-1.42% |
|
Volume |
1,097,348,927 |
-0% |
|
Volume |
4,809,219,000 |
+8% |
|
NASDAQ |
-166.55 |
13,381.52 |
-1.23% |
|
Advancers |
710 |
22% |
|
Advancers |
1,195 |
27% |
|
S&P 500 |
-44.11 |
4,304.76 |
-1.01% |
|
Decliners |
2,491 |
78% |
|
Decliners |
3,215 |
73% |
|
Russell 2000 |
-29.16 |
1,980.17 |
-1.45% |
|
52 Wk Highs |
30 |
|
|
52 Wk Highs |
32 |
|
|
S&P 600 |
-18.77 |
1,279.15 |
-1.45% |
|
52 Wk Lows |
337 |
|
|
52 Wk Lows |
661 |
|
|
The weakening major averages again signaled a market correction (M criteria) after noted pressure on Tuesday led to new low closes for the year for both the S&P 500 Index and the Dow Jones Industrial Average. The fact-based investment system's rules say that new buying efforts should be avoided during market corrections.
|
 |
Major Indices Slump and Signal Worrisome Market Correction
Kenneth J. Gruneisen - Passed the CAN SLIM® Master's Exam
The S&P 500 fell 1%, closing in correction territory (defined as a 10% drawdown from a recent peak). The Dow lost 482 points, having pared a more than 700-point decline from early trading. The Nasdaq Composite shed 1.2%. Volume totals reported were near the prior session total on the NYSE and higher on the Nasdaq exchange, indicative of distributional pressure or greater institutional selling. Breadth was clearly negative as decliners led advancers by more than a 3-1 margin on the NYSE and 8-3 on the Nasdaq exchange. There were 8 high-ranked companies from the Leaders List that hit new 52-week highs and were listed on the BreakOuts Page, versus 10 on the prior session. New 52-week lows totals swelled and solidly outnumbered new 52-week highs on the NYSE and on the Nasdaq exchange. The market averages (M criteria) are weak and have signaled a more worrisome "correction" as the S&P 500 and Dow Jones Industrial Average both closed at new lows for the year.
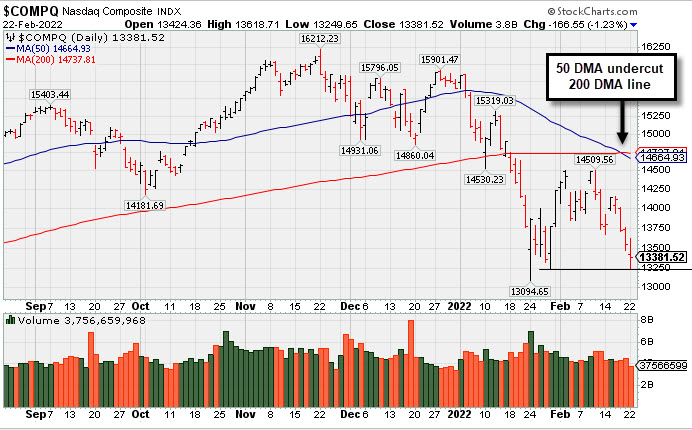
 PICTURED: The Nasdaq Composite Index has been slumping toward its January low while posting 7 losses in the past 8 sessions. Its 50-day moving average (DMA) line undercut its 200 DMA line, a bearish technical sign termed a "death cross".
U.S. stocks finished lower on Tuesday as investors weighed escalating geopolitical tensions in Eastern Europe. President Biden joined U.S. allies in announcing sanctions on Russia after Russian President Putin yesterday recognized two breakaway regions in eastern Ukraine as independent, ordering “peacekeeping forces” into the separatist areas. Treasuries weakened despite the perceived risk-off tone, with the yield on the 10-year note up one basis point (0.01%) to 1.93%. In commodities, West Texas Intermediate crude rose 1.4% to $92.35/barrel, while European natural gas futures surged roughly 11% after Germany postponed the approval of the Nord Stream 2 gas pipeline in reaction to Russia’s actions.
All 11 S&P 500 sectors ended in negative territory, with the more traditionally defensive groups outperforming on a relative basis. Consumer Discretionary led the decline, with Home Depot Inc. (HD -8.85%) gapped down well below its 200 DMA line as projections of decelerating profit growth in 2022 overshadowed a top and bottom line beat.
On the data front, preliminary February readings from research firm IHS Markit showed activity in both the U.S. manufacturing and services sectors expanded at a faster than anticipated pace. Separately, the Conference Board’s consumer confidence gauge deteriorated this month to the lowest level since September. Elsewhere, a measure of home prices in 20 U.S. cities jumped a greater-than-expected 18.6% year-over-year in December. |
 Kenneth J. Gruneisen started out as a licensed stockbroker in August 1987, a couple of months prior to the historic stock market crash that took the Dow Jones Industrial Average down -22.6% in a single day. He has published daily fact-based fundamental and technical analysis on high-ranked stocks online for two decades. Through FACTBASEDINVESTING.COM, Kenneth provides educational articles, news, market commentary, and other information regarding proven investment systems that work in good times and bad.
Comments contained in the body of this report are technical opinions only and are not necessarily those of Gruneisen Growth Corp. The material herein has been obtained from sources believed to be reliable and accurate, however, its accuracy and completeness cannot be guaranteed. Our firm, employees, and customers may effect transactions, including transactions contrary to any recommendation herein, or have positions in the securities mentioned herein or options with respect thereto. Any recommendation contained in this report may not be suitable for all investors and it is not to be deemed an offer or solicitation on our part with respect to the purchase or sale of any securities. |
|
 |
Retail, Financial, Tech, and Commodity-Linked Groups Fell
Kenneth J. Gruneisen - Passed the CAN SLIM® Master's Exam
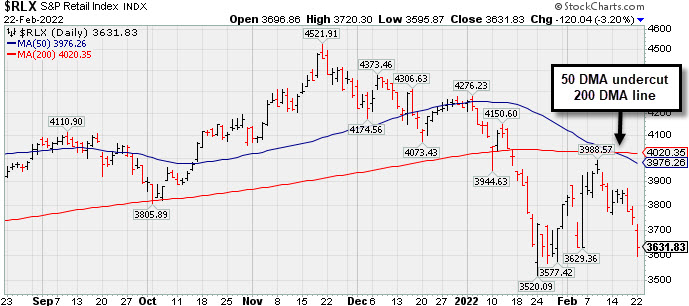
The Retail Index ($RLX -3.20%) suffered a big loss that created a drag on the major averages. The Broker/Dealer Index ($XBD -1.31%) slumped while the Bank Index ($BKX -0.14%) did a better job of holding its ground. The Networking Index ($NWX -1.76%) led the tech sector lower while the Semiconductor Index ($SOX -0.83%) followed and the Biotech Index ($BTK -0.24%) also edged lower. The Gold & Silver Index ($XAU -1.46%), Integrated Oil Index ($XOI -1.15%), and Oil Services Index ($OSX -0.81%) suffered unanimous losses. PICTURED: The Retail Index ($RLX -3.20%) has been slumping near its January low while its 50-day moving average (DMA) has undercut its 200 DMA line.
| Oil Services |
$OSX |
66.25 |
-0.54 |
-0.81% |
+25.67% |
| Integrated Oil |
$XOI |
1,409.92 |
-16.40 |
-1.15% |
+19.67% |
| Semiconductor |
$SOX |
3,356.07 |
-28.23 |
-0.83% |
-14.95% |
| Networking |
$NWX |
852.92 |
-15.31 |
-1.76% |
-12.17% |
| Broker/Dealer |
$XBD |
483.73 |
-6.40 |
-1.31% |
-0.64% |
| Retail |
$RLX |
3,631.83 |
-120.04 |
-3.20% |
-14.07% |
| Gold & Silver |
$XAU |
140.01 |
-2.07 |
-1.46% |
+5.71% |
| Bank |
$BKX |
137.00 |
-0.19 |
-0.14% |
+3.62% |
| Biotech |
$BTK |
4,924.89 |
-11.68 |
-0.24% |
-10.76% |
|
|
|
 |
Featured Stocks
Kenneth J. Gruneisen - Passed the CAN SLIM® Master's Exam
|
|
|
Color Codes Explained :
Y - Better candidates highlighted by our
staff of experts.
G - Previously featured
in past reports as yellow but may no longer be buyable under the
guidelines.
***Last / Change / Volume data in this table is the closing quote data***
|
|
|
THESE ARE NOT BUY RECOMMENDATIONS!
Comments contained in the body of this report are technical
opinions only. The material herein has been obtained
from sources believed to be reliable and accurate, however,
its accuracy and completeness cannot be guaranteed.
This site is not an investment advisor, hence it does
not endorse or recommend any securities or other investments.
Any recommendation contained in this report may not
be suitable for all investors and it is not to be deemed
an offer or solicitation on our part with respect to
the purchase or sale of any securities. All trademarks,
service marks and trade names appearing in this report
are the property of their respective owners, and are
likewise used for identification purposes only.
This report is a service available
only to active Paid Premium Members.
You may opt-out of receiving report notifications
at any time. Questions or comments may be submitted
by writing to Premium Membership Services 665 S.E. 10 Street, Suite 201 Deerfield Beach, FL 33441-5634 or by calling 1-800-965-8307
or 954-785-1121.
|
|
|