You are not logged in.
This means you
CAN ONLY VIEW reports that were published prior to Monday, April 14, 2025.
You
MUST UPGRADE YOUR MEMBERSHIP if you want to see any current reports.
AFTER MARKET UPDATE - FRIDAY, FEBRUARY 21ST, 2014
Previous After Market Report Next After Market Report >>>
|
|
|
|
DOW |
-29.93 |
16,103.30 |
-0.19% |
|
Volume |
796,073,130 |
+21% |
|
Volume |
1,999,081,440 |
+9% |
|
NASDAQ |
-4.14 |
4,263.41 |
-0.10% |
|
Advancers |
1,723 |
55% |
|
Advancers |
1,357 |
50% |
|
S&P 500 |
-3.53 |
1,836.25 |
-0.19% |
|
Decliners |
1,303 |
41% |
|
Decliners |
1,243 |
46% |
|
Russell 2000 |
+2.52 |
1,164.63 |
+0.22% |
|
52 Wk Highs |
179 |
|
|
52 Wk Highs |
204 |
|
|
S&P 600 |
-0.07 |
655.18 |
-0.01% |
|
52 Wk Lows |
11 |
|
|
52 Wk Lows |
17 |
|
|
 |
Major Averges Erased Gains to Close Session Lower
Kenneth J. Gruneisen - Passed the CAN SLIM® Master's Exam
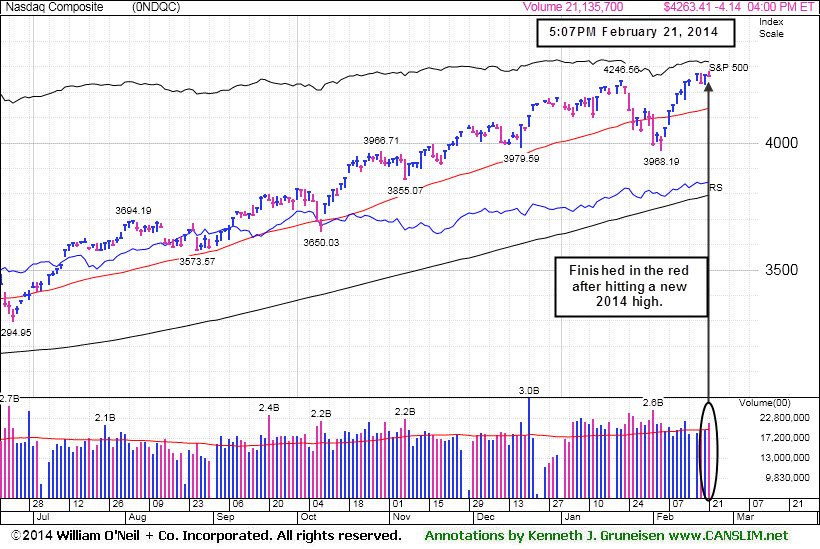
For the week, the Dow was down -0.3%, the S&P 500 fell less than -0.1% and the NASDAQ advanced more than +0.4%. The indices tallied small losses on Friday while the volume totals were reported higher than the prior trading session's volume totals on the Nasdaq exchange and on the NYSE, a sign of distributional pressure. Breadth was positive as advancers led decliners by a 4-3 ratio on the NYSE while the mix was near even on the Nasdaq exchange. There were 75 high-ranked companies from the CANSLIM.net Leaders List that made new 52-week highs and appeared on the CANSLIM.net BreakOuts Page, up from the total of 61 stocks on the prior session. The list of stocks hitting new 52-week highs expanded and easily outnumbered new 52-week lows on the Nasdaq exchange and on the NYSE. There were gains for 5 of the 10 high-ranked companies currently included on the Featured Stocks Page. The Market (M criteria) environment has been noted as a "Confirmed Uptrend". For any rally to be sustained it is critical for there to be healthy leadership, so it remains crucial for many stocks to continue hitting new 52-week highs.
Stocks traded in a narrow range throughout Friday's session and ended lower as investors digested a batch of mixed corporate profit tallies. Existing home sales data for January was weaker-than-anticipated, but was largely overlooked as severe winter weather tempered expectations.
On the earnings front, Hewlett-Packard (HPQ -1.32%) despite posting results that were ahead of analysts’ estimates. Also in the space, shares of Intuit (INTU +4.59%) following their better-than-expected results. Turning to fixed income markets, Treasuries were higher along the curve. The benchmark 10-year note was up 3/16 of a point to yield 2.73% and the 30-year bond was higher by over 1/2 of a point to yield 3.69%.
The CANSLIM.net Featured Stocks Page shows the most action-worthy candidates and their latest notes and a Headline Link directs members to the latest detailed analysis with data-packed graphs annotated by a Certified expert along with links to additional resources. The Premium Member Homepage includes "dynamic archives" to all prior pay reports published. Watch for an announcement via email concerning the next WEBCAST.
PICTURED: The Nasdaq Composite Index finished in the red on Friday with a small loss on higher volume after hitting a new 2014 high.
|
 Kenneth J. Gruneisen started out as a licensed stockbroker in August 1987, a couple of months prior to the historic stock market crash that took the Dow Jones Industrial Average down -22.6% in a single day. He has published daily fact-based fundamental and technical analysis on high-ranked stocks online for two decades. Through FACTBASEDINVESTING.COM, Kenneth provides educational articles, news, market commentary, and other information regarding proven investment systems that work in good times and bad.
Comments contained in the body of this report are technical opinions only and are not necessarily those of Gruneisen Growth Corp. The material herein has been obtained from sources believed to be reliable and accurate, however, its accuracy and completeness cannot be guaranteed. Our firm, employees, and customers may effect transactions, including transactions contrary to any recommendation herein, or have positions in the securities mentioned herein or options with respect thereto. Any recommendation contained in this report may not be suitable for all investors and it is not to be deemed an offer or solicitation on our part with respect to the purchase or sale of any securities. |
|
 |
Retail, Financial, and Biotech Indexes Rose
Kenneth J. Gruneisen - Passed the CAN SLIM® Master's Exam
The Retail Index ($RLX +0.20%) edged higher and financial shares were a positive influence on the major averages as the Broker/Dealer Index ($XBD +0.18%) and the Bank Index ($BKX +0.35%) posted small gains. The Biotechnology Index ($BTK +1.36%) posted a solid gain while the Networking Index ($NWX -0.61%) and the Semiconductor Index ($SOX -0.51%) edged lower. Commodity-linked groups had a negative bias as the Oil Services Index ($OSX -1.07%) outpaced the Integrated Oil Index ($XOI -0.30%) and the Gold & Silver Index ($XAU -0.48%) to the downside.
Charts courtesy www.stockcharts.com
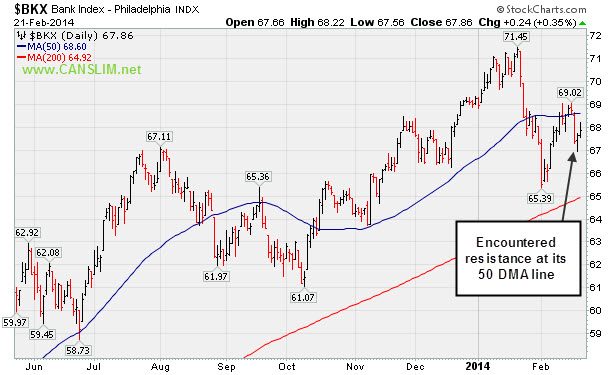
PICTURED: The Bank Index ($BKX +0.35%) recently encountered resistance at its 50-day moving average (DMA) line.
Charts courtesy www.stockcharts.com
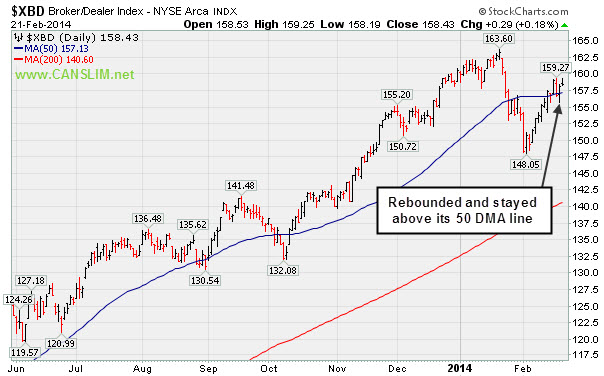
PICTURED 2: The Broker/Dealer Index ($XBD +0.18%) is consolidating above its 50-day moving average (DMA) line. Its rebound above that important short-term average helped its technical stance and also bodes well as a "leading indicator" for the broader market.
| Oil Services |
$OSX |
272.98 |
-2.95 |
-1.07% |
-2.86% |
| Integrated Oil |
$XOI |
1,461.50 |
-4.43 |
-0.30% |
-2.77% |
| Semiconductor |
$SOX |
561.21 |
-2.85 |
-0.51% |
+4.89% |
| Networking |
$NWX |
348.51 |
-2.14 |
-0.61% |
+7.59% |
| Broker/Dealer |
$XBD |
158.43 |
+0.29 |
+0.18% |
-1.33% |
| Retail |
$RLX |
896.78 |
+1.79 |
+0.20% |
-4.58% |
| Gold & Silver |
$XAU |
102.88 |
-0.50 |
-0.48% |
+22.26% |
| Bank |
$BKX |
67.86 |
+0.24 |
+0.35% |
-2.02% |
| Biotech |
$BTK |
2,756.66 |
+37.03 |
+1.36% |
+18.29% |
|
|
|
 |
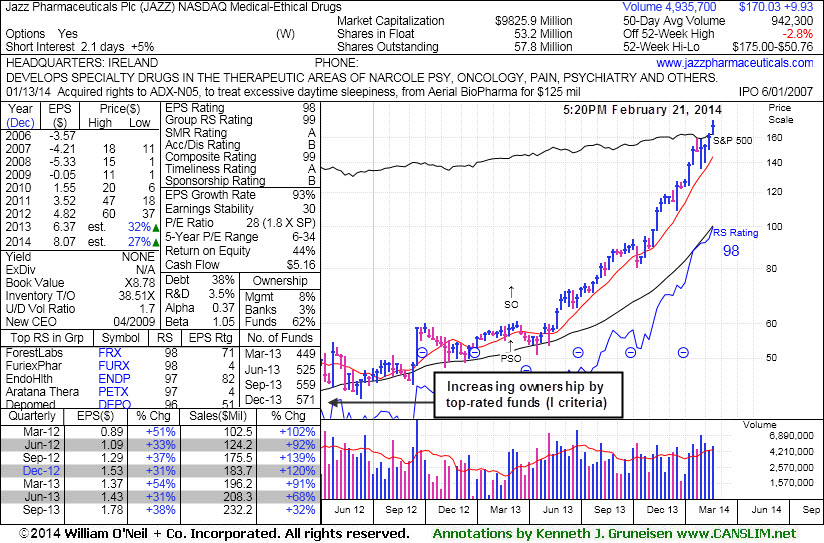
Financial Report May Prompt Greater Volume and Volatility
Kenneth J. Gruneisen - Passed the CAN SLIM® Master's Exam
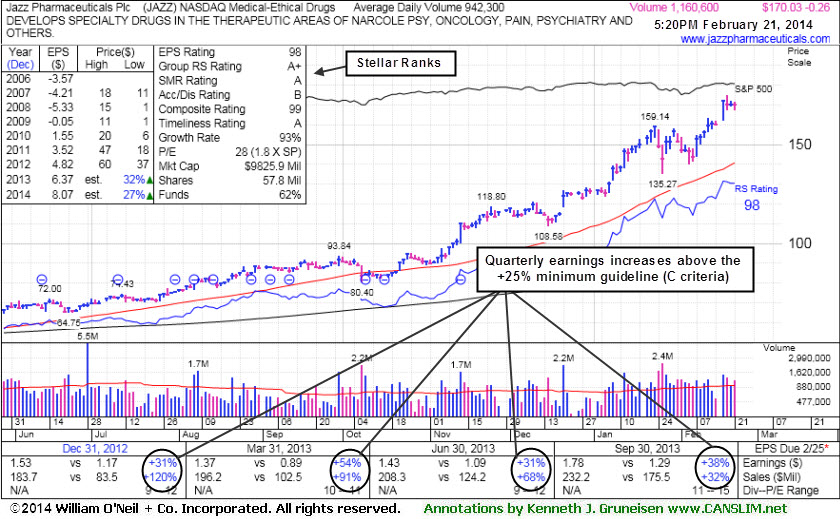
Jazz Pharmaceuticals Plc (JAZZ -$0.26 or -0.15% to $170.03) is perched near its 52-week and all-time high, very extended from any sound base. Its 50-day moving average (DMA) line and recent lows in the $135 area define important support to watch on pullbacks. Its last appearance in this FSU section was on 2/05/14 with annotated graphs under the headline, "Consolidating After Getting Very Extended".
The company is due to report financial results on Tuesday, February 25, 2014, after the close. Keep in mind that volume and volatility often increase near earnings news.
JAZZ has rallied as much as +87.7% since highlighted in yellow in the 9/30/13 mid-day report (read here). The pivot point cited was based its 9/03/13 high plus 10 cents after an advanced "3-weeks tight" base. It may have looked like an expensive stock which had run too high already to many investors at that time. When it finished that session with a solid gain backed by +160% above average volume reports noted that it clinched a technical buy signal. Volume at least +40% above average is the minimum volume necessary behind a breakout before action should be taken by investors. In this case the volume met the guideline, providing the necessary proof of sufficient institutional buying demand.
Prior notes have reminded members of the dangers of chasing extended stocks - "Disciplined investors avoid chasing stocks more than +5% above prior highs and always limit losses by selling any stock that falls more than -7% from their purchase price."
Fundamentals remain strong (C and A criteria) today with its strong sales and earnings increases continuing through the Sep '13 quarter. Its annual earnings (A criteria) history includes big FY '10, '11, and '12 earnings after a history of losses.
The number of top-rated funds owning its shares rose from 351 in Mar '12 to 571 in Dec '13, a very reassuring sign concerning the I criteria. The Medical - Ethical Drugs group is currently showing good leadership (L criteria) while coming in with an A+ rating for its Group Relative Strength.
|
|
|
Color Codes Explained :
Y - Better candidates highlighted by our
staff of experts.
G - Previously featured
in past reports as yellow but may no longer be buyable under the
guidelines.
***Last / Change / Volume data in this table is the closing quote data***
Symbol/Exchange
Company Name
Industry Group |
PRICE |
CHANGE
(%Change) |
Day High |
Volume
(% DAV)
(% 50 day avg vol) |
52 Wk Hi
% From Hi |
Featured
Date |
Price
Featured |
Pivot Featured |
|
Max Buy |
EQM
-
NYSE
E Q T Midstream Partners
ENERGY - Oil and Gas Pipelines
|
$65.47
|
+0.96
1.49% |
$65.75
|
122,442
103.76% of 50 DAV
50 DAV is 118,000
|
$67.80
-3.44%
|
12/12/2013
|
$53.17
|
PP = $56.51
|
|
MB = $59.34
|
 Most Recent Note - 2/21/2014 12:25:22 PM
G - Enduring distributional pressure after recently reporting earnings -2% on +22% sales revenues for the Dec '13 quarter, below the +25% minimum earnings guideline (C criteria), raising fundamental concerns. Its 50 DMA line defines near-term support.
>>> FEATURED STOCK ARTICLE : Leader Still Extended From Any Sound Base - 2/7/2014
View all notes |
Set NEW NOTE alert |
CANSLIM.net Company Profile |
SEC
News |
Chart |
Request a new note
C
A N
S L
I M


|
FB
-
NASDAQ
Facebook Inc Cl A
INTERNET
|
$68.59
|
-1.04
-1.49% |
$69.96
|
70,910,811
106.12% of 50 DAV
50 DAV is 66,824,000
|
$70.11
-2.17%
|
12/12/2013
|
$51.40
|
PP = $54.93
|
|
MB = $57.68
|
Most Recent Note - 2/20/2014 12:37:37 PM
G - Perched at its all-time high, extended from any sound base and well beyond the "secondary buy point" previously noted. Prior highs and its 50 DMA line coincide near $58 defining very important near-term support to watch on pullbacks. Disciplined investors avoid chasing extended stocks.
>>> FEATURED STOCK ARTICLE : Volume Totals Cooling While Holding Ground at Highs - 2/6/2014
View all notes |
Set NEW NOTE alert |
CANSLIM.net Company Profile |
SEC
News |
Chart |
Request a new note
C
A N
S L
I M
|
GNRC
-
NYSE
Generac Hldgs Inc
Electrical-Power/Equipmt
|
$55.48
|
+0.25
0.45% |
$55.72
|
675,947
73.63% of 50 DAV
50 DAV is 918,000
|
$57.68
-3.81%
|
2/14/2014
|
$56.50
|
PP = $57.39
|
|
MB = $60.26
|
Most Recent Note - 2/20/2014 1:05:49 PM
Y - Encountering resistance near prior highs in the $57 area since highlighted in yellow in the 2/14/14 mid-day report (read here) with a new pivot point based on its 1/06/14 high plus 10 cents. Volume-driven gains into new high territory are needed to confirm a new technical buy signal. See the latest FSU analysis for more details and new annotated graphs.
>>> FEATURED STOCK ARTICLE : Following Island Reversal Prior Highs May Act as Resistance - 2/14/2014
View all notes |
Set NEW NOTE alert |
CANSLIM.net Company Profile |
SEC
News |
Chart |
Request a new note
C
A N
S L
I M
|
JAZZ
-
NASDAQ
Jazz Pharmaceuticals Plc
DRUGS - Biotechnology
|
$170.03
|
-0.26
-0.15% |
$171.50
|
1,162,142
123.37% of 50 DAV
50 DAV is 942,000
|
$175.00
-2.84%
|
9/30/2013
|
$93.20
|
PP = $89.10
|
|
MB = $93.56
|
Most Recent Note - 2/21/2014 5:43:21 PM
G - Perched near all-time highs, very extended from any sound base. Its 50 DMA line and recent lows in the $135 area define important support to watch on pullbacks. Earnings news is due on 2/25/14. See the latest FSU analysis for more details and new annotated graphs.
>>> FEATURED STOCK ARTICLE : Financial Report May Prompt Greater Volume and Volatility - 2/21/2014
View all notes |
Set NEW NOTE alert |
CANSLIM.net Company Profile |
SEC
News |
Chart |
Request a new note
C
A N
S L
I M
|
KORS
-
NYSE
Michael Kors Hldgs Ltd
RETAIL - Apparel Stores
|
$97.56
|
-0.44
-0.45% |
$98.48
|
1,331,221
32.48% of 50 DAV
50 DAV is 4,099,000
|
$99.74
-2.19%
|
2/4/2014
|
$90.92
|
PP = $84.68
|
|
MB = $88.91
|
Most Recent Note - 2/19/2014 6:09:44 PM
G - Perched at its 52-week high after wedging higher, very extended from its prior base. Prior highs in the $84 area define the nearest chart support level. See the latest FSU analysis for more details and new annotated graphs.
>>> FEATURED STOCK ARTICLE : Extended From Sound Base and Wedging Higher - 2/19/2014
View all notes |
Set NEW NOTE alert |
CANSLIM.net Company Profile |
SEC
News |
Chart |
Request a new note
C
A N
S L
I M
|
Symbol/Exchange
Company Name
Industry Group |
PRICE |
CHANGE
(%Change) |
Day High |
Volume
(% DAV)
(% 50 day avg vol) |
52 Wk Hi
% From Hi |
Featured
Date |
Price
Featured |
Pivot Featured |
|
Max Buy |
PCLN
-
NASDAQ
Priceline.com Inc
INTERNET - Internet Software and Services
|
$1,315.65
|
+32.65
2.54% |
$1,333.12
|
2,073,195
300.03% of 50 DAV
50 DAV is 691,000
|
$1,313.82
0.14%
|
12/18/2013
|
$1,156.20
|
PP = $1,198.85
|
|
MB = $1,258.79
|
Most Recent Note - 2/21/2014 12:39:04 PM
G - Gapped up today hitting another new 52-week high, adding to an impressive streak of gains marked by above average volume. Rallying with no resistance due to overhead supply, getting more extended from any sound base.
>>> FEATURED STOCK ARTICLE : Extended From Prior Highs After 6th Straight Gain - 2/13/2014
View all notes |
Set NEW NOTE alert |
CANSLIM.net Company Profile |
SEC
News |
Chart |
Request a new note
C
A N
S L
I M
|
SFUN
-
NYSE
Soufun Hldgs Ltd Ads A
INTERNET - Internet Information Providers
|
$79.99
|
-1.11
-1.37% |
$81.25
|
1,170,644
79.91% of 50 DAV
50 DAV is 1,465,000
|
$95.39
-16.14%
|
10/17/2013
|
$58.02
|
PP = $53.87
|
|
MB = $56.56
|
Most Recent Note - 2/18/2014 6:36:15 PM
G - Consolidating near its 50 DMA line but it has not formed a sound base. See the latest FSU analysis for more details and new annotated graphs.
>>> FEATURED STOCK ARTICLE : Finding Support Near 50-Day Moving Average Line - 2/18/2014
View all notes |
Set NEW NOTE alert |
CANSLIM.net Company Profile |
SEC
News |
Chart |
Request a new note
C
A N
S L
I M
|
SILC
-
NASDAQ
Silicom Ltd
COMPUTER HARDWARE - Networking andamp; Communication Dev
|
$68.29
|
+0.09
0.13% |
$68.65
|
65,107
94.36% of 50 DAV
50 DAV is 69,000
|
$69.03
-1.07%
|
12/23/2013
|
$44.62
|
PP = $46.25
|
|
MB = $48.56
|
Most Recent Note - 2/18/2014 6:32:56 PM
G - Rallied for yet another new 52-week high with today's volume-driven gain. Extended from any sound base after 9 consecutive weekly gains. Disciplined investors avoid chasing extended stocks.
>>> FEATURED STOCK ARTICLE : Stubbornly Held Ground Following Breakaway Gap - 2/11/2014
View all notes |
Set NEW NOTE alert |
CANSLIM.net Company Profile |
SEC
News |
Chart |
Request a new note
C
A N
S L
I M
|
ULTI
-
NASDAQ
Ultimate Software Group
INTERNET - Internet Software and Services
|
$168.86
|
+0.67
0.40% |
$171.54
|
236,002
116.26% of 50 DAV
50 DAV is 203,000
|
$168.62
0.14%
|
1/27/2014
|
$153.75
|
PP = $162.98
|
|
MB = $171.13
|
Most Recent Note - 2/20/2014 1:02:38 PM
Y - Recently wedging higher with gains lacking great volume conviction, now perched above its pivot point and below its "max buy" level. Found support above its 50 DMA line following a worrisome "negative reversal" on 2/05/14. Fundamentals remain strong after solid Dec '13 earnings.
>>> FEATURED STOCK ARTICLE : Stalled and Encountering Distributional Pressure - 2/12/2014
View all notes |
Set NEW NOTE alert |
CANSLIM.net Company Profile |
SEC
News |
Chart |
Request a new note
C
A N
S L
I M
|
VRX
-
NYSE
Valeant Pharmaceuticals
DRUGS - Drug Manufacturers - Other
|
$146.26
|
-1.74
-1.18% |
$148.43
|
1,568,942
113.44% of 50 DAV
50 DAV is 1,383,000
|
$148.73
-1.66%
|
9/11/2013
|
$100.26
|
PP = $105.50
|
|
MB = $110.78
|
Most Recent Note - 2/18/2014 12:50:12 PM
G - Hitting new all-time highs today with another considerable gain, getting more extended from any sound base. Its 50 DMA line ($125) defines near-term support to watch.
>>> FEATURED STOCK ARTICLE : Hovering Near All-Time Highs Extended From Sound Base - 2/10/2014
View all notes |
Set NEW NOTE alert |
CANSLIM.net Company Profile |
SEC
News |
Chart |
Request a new note
C
A N
S L
I M
|
Symbol/Exchange
Company Name
Industry Group |
PRICE |
CHANGE
(%Change) |
Day High |
Volume
(% DAV)
(% 50 day avg vol) |
52 Wk Hi
% From Hi |
Featured
Date |
Price
Featured |
Pivot Featured |
|
Max Buy |
|
|
|
THESE ARE NOT BUY RECOMMENDATIONS!
Comments contained in the body of this report are technical
opinions only. The material herein has been obtained
from sources believed to be reliable and accurate, however,
its accuracy and completeness cannot be guaranteed.
This site is not an investment advisor, hence it does
not endorse or recommend any securities or other investments.
Any recommendation contained in this report may not
be suitable for all investors and it is not to be deemed
an offer or solicitation on our part with respect to
the purchase or sale of any securities. All trademarks,
service marks and trade names appearing in this report
are the property of their respective owners, and are
likewise used for identification purposes only.
This report is a service available
only to active Paid Premium Members.
You may opt-out of receiving report notifications
at any time. Questions or comments may be submitted
by writing to Premium Membership Services 665 S.E. 10 Street, Suite 201 Deerfield Beach, FL 33441-5634 or by calling 1-800-965-8307
or 954-785-1121.
|
|
|

