You are not logged in.
This means you
CAN ONLY VIEW reports that were published prior to Tuesday, March 25, 2025.
You
MUST UPGRADE YOUR MEMBERSHIP if you want to see any current reports.
AFTER MARKET UPDATE - THURSDAY, FEBRUARY 20TH, 2014
Previous After Market Report Next After Market Report >>>
|
|
|
|
DOW |
+92.67 |
16,133.23 |
+0.58% |
|
Volume |
660,334,640 |
-4% |
|
Volume |
1,838,462,840 |
+2% |
|
NASDAQ |
+29.60 |
4,267.55 |
+0.70% |
|
Advancers |
1,982 |
63% |
|
Advancers |
1,834 |
68% |
|
S&P 500 |
+11.03 |
1,839.78 |
+0.60% |
|
Decliners |
1,033 |
33% |
|
Decliners |
761 |
28% |
|
Russell 2000 |
+13.05 |
1,162.12 |
+1.14% |
|
52 Wk Highs |
137 |
|
|
52 Wk Highs |
138 |
|
|
S&P 600 |
+7.60 |
655.25 |
+1.17% |
|
52 Wk Lows |
24 |
|
|
52 Wk Lows |
18 |
|
|
 |
Breadth Positive as Major Averages Rose Again
Kenneth J. Gruneisen - Passed the CAN SLIM® Master's Exam
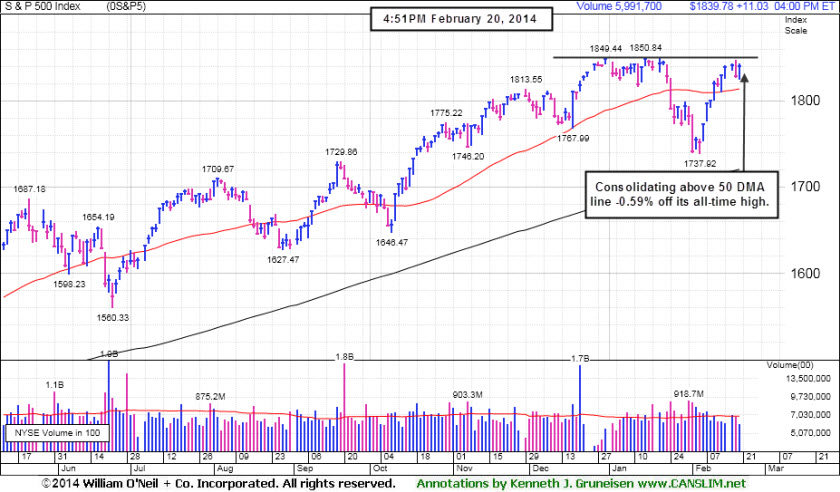
The major averages ended near their best levels of the session on Thursday. The Dow Jones Industrial Average gained 92 points to 16,133, the S&P 500 added 11 points to 1,839 and the NASDAQ advanced 29 points with the index closing at 4,267. The volume totals were reported mixed, slightly higher than the prior trading session's volume totals on the Nasdaq exchange and slightly lower on the NYSE. Breadth was positive as advancers led decliners by nearly a 2-1 ratio on the NYSE and 7-3 on the Nasdaq exchange. There were 61 high-ranked companies from the CANSLIM.net Leaders List that made new 52-week highs and appeared on the CANSLIM.net BreakOuts Page, up from the total of 48 stocks on the prior session. The list of stocks hitting new 52-week highs easily outnumbered new 52-week lows on the Nasdaq exchange and on the NYSE. There were gains for 7 of the 11 high-ranked companies currently included on the Featured Stocks Page. The Market (M criteria) environment has been noted as a "Confirmed Uptrend". For any rally to be sustained it is critical for there to be healthy leadership, so it remains crucial for many stocks to continue hitting new 52-week highs.
Stocks held their gains into the closing bell as investors overlooked a batch of mixed economic data and corporate profit tallies. All 10 sectors on the S&P ended higher. Industrial stocks were the top performers with Caterpillar (CAT +0.74%).
On the earnings front, shares of Wal-Mart (WMT +1.78%) rose after the company reported weaker-than-expected quarterly revenues and offered a disappointing full-year outlook. On the upside, Tesla Motors (TSLA +8.43%) as record fourth-quarter automobile sales helped the company top analysts' estimates.
Turning to fixed income markets, Treasuries ended lower along the curve. The benchmark 10-year was down 1/16 of a point to yield 2.75% and the 30-year bond gave up 3/32 to yield 3.72%.
The CANSLIM.net Featured Stocks Page shows the most action-worthy candidates and their latest notes and a Headline Link directs members to the latest detailed analysis with data-packed graphs annotated by a Certified expert along with links to additional resources. The Premium Member Homepage includes "dynamic archives" to all prior pay reports published. Watch for an announcement via email concerning the next WEBCAST.
PICTURED: The S&P 500 index is consolidating above its 50-day moving average (DMA) line and perched -0.59% off its all-time high.
|
 Kenneth J. Gruneisen started out as a licensed stockbroker in August 1987, a couple of months prior to the historic stock market crash that took the Dow Jones Industrial Average down -22.6% in a single day. He has published daily fact-based fundamental and technical analysis on high-ranked stocks online for two decades. Through FACTBASEDINVESTING.COM, Kenneth provides educational articles, news, market commentary, and other information regarding proven investment systems that work in good times and bad.
Comments contained in the body of this report are technical opinions only and are not necessarily those of Gruneisen Growth Corp. The material herein has been obtained from sources believed to be reliable and accurate, however, its accuracy and completeness cannot be guaranteed. Our firm, employees, and customers may effect transactions, including transactions contrary to any recommendation herein, or have positions in the securities mentioned herein or options with respect thereto. Any recommendation contained in this report may not be suitable for all investors and it is not to be deemed an offer or solicitation on our part with respect to the purchase or sale of any securities. |
|
 |
Tech, Retail, and Financial Indexes Rose
Kenneth J. Gruneisen - Passed the CAN SLIM® Master's Exam
Financial shares had a positive bias as the Bank Index ($BKX +0.37%) and the Broker/Dealer Index ($XBD +0.90%) rose. The Retail Index ($RLX +0.51%) posted a modest gain. The Integrated Oil Index ($XOI +0.53%) posted a small gain while the Oil Services Index ($OSX -0.04%) finished flat. The Semiconductor Index ($SOX +0.72%), Networking Index ($NWX +1.30%), and Biotechnology Index ($BTK +2.13%) posted unanimous gains. The Gold & Silver Index ($XAU +3.92%)
Charts courtesy www.stockcharts.com
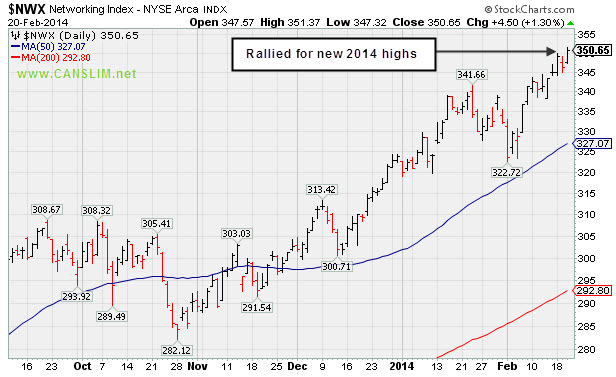
PICTURED: The Networking Index ($NWX +1.30%) is perched at a new 2014 high.
|
|
|
 |
Weak Technical Action Hurting Outlook
Kenneth J. Gruneisen - Passed the CAN SLIM® Master's Exam
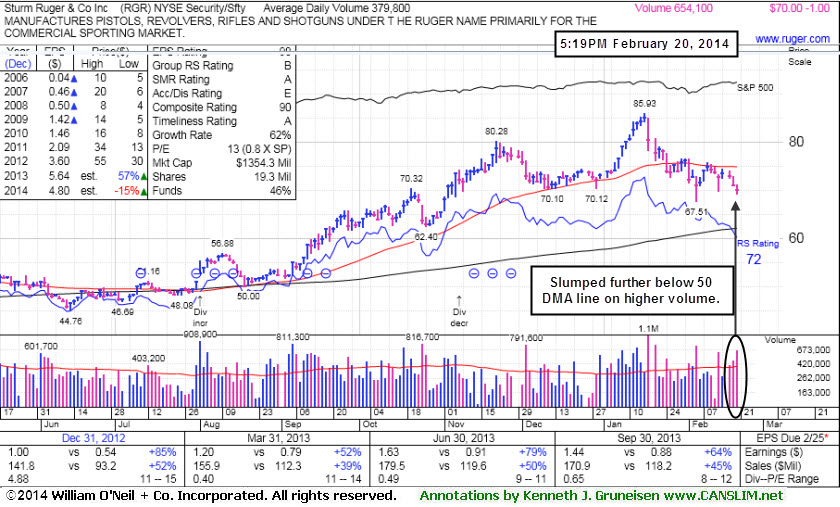
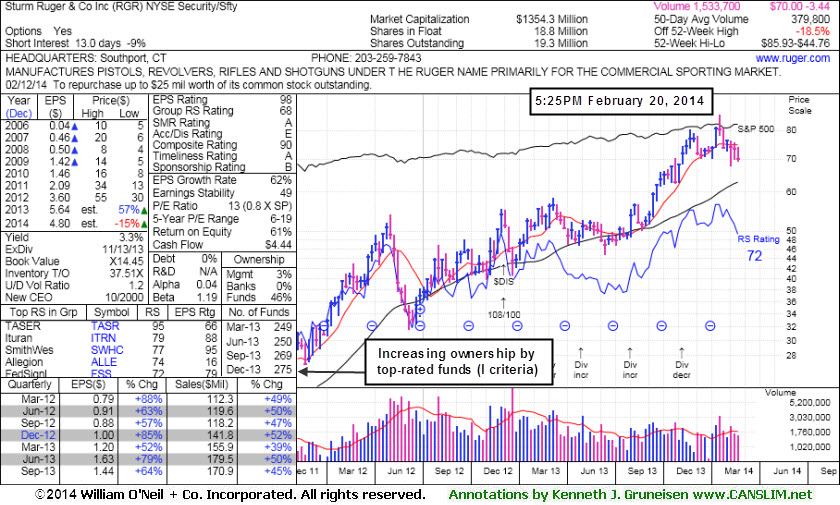
Sturm Ruger & Co Inc (RGR -$1.00 or -1.41% to $70.00) is sputtering below its 50-day moving average (DMA) line which recently acted as resistance. Its Relative Strength rating has slumped to 72, below the 80+ minimum guideline for buy candidates. It will be dropped from the Featured Stocks list tonight due to weak technical deterioration. It faces overhead supply up through the $85 level after recent distributional action. It was last shown in this FSU section on 2/04/14 with an annotated graph under the headline, "Slumped Into Prior Base Negating Breakout and Violated 50-Day Average", while enduring worrisome distributional pressure. It negated the prior breakout and slumped back into the prior base raising concerns. Disciplined investors always limit losses if ever any stock falls more than -7% from where it was purchased.
It reported earnings +64% on +45% sales revenues for the quarter ended September 30, 2013 versus the year ago period, the 10th consecutive quarterly comparison with a strong earnings increase well above the +25% minimum guideline (C criteria) backed by strong sales revenues growth. It also has a good annual earnings (A criteria) history. The number of top-rated funds owning its shares rose from 248 in Mar '13 to 275 in Dec '13, a slightly reassuring sign concerning the I criteria. Keep in mind that some mutual fund managers are also restricted by their fund family's rules from buying companies that make firearms, tobacco, or alcohol products.
See additional details in the article "Ken's Mailbag Q&A 12/10/12 - Challenges of when to lock in a profit or accumulate more shares".
|
|
|
Color Codes Explained :
Y - Better candidates highlighted by our
staff of experts.
G - Previously featured
in past reports as yellow but may no longer be buyable under the
guidelines.
***Last / Change / Volume data in this table is the closing quote data***
Symbol/Exchange
Company Name
Industry Group |
PRICE |
CHANGE
(%Change) |
Day High |
Volume
(% DAV)
(% 50 day avg vol) |
52 Wk Hi
% From Hi |
Featured
Date |
Price
Featured |
Pivot Featured |
|
Max Buy |
EQM
-
NYSE
E Q T Midstream Partners
ENERGY - Oil and Gas Pipelines
|
$64.51
|
-0.91
-1.39% |
$66.16
|
217,690
189.30% of 50 DAV
50 DAV is 115,000
|
$67.80
-4.85%
|
12/12/2013
|
$53.17
|
PP = $56.51
|
|
MB = $59.34
|
Most Recent Note - 2/18/2014 6:39:40 PM
G - Rallied for a best-ever close with 2 times average volume behind today's gain. Reported earnings -2% on +22% sales revenues for the Dec '13 quarter, below the +25% minimum earnings guideline (C criteria) raising fundamental concerns. Prior reports cautioned members - "It is extended from any sound base pattern. Prior highs in the $56 area define support to watch on pullbacks."
>>> FEATURED STOCK ARTICLE : Leader Still Extended From Any Sound Base - 2/7/2014
View all notes |
Set NEW NOTE alert |
CANSLIM.net Company Profile |
SEC
News |
Chart |
Request a new note
C
A N
S L
I M


|
FB
-
NASDAQ
Facebook Inc Cl A
INTERNET
|
$69.63
|
+1.57
2.31% |
$70.11
|
130,872,396
201.15% of 50 DAV
50 DAV is 65,062,000
|
$69.08
0.80%
|
12/12/2013
|
$51.40
|
PP = $54.93
|
|
MB = $57.68
|
 Most Recent Note - 2/20/2014 12:37:37 PM
G - Perched at its all-time high, extended from any sound base and well beyond the "secondary buy point" previously noted. Prior highs and its 50 DMA line coincide near $58 defining very important near-term support to watch on pullbacks. Disciplined investors avoid chasing extended stocks.
>>> FEATURED STOCK ARTICLE : Volume Totals Cooling While Holding Ground at Highs - 2/6/2014
View all notes |
Set NEW NOTE alert |
CANSLIM.net Company Profile |
SEC
News |
Chart |
Request a new note
C
A N
S L
I M
|
GNRC
-
NYSE
Generac Hldgs Inc
Electrical-Power/Equipmt
|
$55.23
|
-0.03
-0.05% |
$55.79
|
578,660
63.10% of 50 DAV
50 DAV is 917,000
|
$57.68
-4.25%
|
2/14/2014
|
$56.50
|
PP = $57.39
|
|
MB = $60.26
|
Most Recent Note - 2/20/2014 1:05:49 PM
Y - Encountering resistance near prior highs in the $57 area since highlighted in yellow in the 2/14/14 mid-day report (read here) with a new pivot point based on its 1/06/14 high plus 10 cents. Volume-driven gains into new high territory are needed to confirm a new technical buy signal. See the latest FSU analysis for more details and new annotated graphs.
>>> FEATURED STOCK ARTICLE : Following Island Reversal Prior Highs May Act as Resistance - 2/14/2014
View all notes |
Set NEW NOTE alert |
CANSLIM.net Company Profile |
SEC
News |
Chart |
Request a new note
C
A N
S L
I M
|
JAZZ
-
NASDAQ
Jazz Pharmaceuticals Plc
DRUGS - Biotechnology
|
$170.29
|
+0.01
0.01% |
$172.35
|
975,571
103.89% of 50 DAV
50 DAV is 939,000
|
$175.00
-2.69%
|
9/30/2013
|
$93.20
|
PP = $89.10
|
|
MB = $93.56
|
Most Recent Note - 2/18/2014 6:30:17 PM
G - Hit new 52-week and all-time highs with today's considerable volume-driven gain amid strength in the group inspired by M&A action. It is extended from any sound base. Its 50 DMA line and recent lows in the $135 area define important support to watch on pullbacks.
>>> FEATURED STOCK ARTICLE : Consolidating After Getting Very Extended - 2/5/2014
View all notes |
Set NEW NOTE alert |
CANSLIM.net Company Profile |
SEC
News |
Chart |
Request a new note
C
A N
S L
I M
|
KORS
-
NYSE
Michael Kors Hldgs Ltd
RETAIL - Apparel Stores
|
$98.00
|
+0.22
0.22% |
$98.53
|
1,868,140
45.38% of 50 DAV
50 DAV is 4,117,000
|
$99.74
-1.74%
|
2/4/2014
|
$90.92
|
PP = $84.68
|
|
MB = $88.91
|
Most Recent Note - 2/19/2014 6:09:44 PM
G - Perched at its 52-week high after wedging higher, very extended from its prior base. Prior highs in the $84 area define the nearest chart support level. See the latest FSU analysis for more details and new annotated graphs.
>>> FEATURED STOCK ARTICLE : Extended From Sound Base and Wedging Higher - 2/19/2014
View all notes |
Set NEW NOTE alert |
CANSLIM.net Company Profile |
SEC
News |
Chart |
Request a new note
C
A N
S L
I M
|
Symbol/Exchange
Company Name
Industry Group |
PRICE |
CHANGE
(%Change) |
Day High |
Volume
(% DAV)
(% 50 day avg vol) |
52 Wk Hi
% From Hi |
Featured
Date |
Price
Featured |
Pivot Featured |
|
Max Buy |
PCLN
-
NASDAQ
Priceline.com Inc
INTERNET - Internet Software and Services
|
$1,283.00
|
+9.24
0.73% |
$1,286.00
|
1,701,303
255.84% of 50 DAV
50 DAV is 665,000
|
$1,313.82
-2.35%
|
12/18/2013
|
$1,156.20
|
PP = $1,198.85
|
|
MB = $1,258.79
|
Most Recent Note - 2/20/2014 12:42:07 PM
G - Pulling back from its 52-week high and slumping near its "max buy" level following an impressive streak of 8 consecutive gains marked by above average volume. Rallied with no resistance due to overhead supply.
>>> FEATURED STOCK ARTICLE : Extended From Prior Highs After 6th Straight Gain - 2/13/2014
View all notes |
Set NEW NOTE alert |
CANSLIM.net Company Profile |
SEC
News |
Chart |
Request a new note
C
A N
S L
I M
|
RGR
-
NYSE
Sturm Ruger & Co Inc
CONSUMER DURABLES - Sporting Goods
|
$70.00
|
-1.00
-1.41% |
$71.07
|
655,729
121.43% of 50 DAV
50 DAV is 540,000
|
$85.93
-18.54%
|
1/8/2014
|
$78.87
|
PP = $80.38
|
|
MB = $84.40
|
Most Recent Note - 2/20/2014 5:54:02 PM
Slumped further below its 50 DMA line today on higher volume and it will be dropped from the Featured Stocks list tonight. Relative Strength rating has slumped to 72, below the 80+ minimum guideline for buy candidates. See the latest FSU analysis for more details and new annotated graphs.
>>> FEATURED STOCK ARTICLE : Weak Technical Action Hurting Outlook - 2/20/2014
View all notes |
Set NEW NOTE alert |
CANSLIM.net Company Profile |
SEC
News |
Chart |
Request a new note
C
A N
S L
I M
|
SFUN
-
NYSE
Soufun Hldgs Ltd Ads A
INTERNET - Internet Information Providers
|
$81.10
|
-0.43
-0.53% |
$82.39
|
1,338,472
91.80% of 50 DAV
50 DAV is 1,458,000
|
$95.39
-14.98%
|
10/17/2013
|
$58.02
|
PP = $53.87
|
|
MB = $56.56
|
Most Recent Note - 2/18/2014 6:36:15 PM
G - Consolidating near its 50 DMA line but it has not formed a sound base. See the latest FSU analysis for more details and new annotated graphs.
>>> FEATURED STOCK ARTICLE : Finding Support Near 50-Day Moving Average Line - 2/18/2014
View all notes |
Set NEW NOTE alert |
CANSLIM.net Company Profile |
SEC
News |
Chart |
Request a new note
C
A N
S L
I M
|
SILC
-
NASDAQ
Silicom Ltd
COMPUTER HARDWARE - Networking andamp; Communication Dev
|
$68.20
|
+1.00
1.49% |
$68.91
|
80,815
118.85% of 50 DAV
50 DAV is 68,000
|
$69.03
-1.20%
|
12/23/2013
|
$44.62
|
PP = $46.25
|
|
MB = $48.56
|
Most Recent Note - 2/18/2014 6:32:56 PM
G - Rallied for yet another new 52-week high with today's volume-driven gain. Extended from any sound base after 9 consecutive weekly gains. Disciplined investors avoid chasing extended stocks.
>>> FEATURED STOCK ARTICLE : Stubbornly Held Ground Following Breakaway Gap - 2/11/2014
View all notes |
Set NEW NOTE alert |
CANSLIM.net Company Profile |
SEC
News |
Chart |
Request a new note
C
A N
S L
I M
|
ULTI
-
NASDAQ
Ultimate Software Group
INTERNET - Internet Software and Services
|
$168.19
|
+1.79
1.08% |
$168.58
|
174,889
87.01% of 50 DAV
50 DAV is 201,000
|
$168.62
-0.26%
|
1/27/2014
|
$153.75
|
PP = $162.98
|
|
MB = $171.13
|
Most Recent Note - 2/20/2014 1:02:38 PM
Y - Recently wedging higher with gains lacking great volume conviction, now perched above its pivot point and below its "max buy" level. Found support above its 50 DMA line following a worrisome "negative reversal" on 2/05/14. Fundamentals remain strong after solid Dec '13 earnings.
>>> FEATURED STOCK ARTICLE : Stalled and Encountering Distributional Pressure - 2/12/2014
View all notes |
Set NEW NOTE alert |
CANSLIM.net Company Profile |
SEC
News |
Chart |
Request a new note
C
A N
S L
I M
|
Symbol/Exchange
Company Name
Industry Group |
PRICE |
CHANGE
(%Change) |
Day High |
Volume
(% DAV)
(% 50 day avg vol) |
52 Wk Hi
% From Hi |
Featured
Date |
Price
Featured |
Pivot Featured |
|
Max Buy |
VRX
-
NYSE
Valeant Pharmaceuticals
DRUGS - Drug Manufacturers - Other
|
$148.00
|
+2.98
2.05% |
$148.73
|
2,110,004
155.15% of 50 DAV
50 DAV is 1,360,000
|
$147.41
0.40%
|
9/11/2013
|
$100.26
|
PP = $105.50
|
|
MB = $110.78
|
Most Recent Note - 2/18/2014 12:50:12 PM
G - Hitting new all-time highs today with another considerable gain, getting more extended from any sound base. Its 50 DMA line ($125) defines near-term support to watch.
>>> FEATURED STOCK ARTICLE : Hovering Near All-Time Highs Extended From Sound Base - 2/10/2014
View all notes |
Set NEW NOTE alert |
CANSLIM.net Company Profile |
SEC
News |
Chart |
Request a new note
C
A N
S L
I M
|
|
|
|
THESE ARE NOT BUY RECOMMENDATIONS!
Comments contained in the body of this report are technical
opinions only. The material herein has been obtained
from sources believed to be reliable and accurate, however,
its accuracy and completeness cannot be guaranteed.
This site is not an investment advisor, hence it does
not endorse or recommend any securities or other investments.
Any recommendation contained in this report may not
be suitable for all investors and it is not to be deemed
an offer or solicitation on our part with respect to
the purchase or sale of any securities. All trademarks,
service marks and trade names appearing in this report
are the property of their respective owners, and are
likewise used for identification purposes only.
This report is a service available
only to active Paid Premium Members.
You may opt-out of receiving report notifications
at any time. Questions or comments may be submitted
by writing to Premium Membership Services 665 S.E. 10 Street, Suite 201 Deerfield Beach, FL 33441-5634 or by calling 1-800-965-8307
or 954-785-1121.
|
|
|

