You are not logged in.
This means you
CAN ONLY VIEW reports that were published prior to Tuesday, April 15, 2025.
You
MUST UPGRADE YOUR MEMBERSHIP if you want to see any current reports.
AFTER MARKET UPDATE - MONDAY, FEBRUARY 24TH, 2014
Previous After Market Report Next After Market Report >>>
|
|
|
|
DOW |
+103.84 |
16,207.14 |
+0.64% |
|
Volume |
830,707,780 |
+4% |
|
Volume |
2,010,141,080 |
+1% |
|
NASDAQ |
+29.56 |
4,292.97 |
+0.69% |
|
Advancers |
1,893 |
60% |
|
Advancers |
1,686 |
63% |
|
S&P 500 |
+11.36 |
1,847.61 |
+0.62% |
|
Decliners |
1,149 |
36% |
|
Decliners |
922 |
34% |
|
Russell 2000 |
+9.92 |
1,174.55 |
+0.85% |
|
52 Wk Highs |
252 |
|
|
52 Wk Highs |
221 |
|
|
S&P 600 |
+5.38 |
660.56 |
+0.82% |
|
52 Wk Lows |
16 |
|
|
52 Wk Lows |
9 |
|
|
 |
Major Averages Rallied With Higher Volume as Leadership Expanded
Kenneth J. Gruneisen - Passed the CAN SLIM® Master's Exam
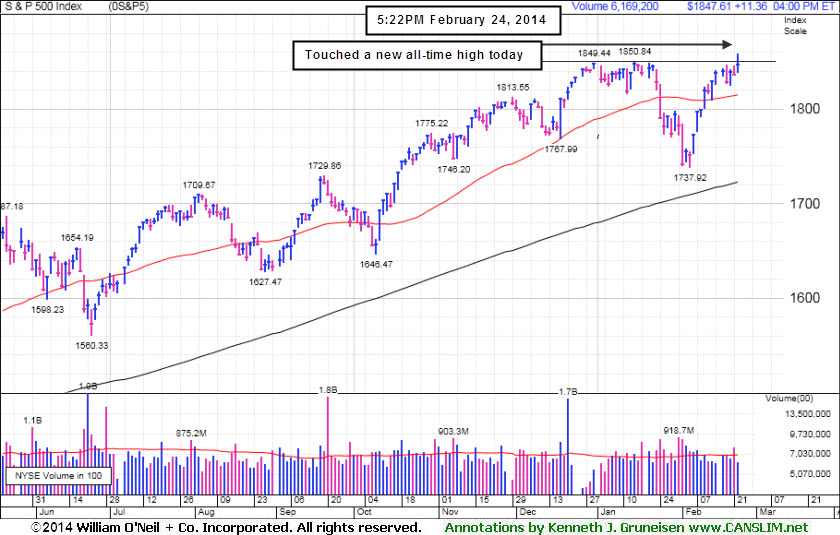
Stocks rallied on Monday's session. The Dow was up 104 points to 16,207. The NASDAQ rose 30 points to 4,292. The volume totals were reported higher than the prior trading session's volume totals on the Nasdaq exchange and on the NYSE, a reassuring sign of increasing institutional buying demand. Breadth was positive as advancers led decliners by a 5-3 ratio on the NYSE and 2-1 on the Nasdaq exchange. There were 91 high-ranked companies from the CANSLIM.net Leaders List that made new 52-week highs and appeared on the CANSLIM.net BreakOuts Page, up from the total of 75 stocks on the prior session. The list of stocks hitting new 52-week highs expanded and easily outnumbered new 52-week lows on the Nasdaq exchange and on the NYSE. There were gains for 7 of the 11 high-ranked companies currently included on the Featured Stocks Page. The Market (M criteria) environment has been noted as a "Confirmed Uptrend". For any rally to be sustained it is critical for there to be healthy leadership, so it remains crucial for many stocks to continue hitting new 52-week highs.
The major averages advanced amid an increase in merger activity. Shares of RF Micro Devices (RFMD +21%) rose after agreeing to purchase TriQuint Semiconductor (TQNT +26%) for approximately $1.6 billion. Jos. A. Banks (JOSB +9.1%) jumped after rival Men's Wearhouse (MW +7.54%) increased its offer to buy the company.
The advance was also attributed to investor optimism that the recently weak economic data was due to the winter weather. Stocks rose even after a report showed manufacturing activity in the Dallas region slowed during February.
Nine of 10 sectors in the S&P 500 were up on the session. Energy was the best performing group. Exxon (XOM +1.5%) to $96.44. Financials and industrials also paced the advance including Morgan Stanley (MS +2.3%) and General Electric (GE +1.4%). Humana (HUM +10.6%) was notable gainer after it said government cuts to Medicare Advantage appear to be less than projected. Telecom was the lone sector in negative territory as Verizon (VZ -2.2%) fell.
Treasuries were lower with 10-year note down 3/32 to yield 2.74%.
The CANSLIM.net Featured Stocks Page shows the most action-worthy candidates and their latest notes and a Headline Link directs members to the latest detailed analysis with data-packed graphs annotated by a Certified expert along with links to additional resources. The Premium Member Homepage includes "dynamic archives" to all prior pay reports published. Watch for an announcement via email concerning the next WEBCAST.
PICTURED: The S&P 500 Index hit a new all-time high intra-day and gained 11 points to 1,847 to put the index less than a point from its best-ever close of 1,848 on 1/15/14.
|
 Kenneth J. Gruneisen started out as a licensed stockbroker in August 1987, a couple of months prior to the historic stock market crash that took the Dow Jones Industrial Average down -22.6% in a single day. He has published daily fact-based fundamental and technical analysis on high-ranked stocks online for two decades. Through FACTBASEDINVESTING.COM, Kenneth provides educational articles, news, market commentary, and other information regarding proven investment systems that work in good times and bad.
Comments contained in the body of this report are technical opinions only and are not necessarily those of Gruneisen Growth Corp. The material herein has been obtained from sources believed to be reliable and accurate, however, its accuracy and completeness cannot be guaranteed. Our firm, employees, and customers may effect transactions, including transactions contrary to any recommendation herein, or have positions in the securities mentioned herein or options with respect thereto. Any recommendation contained in this report may not be suitable for all investors and it is not to be deemed an offer or solicitation on our part with respect to the purchase or sale of any securities. |
|
 |
Financial, Retail, and Energy-Related Groups Led Gainers
Kenneth J. Gruneisen - Passed the CAN SLIM® Master's Exam
The Retail Index ($RLX +0.66%) posted a modest gain and financial shares were influential gainers on Monday as the Broker/Dealer Index ($XBD +1.21%) and the Bank Index ($BKX +1.25%) posted solid gains. The Biotechnology Index ($BTK +0.99%) and the Semiconductor Index ($SOX +0.38%) also edged higher while the Networking Index ($NWX -0.39%) ended with a small loss. Energy-related shares had a positive bias as the Integrated Oil Index ($XOI +1.28%) and the Oil Services Index ($OSX +2.29%) rallied. The Gold & Silver Index ($XAU +0.34%) rounded out the mostly positive session with a small gain.
Charts courtesy www.stockcharts.com
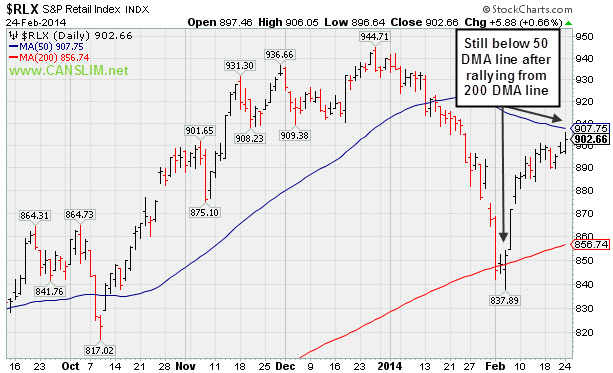
PICTURED: The Retail Index ($RLX +0.66%) is still below its 50-day moving average (DMA) line after finding support at its longer-term 200 DMA line.
| Oil Services |
$OSX |
279.24 |
+6.26 |
+2.29% |
-0.64% |
| Integrated Oil |
$XOI |
1,480.23 |
+18.72 |
+1.28% |
-1.52% |
| Semiconductor |
$SOX |
563.37 |
+2.16 |
+0.38% |
+5.30% |
| Networking |
$NWX |
347.15 |
-1.37 |
-0.39% |
+7.16% |
| Broker/Dealer |
$XBD |
160.34 |
+1.91 |
+1.21% |
-0.14% |
| Retail |
$RLX |
902.66 |
+5.88 |
+0.66% |
-3.95% |
| Gold & Silver |
$XAU |
103.23 |
+0.35 |
+0.34% |
+22.67% |
| Bank |
$BKX |
68.71 |
+0.85 |
+1.25% |
-0.79% |
| Biotech |
$BTK |
2,787.23 |
+28.68 |
+1.04% |
+19.60% |
|
|
|
 |
Breakout Backed by Four Times Average Volume
Kenneth J. Gruneisen - Passed the CAN SLIM® Master's Exam
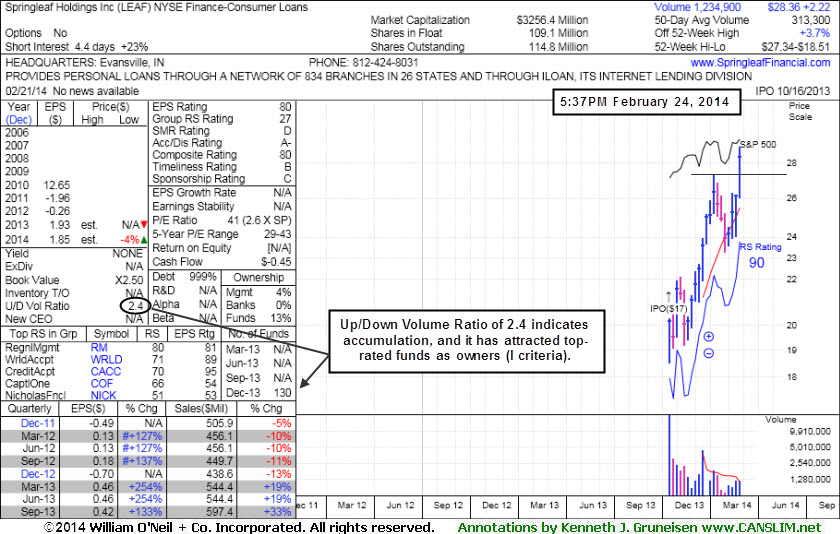
Springleaf Holdings Inc (LEAF +$2.22 on +8.49% to $28.36) gapped up and rallied for a new 52-week high and was highlighted in yellow with pivot point cited based on its 1/09/14 high plus 10 cents in the earlier mid-day report as shown on an annotated daily graph (read here). Its strong finish above its pivot point with a big gain on nearly 4 times average volume was well above the +40% above average volume threshold needed to trigger a technical buy signal. The weekly graph included below shows it on track for a 4th consecutive weekly gain after finding support near its 10-week moving average (WMA) line.
Earnings increases have been above the +25% minimum guideline (C criteria) in the 3 latest quarterly comparisons through Sep '13. Its Up/Down Volume Ratio of 2.4 is an unbiased indication that its shares have been under accumulation over the past 50 days. Itt has attracted top-rated funds as owners (I criteria).
 |
|
|
Color Codes Explained :
Y - Better candidates highlighted by our
staff of experts.
G - Previously featured
in past reports as yellow but may no longer be buyable under the
guidelines.
***Last / Change / Volume data in this table is the closing quote data***
Symbol/Exchange
Company Name
Industry Group |
PRICE |
CHANGE
(%Change) |
Day High |
Volume
(% DAV)
(% 50 day avg vol) |
52 Wk Hi
% From Hi |
Featured
Date |
Price
Featured |
Pivot Featured |
|
Max Buy |
EQM
-
NYSE
E Q T Midstream Partners
ENERGY - Oil and Gas Pipelines
|
$66.02
|
+0.55
0.84% |
$66.27
|
98,433
84.13% of 50 DAV
50 DAV is 117,000
|
$67.80
-2.63%
|
12/12/2013
|
$53.17
|
PP = $56.51
|
|
MB = $59.34
|
Most Recent Note - 2/21/2014 12:25:22 PM
G - Enduring distributional pressure after recently reporting earnings -2% on +22% sales revenues for the Dec '13 quarter, below the +25% minimum earnings guideline (C criteria), raising fundamental concerns. Its 50 DMA line defines near-term support.
>>> FEATURED STOCK ARTICLE : Leader Still Extended From Any Sound Base - 2/7/2014
View all notes |
Set NEW NOTE alert |
CANSLIM.net Company Profile |
SEC
News |
Chart |
Request a new note
C
A N
S L
I M


|
FB
-
NASDAQ
Facebook Inc Cl A
INTERNET
|
$70.78
|
+2.19
3.19% |
$71.44
|
76,745,393
113.66% of 50 DAV
50 DAV is 67,523,000
|
$70.11
0.96%
|
12/12/2013
|
$51.40
|
PP = $54.93
|
|
MB = $57.68
|
Most Recent Note - 2/20/2014 12:37:37 PM
G - Perched at its all-time high, extended from any sound base and well beyond the "secondary buy point" previously noted. Prior highs and its 50 DMA line coincide near $58 defining very important near-term support to watch on pullbacks. Disciplined investors avoid chasing extended stocks.
>>> FEATURED STOCK ARTICLE : Volume Totals Cooling While Holding Ground at Highs - 2/6/2014
View all notes |
Set NEW NOTE alert |
CANSLIM.net Company Profile |
SEC
News |
Chart |
Request a new note
C
A N
S L
I M
|
GNRC
-
NYSE
Generac Hldgs Inc
Electrical-Power/Equipmt
|
$55.36
|
-0.12
-0.22% |
$56.05
|
615,040
66.56% of 50 DAV
50 DAV is 924,000
|
$57.68
-4.02%
|
2/14/2014
|
$56.50
|
PP = $57.39
|
|
MB = $60.26
|
Most Recent Note - 2/20/2014 1:05:49 PM
Y - Encountering resistance near prior highs in the $57 area since highlighted in yellow in the 2/14/14 mid-day report (read here) with a new pivot point based on its 1/06/14 high plus 10 cents. Volume-driven gains into new high territory are needed to confirm a new technical buy signal. See the latest FSU analysis for more details and new annotated graphs.
>>> FEATURED STOCK ARTICLE : Following Island Reversal Prior Highs May Act as Resistance - 2/14/2014
View all notes |
Set NEW NOTE alert |
CANSLIM.net Company Profile |
SEC
News |
Chart |
Request a new note
C
A N
S L
I M
|
JAZZ
-
NASDAQ
Jazz Pharmaceuticals Plc
DRUGS - Biotechnology
|
$171.75
|
+1.72
1.01% |
$176.39
|
1,098,863
116.65% of 50 DAV
50 DAV is 942,000
|
$175.00
-1.86%
|
9/30/2013
|
$93.20
|
PP = $89.10
|
|
MB = $93.56
|
Most Recent Note - 2/21/2014 5:43:21 PM
G - Perched near all-time highs, very extended from any sound base. Its 50 DMA line and recent lows in the $135 area define important support to watch on pullbacks. Earnings news is due on 2/25/14. See the latest FSU analysis for more details and new annotated graphs.
>>> FEATURED STOCK ARTICLE : Financial Report May Prompt Greater Volume and Volatility - 2/21/2014
View all notes |
Set NEW NOTE alert |
CANSLIM.net Company Profile |
SEC
News |
Chart |
Request a new note
C
A N
S L
I M
|
KORS
-
NYSE
Michael Kors Hldgs Ltd
RETAIL - Apparel Stores
|
$98.58
|
+1.02
1.05% |
$99.35
|
1,654,465
40.64% of 50 DAV
50 DAV is 4,071,000
|
$99.74
-1.16%
|
2/4/2014
|
$90.92
|
PP = $84.68
|
|
MB = $88.91
|
Most Recent Note - 2/19/2014 6:09:44 PM
G - Perched at its 52-week high after wedging higher, very extended from its prior base. Prior highs in the $84 area define the nearest chart support level. See the latest FSU analysis for more details and new annotated graphs.
>>> FEATURED STOCK ARTICLE : Extended From Sound Base and Wedging Higher - 2/19/2014
View all notes |
Set NEW NOTE alert |
CANSLIM.net Company Profile |
SEC
News |
Chart |
Request a new note
C
A N
S L
I M
|
Symbol/Exchange
Company Name
Industry Group |
PRICE |
CHANGE
(%Change) |
Day High |
Volume
(% DAV)
(% 50 day avg vol) |
52 Wk Hi
% From Hi |
Featured
Date |
Price
Featured |
Pivot Featured |
|
Max Buy |
LEAF
-
NYSE
Springleaf Holdings Inc
Finance-Consumer Loans
|
$28.36
|
+2.22
8.49% |
$28.91
|
1,235,003
394.57% of 50 DAV
50 DAV is 313,000
|
$27.34
3.73%
|
2/24/2014
|
$28.60
|
PP = $27.44
|
|
MB = $28.81
|
 Most Recent Note - 2/24/2014 6:03:19 PM
Y - Gapped up and hit a new 52-week high and was highlighted in yellow with pivot point cited based on its 1/09/14 high plus 10 cents in the earlier mid-day report (read here). Solid gain above its pivot point backed by 4 times average volume clinched a convincing technical buy signal. Earnings increases have been above the +25% minimum guideline (C criteria) in the 3 latest quarterly comparisons through Sep '13. See the latest FSU analysis for more details and a new annotated weekly graph.

>>> FEATURED STOCK ARTICLE : Breakout Backed by Four Times Average Volume - 2/24/2014
View all notes |
Set NEW NOTE alert |
CANSLIM.net Company Profile |
SEC
News |
Chart |
Request a new note
C
A N
S L
I M
|
PCLN
-
NASDAQ
Priceline.com Inc
INTERNET - Internet Software and Services
|
$1,313.67
|
-1.98
-0.15% |
$1,324.00
|
825,493
114.18% of 50 DAV
50 DAV is 723,000
|
$1,333.12
-1.46%
|
12/18/2013
|
$1,156.20
|
PP = $1,198.85
|
|
MB = $1,258.79
|
Most Recent Note - 2/21/2014 12:39:04 PM
G - Gapped up today hitting another new 52-week high, adding to an impressive streak of gains marked by above average volume. Rallying with no resistance due to overhead supply, getting more extended from any sound base.
>>> FEATURED STOCK ARTICLE : Extended From Prior Highs After 6th Straight Gain - 2/13/2014
View all notes |
Set NEW NOTE alert |
CANSLIM.net Company Profile |
SEC
News |
Chart |
Request a new note
C
A N
S L
I M
|
SFUN
-
NYSE
Soufun Hldgs Ltd Ads A
INTERNET - Internet Information Providers
|
$75.01
|
-4.98
-6.23% |
$77.00
|
2,675,776
182.15% of 50 DAV
50 DAV is 1,469,000
|
$95.39
-21.36%
|
10/17/2013
|
$58.02
|
PP = $53.87
|
|
MB = $56.56
|
Most Recent Note - 2/24/2014 6:06:38 PM
Gapped down today for a damaging loss on higher volume indicative of distributional pressure while slumping further below its 50 DMA line. Due to weak technical action it will be dropped from the Featured Stocks list tonight. A rebound above its 50 DMA line is needed to help its outlook improve. See the latest FSU analysis for more details and annotated graphs.
>>> FEATURED STOCK ARTICLE : Finding Support Near 50-Day Moving Average Line - 2/18/2014
View all notes |
Set NEW NOTE alert |
CANSLIM.net Company Profile |
SEC
News |
Chart |
Request a new note
C
A N
S L
I M
|
SILC
-
NASDAQ
Silicom Ltd
COMPUTER HARDWARE - Networking andamp; Communication Dev
|
$68.44
|
+0.15
0.22% |
$68.69
|
84,545
120.78% of 50 DAV
50 DAV is 70,000
|
$69.03
-0.85%
|
12/23/2013
|
$44.62
|
PP = $46.25
|
|
MB = $48.56
|
Most Recent Note - 2/18/2014 6:32:56 PM
G - Rallied for yet another new 52-week high with today's volume-driven gain. Extended from any sound base after 9 consecutive weekly gains. Disciplined investors avoid chasing extended stocks.
>>> FEATURED STOCK ARTICLE : Stubbornly Held Ground Following Breakaway Gap - 2/11/2014
View all notes |
Set NEW NOTE alert |
CANSLIM.net Company Profile |
SEC
News |
Chart |
Request a new note
C
A N
S L
I M
|
ULTI
-
NASDAQ
Ultimate Software Group
INTERNET - Internet Software and Services
|
$170.79
|
+1.93
1.14% |
$171.74
|
170,866
82.94% of 50 DAV
50 DAV is 206,000
|
$171.54
-0.44%
|
1/27/2014
|
$153.75
|
PP = $162.98
|
|
MB = $171.13
|
Most Recent Note - 2/20/2014 1:02:38 PM
Y - Recently wedging higher with gains lacking great volume conviction, now perched above its pivot point and below its "max buy" level. Found support above its 50 DMA line following a worrisome "negative reversal" on 2/05/14. Fundamentals remain strong after solid Dec '13 earnings.
>>> FEATURED STOCK ARTICLE : Stalled and Encountering Distributional Pressure - 2/12/2014
View all notes |
Set NEW NOTE alert |
CANSLIM.net Company Profile |
SEC
News |
Chart |
Request a new note
C
A N
S L
I M
|
Symbol/Exchange
Company Name
Industry Group |
PRICE |
CHANGE
(%Change) |
Day High |
Volume
(% DAV)
(% 50 day avg vol) |
52 Wk Hi
% From Hi |
Featured
Date |
Price
Featured |
Pivot Featured |
|
Max Buy |
VRX
-
NYSE
Valeant Pharmaceuticals
DRUGS - Drug Manufacturers - Other
|
$145.73
|
-0.53
-0.36% |
$148.37
|
1,544,178
110.77% of 50 DAV
50 DAV is 1,394,000
|
$148.73
-2.02%
|
9/11/2013
|
$100.26
|
PP = $105.50
|
|
MB = $110.78
|
Most Recent Note - 2/18/2014 12:50:12 PM
G - Hitting new all-time highs today with another considerable gain, getting more extended from any sound base. Its 50 DMA line ($125) defines near-term support to watch.
>>> FEATURED STOCK ARTICLE : Hovering Near All-Time Highs Extended From Sound Base - 2/10/2014
View all notes |
Set NEW NOTE alert |
CANSLIM.net Company Profile |
SEC
News |
Chart |
Request a new note
C
A N
S L
I M
|
|
|
|
THESE ARE NOT BUY RECOMMENDATIONS!
Comments contained in the body of this report are technical
opinions only. The material herein has been obtained
from sources believed to be reliable and accurate, however,
its accuracy and completeness cannot be guaranteed.
This site is not an investment advisor, hence it does
not endorse or recommend any securities or other investments.
Any recommendation contained in this report may not
be suitable for all investors and it is not to be deemed
an offer or solicitation on our part with respect to
the purchase or sale of any securities. All trademarks,
service marks and trade names appearing in this report
are the property of their respective owners, and are
likewise used for identification purposes only.
This report is a service available
only to active Paid Premium Members.
You may opt-out of receiving report notifications
at any time. Questions or comments may be submitted
by writing to Premium Membership Services 665 S.E. 10 Street, Suite 201 Deerfield Beach, FL 33441-5634 or by calling 1-800-965-8307
or 954-785-1121.
|
|
|

