***Last / Change / Volume data in this table is the closing quote data***
Symbol/Exchange
Company Name
Industry Group |
PRICE |
CHANGE
(%Change) |
Day High |
Volume
(% DAV)
(% 50 day avg vol) |
52 Wk Hi
% From Hi |
Featured
Date |
Price
Featured |
Pivot Featured |
|
Max Buy |
ADS
-
NYSE
Alliance Data Sys Corp
COMPUTER SOFTWARE and SERVICES - Information and Delivery Service
|
$119.97
|
+0.35
0.29% |
$120.21
|
421,111
58.90% of 50 DAV
50 DAV is 714,900
|
$122.62
-2.16%
|
1/17/2012
|
$108.24
|
PP = $107.43
|
|
MB = $112.80
|
Most Recent Note - 2/16/2012 11:18:48 AM
G - Pulling back today after a streak of 6 consecutive gains into new high territory. Its 50 DMA line defines support to watch on pullbacks while it is now extended from its latest base.
>>> The latest Featured Stock Update with an annotated graph appeared on 1/17/2012. Click here.
View all notes |
Alert me of new notes |
CANSLIM.net Company Profile |
SEC |
Zacks Reports |
StockTalk |
News |
Chart |
Request a new note
C
A N
S L
I M


|
ALXN
-
NASDAQ
Alexion Pharmaceuticals
DRUGS - Drug Manufacturers - Other
|
$81.81
|
+0.81
1.00% |
$82.50
|
1,175,536
96.93% of 50 DAV
50 DAV is 1,212,800
|
$85.48
-4.29%
|
11/30/2011
|
$68.66
|
PP = $70.52
|
|
MB = $74.05
|
Most Recent Note - 2/17/2012 5:44:08 PM
G - Pulled back today for a 4th consecutive loss on near average volume. After volume-driven gains for new all-time highs it is extended from its prior base. Support to watch is its 50 DMA line.
>>> The latest Featured Stock Update with an annotated graph appeared on 1/13/2012. Click here.
View all notes |
Alert me of new notes |
CANSLIM.net Company Profile |
SEC |
Zacks Reports |
StockTalk |
News |
Chart |
Request a new note
C
A N
S L
I M
|
BODY
-
NASDAQ
Body Central Corp
RETAIL - Catalog andamp; Mail Order Houses
|
$27.72
|
-0.44
-1.56% |
$28.35
|
238,883
142.96% of 50 DAV
50 DAV is 167,100
|
$28.93
-4.18%
|
1/27/2012
|
$26.69
|
PP = $25.46
|
|
MB = $26.73
|
Most Recent Note - 2/16/2012 11:23:36 AM
G - Up today for another new all-time high, getting more extended from its prior base. Prior highs in the $25-26 area recently acted as support after encountering some distributional pressure.
>>> The latest Featured Stock Update with an annotated graph appeared on 1/27/2012. Click here.
View all notes |
Alert me of new notes |
CANSLIM.net Company Profile |
SEC |
Zacks Reports |
StockTalk |
News |
Chart |
Request a new note
C
A N
S L
I M
|
CATM
-
NASDAQ
Cardtronics Inc
DIVERSIFIED SERVICES - Business/Management Services
|
$26.87
|
+0.27
1.02% |
$26.91
|
327,234
78.72% of 50 DAV
50 DAV is 415,700
|
$28.74
-6.51%
|
12/23/2011
|
$28.64
|
PP = $28.56
|
|
MB = $29.99
|
 Most Recent Note - 2/21/2012 1:48:29 PM
G - Still consolidating near its 50 DMA line since finding prompt support at its 200 DMA line. Its waning Relative Strength Rank (81) has slumped near the minimum 80+ guideline for buy candidates.
>>> The latest Featured Stock Update with an annotated graph appeared on 1/30/2012. Click here.
View all notes |
Alert me of new notes |
CANSLIM.net Company Profile |
SEC |
Zacks Reports |
StockTalk |
News |
Chart |
Request a new note
C
A N
S L
I M
|
CDNS
-
NASDAQ
Cadence Design Systems
COMPUTER SOFTWARE and SERVICES - Technical and System Software
|
$11.98
|
+0.04
0.34% |
$12.11
|
4,975,642
169.26% of 50 DAV
50 DAV is 2,939,600
|
$12.07
-0.75%
|
2/3/2012
|
$11.66
|
PP = $11.15
|
|
MB = $11.71
|
Most Recent Note - 2/21/2012 1:50:48 PM
G - Wedging to new 52-week highs with small gains above its "max buy" level. Recently making limited progress while no resistance remains due to overhead supply following strong technical action.
>>> The latest Featured Stock Update with an annotated graph appeared on 2/3/2012. Click here.
View all notes |
Alert me of new notes |
CANSLIM.net Company Profile |
SEC |
Zacks Reports |
StockTalk |
News |
Chart |
Request a new note
C
A N
S L
I M
|
Symbol/Exchange
Company Name
Industry Group |
PRICE |
CHANGE
(%Change) |
Day High |
Volume
(% DAV)
(% 50 day avg vol) |
52 Wk Hi
% From Hi |
Featured
Date |
Price
Featured |
Pivot Featured |
|
Max Buy |
CELG
-
NASDAQ
Celgene Corp
DRUGS - Drug Manufacturers - Major
|
$74.03
|
-0.63
-0.84% |
$75.03
|
3,049,180
90.25% of 50 DAV
50 DAV is 3,378,600
|
$76.09
-2.71%
|
2/2/2012
|
$74.16
|
PP = $75.21
|
|
MB = $78.97
|
Most Recent Note - 2/21/2012 1:52:48 PM
Y - Stalled and slumped below the pivot point after recently rising from an advanced "3-weeks tight" base pattern previously noted. Still perched within close striking distance of its all-time high ($77.39 in Aug '08). Its 50 DMA line defines initial support above its prior highs in the $68 area.
>>> The latest Featured Stock Update with an annotated graph appeared on 2/2/2012. Click here.
View all notes |
Alert me of new notes |
CANSLIM.net Company Profile |
SEC |
Zacks Reports |
StockTalk |
News |
Chart |
Request a new note
C
A N
S L
I M
|
FEIC
-
NASDAQ
F E I Co
ELECTRONICS - Diversified Electronics
|
$43.72
|
-1.06
-2.37% |
$45.46
|
290,728
105.45% of 50 DAV
50 DAV is 275,700
|
$48.31
-9.50%
|
12/7/2011
|
$41.41
|
PP = $42.35
|
|
MB = $44.47
|
Most Recent Note - 2/16/2012 5:30:14 PM
G - Consolidating above its 50 DMA line and prior highs in the $43 area defining important chart support. Reported earnings +21% on +14% sales revenues for the latest quarter ended December 31, 2011 versus the year ago period (below the +25% minimum guideline for earnings growth).
>>> The latest Featured Stock Update with an annotated graph appeared on 1/25/2012. Click here.
View all notes |
Alert me of new notes |
CANSLIM.net Company Profile |
SEC |
Zacks Reports |
StockTalk |
News |
Chart |
Request a new note
C
A N
S L
I M
|
GNC
-
NYSE
G N C Holdings Inc
RETAIL - Drug Stores
|
$32.75
|
+0.70
2.18% |
$33.10
|
1,109,854
104.80% of 50 DAV
50 DAV is 1,059,000
|
$33.70
-2.82%
|
1/19/2012
|
$28.99
|
PP = $29.60
|
|
MB = $31.08
|
Most Recent Note - 2/21/2012 1:36:13 PM
G - Reported earnings +106% on +17% sales revenues for the quarter ended Dec 31, 2011 versus the year ago period. Color code was changed to green after trading up above it "max buy" level. Prior highs in the $29.50 area define initial support to watch on pullbacks.
>>> The latest Featured Stock Update with an annotated graph appeared on 1/19/2012. Click here.
View all notes |
Alert me of new notes |
CANSLIM.net Company Profile |
SEC |
Zacks Reports |
StockTalk |
News |
Chart |
Request a new note
C
A N
S L
I M
|
GOLD
-
NASDAQ
Randgold Resources Adr
METALS and MINING - Gold
|
$113.06
|
+2.01
1.81% |
$113.39
|
369,740
71.86% of 50 DAV
50 DAV is 514,500
|
$120.73
-6.35%
|
2/7/2012
|
$116.21
|
PP = $120.83
|
|
MB = $126.87
|
Most Recent Note - 2/21/2012 1:55:28 PM
Y - Found support at its 50 DMA line as it formed a downward sloping "handle" with losses on light volume following the previously noted base pattern. Subsequent volume-driven gains into new high territory may trigger a technical buy signal.
>>> The latest Featured Stock Update with an annotated graph appeared on 2/8/2012. Click here.
View all notes |
Alert me of new notes |
CANSLIM.net Company Profile |
SEC |
Zacks Reports |
StockTalk |
News |
Chart |
Request a new note
C
A N
S L
I M
|
HMSY
-
NASDAQ
H M S Holdings Corp
COMPUTER SOFTWARE and SERVICES - Healthcare Information Service
|
$32.61
|
-0.45
-1.36% |
$32.94
|
1,225,607
133.04% of 50 DAV
50 DAV is 921,200
|
$34.98
-6.77%
|
10/27/2011
|
$26.44
|
PP = $28.37
|
|
MB = $29.79
|
Most Recent Note - 2/21/2012 1:56:58 PM
G - Reported earnings +29% on +14% sales revenues for the quarter ended Dec 31,2011 versus the year ago period. Down today, and further deterioration below its 50 DMA line would raise more serious concerns.
>>> The latest Featured Stock Update with an annotated graph appeared on 2/9/2012. Click here.
View all notes |
Alert me of new notes |
CANSLIM.net Company Profile |
SEC |
Zacks Reports |
StockTalk |
News |
Chart |
Request a new note
C
A N
S L
I M
|
Symbol/Exchange
Company Name
Industry Group |
PRICE |
CHANGE
(%Change) |
Day High |
Volume
(% DAV)
(% 50 day avg vol) |
52 Wk Hi
% From Hi |
Featured
Date |
Price
Featured |
Pivot Featured |
|
Max Buy |
ISRG
-
NASDAQ
Intuitive Surgical Inc
HEALTH SERVICES - Medical Appliances and Equipment
|
$504.91
|
-1.08
-0.21% |
$508.97
|
175,142
46.80% of 50 DAV
50 DAV is 374,200
|
$515.61
-2.08%
|
12/20/2011
|
$442.43
|
PP = $449.16
|
|
MB = $471.62
|
Most Recent Note - 2/21/2012 2:04:36 PM
G - Perched near its all-time high, stubbornly holding its ground extended from prior highs in the $475 area that define support to watch on pullbacks. Reported earnings +24% on +28% sales revenues for the quarter ended December 31, 2011 versus the year ago period.
>>> The latest Featured Stock Update with an annotated graph appeared on 1/18/2012. Click here.
View all notes |
Alert me of new notes |
CANSLIM.net Company Profile |
SEC |
Zacks Reports |
StockTalk |
News |
Chart |
Request a new note
C
A N
S L
I M
|
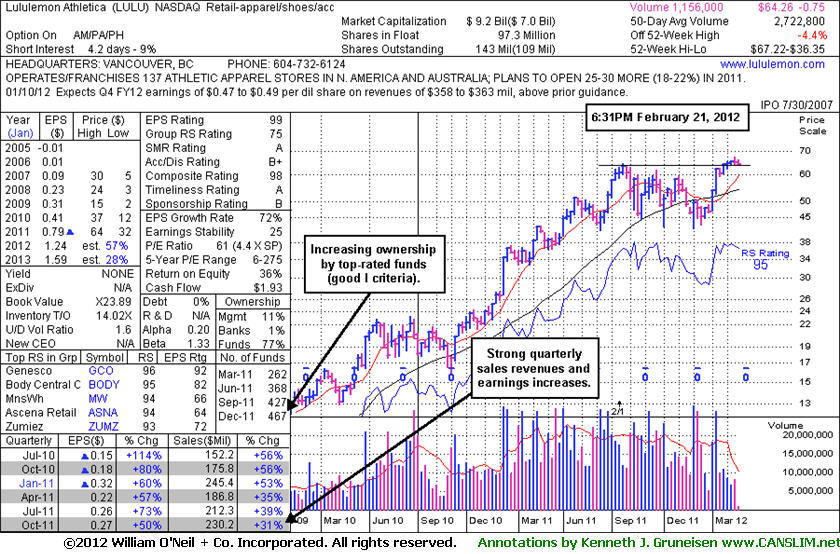
LULU
-
NASDAQ
Lululemon Athletica
MANUFACTURING - Textile Manufacturing
|
$64.26
|
-0.75
-1.15% |
$65.92
|
1,157,579
42.51% of 50 DAV
50 DAV is 2,722,800
|
$67.22
-4.40%
|
1/10/2012
|
$60.97
|
PP = $59.46
|
|
MB = $62.43
|
Most Recent Note - 2/21/2012 7:24:55 PM
G - Hovering near its all-time high, stubbornly holding its ground with cooling volume totals in recent weeks suggesting that very few are exiting. See the latest FSU analysis for more details and a new annotated weekly graph.
>>> The latest Featured Stock Update with an annotated graph appeared on 2/21/2012. Click here.
View all notes |
Alert me of new notes |
CANSLIM.net Company Profile |
SEC |
Zacks Reports |
StockTalk |
News |
Chart |
Request a new note
C
A N
S L
I M
|
MA
-
NYSE
Mastercard Inc Cl A
DIVERSIFIED SERVICES - Business/Management Services
|
$399.55
|
+3.55
0.90% |
$400.79
|
1,158,743
107.82% of 50 DAV
50 DAV is 1,074,700
|
$401.79
-0.56%
|
2/2/2012
|
$379.05
|
PP = $381.32
|
|
MB = $400.39
|
Most Recent Note - 2/17/2012 5:41:08 PM
Y - Quietly holding its ground perched at its all-time high after a streak of consecutive gains. Prior highs in the mid-$380 area define initial chart support to watch. See the latest FSU analysis for more details and a new annotated graph.
>>> The latest Featured Stock Update with an annotated graph appeared on 2/17/2012. Click here.
View all notes |
Alert me of new notes |
CANSLIM.net Company Profile |
SEC |
Zacks Reports |
StockTalk |
News |
Chart |
Request a new note
C
A N
S L
I M
|
MELI
-
NASDAQ
Mercadolibre Inc
INTERNET - Internet Software and; Services
|
$97.05
|
+0.89
0.93% |
$99.98
|
779,374
158.51% of 50 DAV
50 DAV is 491,700
|
$101.84
-4.70%
|
2/6/2012
|
$97.09
|
PP = $95.58
|
|
MB = $100.36
|
Most Recent Note - 2/16/2012 12:22:28 PM
Y - Reversed into the red today after early gains into new 52-week and all-time high territory. Its weakness has quickly erased the prior session's impressive gain backed by 2 times average volume.
>>> The latest Featured Stock Update with an annotated graph appeared on 2/6/2012. Click here.
View all notes |
Alert me of new notes |
CANSLIM.net Company Profile |
SEC |
Zacks Reports |
StockTalk |
News |
Chart |
Request a new note
C
A N
S L
I M
|
MKTX
-
NASDAQ
Marketaxess Holdings Inc
FINANCIAL SERVICES - Investment Brokerage - Nationa
|
$32.05
|
-0.27
-0.84% |
$32.43
|
111,223
60.81% of 50 DAV
50 DAV is 182,900
|
$35.42
-9.51%
|
10/28/2011
|
$29.79
|
PP = $31.05
|
|
MB = $32.60
|
Most Recent Note - 2/16/2012 5:31:44 PM
G - Up with lighter than average volume today. Prior highs in the $31-32 area recently acted as chart support when consolidating after volume-driven gains into new high territory.
>>> The latest Featured Stock Update with an annotated graph appeared on 1/24/2012. Click here.
View all notes |
Alert me of new notes |
CANSLIM.net Company Profile |
SEC |
Zacks Reports |
StockTalk |
News |
Chart |
Request a new note
C
A N
S L
I M
|
Symbol/Exchange
Company Name
Industry Group |
PRICE |
CHANGE
(%Change) |
Day High |
Volume
(% DAV)
(% 50 day avg vol) |
52 Wk Hi
% From Hi |
Featured
Date |
Price
Featured |
Pivot Featured |
|
Max Buy |
OSIS
-
NASDAQ
O S I Systems Inc
ELECTRONICS - Semiconductor Equipment and Mate
|
$52.73
|
-0.44
-0.83% |
$53.60
|
96,164
97.83% of 50 DAV
50 DAV is 98,300
|
$57.51
-8.31%
|
11/1/2011
|
$42.07
|
PP = $45.57
|
|
MB = $47.85
|
Most Recent Note - 2/15/2012 3:12:28 PM
G - Down today with slightly higher volume indicative of distributional pressure, slumping toward its 50 DMA line which defines important support to watch. Reported earnings +20% on +11% sales revenues for the Dec '11 quarter, which raised concerns as earnings growth was below the +25% minimum earnings guideline.
>>> The latest Featured Stock Update with an annotated graph appeared on 1/31/2012. Click here.
View all notes |
Alert me of new notes |
CANSLIM.net Company Profile |
SEC |
Zacks Reports |
StockTalk |
News |
Chart |
Request a new note
C
A N
S L
I M
|
RAX
-
NYSE
Rackspace Hosting Inc
INTERNET - Internet Software and; Services
|
$52.25
|
-0.68
-1.28% |
$53.33
|
2,214,708
112.94% of 50 DAV
50 DAV is 1,961,000
|
$56.94
-8.24%
|
2/2/2012
|
$46.69
|
PP = $45.55
|
|
MB = $47.83
|
Most Recent Note - 2/17/2012 12:58:46 PM
G - Consolidating following a considerable 2/14/12 gap up gain with very heavy volume following strong earnings news. Now it is too extended from the previous base to be considered an ideal buy candidate under the fact-based investment system's guidelines.
>>> The latest Featured Stock Update with an annotated graph appeared on 2/16/2012. Click here.
View all notes |
Alert me of new notes |
CANSLIM.net Company Profile |
SEC |
Zacks Reports |
StockTalk |
News |
Chart |
Request a new note
C
A N
S L
I M
|
RRTS
-
NYSE
Roadrunner Trans Systems
TRANSPORTATION - Air Delivery and Freight Service
|
$18.01
|
-0.19
-1.04% |
$18.36
|
71,051
52.94% of 50 DAV
50 DAV is 134,200
|
$18.44
-2.33%
|
2/10/2012
|
$17.40
|
PP = $17.50
|
|
MB = $18.38
|
Most Recent Note - 2/16/2012 12:29:31 PM
Y - Holding its ground today following a gap up gain with 3 times average volume on the prior session while surging to a new 52-week high near its "max buy" level. Prior highs in the $17 area define initial support to watch on pullbacks.
>>> The latest Featured Stock Update with an annotated graph appeared on 2/13/2012. Click here.
View all notes |
Alert me of new notes |
CANSLIM.net Company Profile |
SEC |
Zacks Reports |
StockTalk |
News |
Chart |
Request a new note
C
A N
S L
I M
|
SWI
-
NYSE
Solarwinds Inc
COMPUTER SOFTWARE and SERVICES - Application Software
|
$38.04
|
+0.81
2.18% |
$38.65
|
1,041,224
87.90% of 50 DAV
50 DAV is 1,184,500
|
$38.59
-1.43%
|
1/26/2012
|
$32.36
|
PP = $33.78
|
|
MB = $35.47
|
Most Recent Note - 2/21/2012 1:37:42 PM
G - Quietly touched a new all-time high today, and it is extended from its latest base. Reported earnings +21% on +34% sales revenues for the quarter ended December 31, 2011 versus the year ago period. Earnings below the +25% guideline raise fundamental concerns.
>>> The latest Featured Stock Update with an annotated graph appeared on 1/26/2012. Click here.
View all notes |
Alert me of new notes |
CANSLIM.net Company Profile |
SEC |
Zacks Reports |
StockTalk |
News |
Chart |
Request a new note
C
A N
S L
I M
|
SXCI
-
NASDAQ
S X C Health Solutions
COMPUTER SOFTWARE and SERVICES - Healthcare Information Service
|
$61.80
|
+1.45
2.40% |
$61.94
|
426,171
131.98% of 50 DAV
50 DAV is 322,900
|
$66.40
-6.93%
|
1/10/2012
|
$62.05
|
PP = $60.10
|
|
MB = $63.11
|
Most Recent Note - 2/21/2012 1:39:29 PM
G - Posting a gain today with volume picking up while finding support above prior highs in the $60 area and its 50 DMA line. Due to release its fiscal 2011 fourth quarter and year-end financial results before the open on Thursday, February 23, 2012.
>>> The latest Featured Stock Update with an annotated graph appeared on 1/20/2012. Click here.
View all notes |
Alert me of new notes |
CANSLIM.net Company Profile |
SEC |
Zacks Reports |
StockTalk |
News |
Chart |
Request a new note
C
A N
S L
I M
|
Symbol/Exchange
Company Name
Industry Group |
PRICE |
CHANGE
(%Change) |
Day High |
Volume
(% DAV)
(% 50 day avg vol) |
52 Wk Hi
% From Hi |
Featured
Date |
Price
Featured |
Pivot Featured |
|
Max Buy |
TDG
-
NYSE
Transdigm Group Inc
AEROSPACE/DEFENSE - Aerospace/Defense Products and; Services
|
$116.24
|
+0.30
0.26% |
$116.83
|
303,942
88.64% of 50 DAV
50 DAV is 342,900
|
$118.83
-2.18%
|
1/10/2012
|
$98.83
|
PP = $102.83
|
|
MB = $107.97
|
Most Recent Note - 2/21/2012 1:40:29 PM
G - Still hovering near its all-time high, stubbornly holding its ground, extended from its prior base after a spurt of volume-driven gains. Prior highs near $102 define the initial support level to watch above its 50 DMA line.
>>> The latest Featured Stock Update with an annotated graph appeared on 2/10/2012. Click here.
View all notes |
Alert me of new notes |
CANSLIM.net Company Profile |
SEC |
Zacks Reports |
StockTalk |
News |
Chart |
Request a new note
C
A N
S L
I M
|
TNGO
-
NASDAQ
Tangoe Inc
COMPUTER SOFTWARE and SERVICES - Technical and System Software
|
$17.74
|
+0.43
2.45% |
$18.29
|
715,912
262.82% of 50 DAV
50 DAV is 272,400
|
$18.48
-4.00%
|
2/13/2012
|
$15.39
|
PP = $16.51
|
|
MB = $17.34
|
Most Recent Note - 2/21/2012 1:28:15 PM
G - Gain today has it perched near its best-ever close. Found support near prior highs in the $16 area during the pullback following its technical breakout last week.
>>> The latest Featured Stock Update with an annotated graph appeared on 2/14/2012. Click here.
View all notes |
Alert me of new notes |
CANSLIM.net Company Profile |
SEC |
Zacks Reports |
StockTalk |
News |
Chart |
Request a new note
C
A N
S L
I M
|
TSCO
-
NASDAQ
Tractor Supply Co
SPECIALTY RETAIL - Specialty Retail, Other
|
$83.37
|
+0.61
0.74% |
$84.46
|
629,360
87.40% of 50 DAV
50 DAV is 720,100
|
$87.13
-4.32%
|
1/12/2012
|
$79.12
|
PP = $75.58
|
|
MB = $79.36
|
Most Recent Note - 2/21/2012 1:41:28 PM
G - Volume totals have still been cooling while stubbornly holding its ground near its all-time high. Reported earnings +43% on +20% sales revenues for the quarter ended December 31, 2011 versus the year ago period. Prior highs in the mid-$70s which were a resistance area now define initial support to watch on pullbacks.
>>> The latest Featured Stock Update with an annotated graph appeared on 1/12/2012. Click here.
View all notes |
Alert me of new notes |
CANSLIM.net Company Profile |
SEC |
Zacks Reports |
StockTalk |
News |
Chart |
Request a new note
C
A N
S L
I M
|
UA
-
NYSE
Under Armour Inc Cl A
CONSUMER NON-DURABLES - Textile - Apparel Clothing
|
$82.52
|
-2.35
-2.77% |
$84.58
|
625,190
49.27% of 50 DAV
50 DAV is 1,268,800
|
$87.40
-5.58%
|
2/15/2012
|
$85.77
|
PP = $84.86
|
|
MB = $89.10
|
Most Recent Note - 2/21/2012 1:43:32 PM
Y - Pulling back today on light volume, perched near its pivot point. Disciplined investors may watch for a gain above the pivot point with sufficient volume to trigger a proper technical buy signal. See the latest FSU analysis for more details and a new annotated graph.
>>> The latest Featured Stock Update with an annotated graph appeared on 2/15/2012. Click here.
View all notes |
Alert me of new notes |
CANSLIM.net Company Profile |
SEC |
Zacks Reports |
StockTalk |
News |
Chart |
Request a new note
C
A N
S L
I M
|
UBNT
-
NASDAQ
Ubiquiti Networks Inc
TELECOMMUNICATIONS - Diversified Communication Serv
|
$25.00
|
-0.01
-0.04% |
$25.50
|
281,479
101.69% of 50 DAV
50 DAV is 276,800
|
$27.23
-8.19%
|
1/27/2012
|
$22.25
|
PP = $23.14
|
|
MB = $24.30
|
Most Recent Note - 2/17/2012 10:57:50 AM
G - Small gap up today, and its color code is changed to green after rising back above its "max buy" level. Prior highs in the $23 area acted as support on pullbacks following its recent technical breakout.
>>> The latest Featured Stock Update with an annotated graph appeared on 2/1/2012. Click here.
View all notes |
Alert me of new notes |
CANSLIM.net Company Profile |
SEC |
Zacks Reports |
StockTalk |
News |
Chart |
Request a new note
C
A N
S L
I M
|
Symbol/Exchange
Company Name
Industry Group |
PRICE |
CHANGE
(%Change) |
Day High |
Volume
(% DAV)
(% 50 day avg vol) |
52 Wk Hi
% From Hi |
Featured
Date |
Price
Featured |
Pivot Featured |
|
Max Buy |
ULTA
-
NASDAQ
Ulta Salon Cosm & Frag
SPECIALTY RETAIL - Specialty Retail, Other
|
$82.06
|
-0.50
-0.61% |
$83.56
|
396,149
50.95% of 50 DAV
50 DAV is 777,500
|
$84.48
-2.86%
|
1/11/2012
|
$71.97
|
PP = $75.80
|
|
MB = $79.59
|
Most Recent Note - 2/16/2012 11:31:36 AM
G - Inching further into all-time high territory, it is extended from any sound base pattern. Prior highs near $75 define initial chart support above its 50 DMA line.
>>> The latest Featured Stock Update with an annotated graph appeared on 1/11/2012. Click here.
View all notes |
Alert me of new notes |
CANSLIM.net Company Profile |
SEC |
Zacks Reports |
StockTalk |
News |
Chart |
Request a new note
C
A N
S L
I M
|
V
-
NYSE
Visa Inc Cl A
DIVERSIFIED SERVICES - Business/Management Services
|
$114.20
|
-0.81
-0.70% |
$116.00
|
2,704,901
65.53% of 50 DAV
50 DAV is 4,127,800
|
$117.18
-2.54%
|
2/2/2012
|
$105.43
|
PP = $104.30
|
|
MB = $109.52
|
Most Recent Note - 2/14/2012 6:38:36 PM
G - Ended at a best-ever close today with a gain on average volume. Prior highs in the $103-104 area define initial support to watch on pullbacks.
>>> The latest Featured Stock Update with an annotated graph appeared on 1/23/2012. Click here.
View all notes |
Alert me of new notes |
CANSLIM.net Company Profile |
SEC |
Zacks Reports |
StockTalk |
News |
Chart |
Request a new note
C
A N
S L
I M
|