You are not logged in.
This means you
CAN ONLY VIEW reports that were published prior to Monday, February 26, 2024.
You
MUST UPGRADE YOUR MEMBERSHIP if you want to see any current reports.
AFTER MARKET UPDATE - WEDNESDAY, FEBRUARY 16TH, 2022
Previous After Market Report Next After Market Report >>>
|
|
|
|
DOW |
-54.57 |
34,934.27 |
-0.16% |
|
Volume |
889,881,653 |
-3% |
|
Volume |
4,141,096,800 |
-5% |
|
NASDAQ |
-15.66 |
14,124.09 |
-0.11% |
|
Advancers |
2,061 |
64% |
|
Advancers |
2,314 |
53% |
|
S&P 500 |
+3.94 |
4,475.01 |
+0.09% |
|
Decliners |
1,173 |
36% |
|
Decliners |
2,069 |
47% |
|
Russell 2000 |
+2.85 |
2,079.31 |
+0.14% |
|
52 Wk Highs |
63 |
|
|
52 Wk Highs |
48 |
|
|
S&P 600 |
+3.42 |
1,329.69 |
+0.26% |
|
52 Wk Lows |
157 |
|
|
52 Wk Lows |
243 |
|
|
Following the Monday, January 31st follow-through day in the market (M criteria) which confirmed a new uptrend the major averages have again come under noted pressure. New buying efforts may be made only in stocks fitting all key criteria of the fact-based investment system.
|
 |
Afternoon Rally Helped Indices Rebound From Early Lows
Kenneth J. Gruneisen - Passed the CAN SLIM® Master's Exam
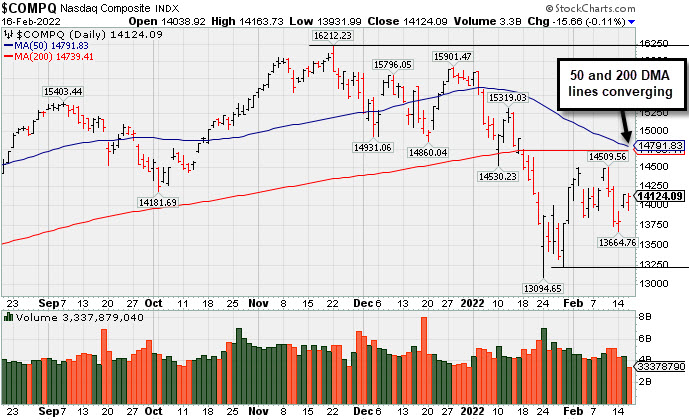
The Dow Jones Industrial Average lost 53 points (-0.16%) and the Nasdaq Composite Index fell 15.66 points (-0.11%), meanwhile the benchmark S&P 500 Index closed Wednesday's session 3.94 points higher (+0.09%). Volume totals reported were lighter than the prior session on the NYSE and on the Nasdaq exchange. Breadth was positive as advancers led decliners by nearly a 2-1 margin on the NYSE, but advancers led decliners by a much narrower margin on the Nasdaq exchange. There were 20 high-ranked companies from the Leaders List that hit new 52-week highs and were listed on the BreakOuts Page, versus 11 on the prior session. New 52-week lows totals still solidly outnumbered new highs totals on the NYSE and on the Nasdaq exchange. The market averages (M criteria) are in an uptrend under pressure. For any sustained rally there must be a healthy crop of stocks hitting new highs, so it remains critically important for leadership to improve. PICTURED: The Nasdaq Composite Index has been sputtering for weeks below its 50-day and 200-day moving average (DMA) lines which are now converging - technically termed a "death cross".
Nine of 11 S&P 500 sectors closed in positive territory, with growth-related groups lagging. In earnings, ViacomCBS Inc. (VIAC -17.81%) fell following a disappointing profit tally. The multimedia company also announced it would change its corporate name to Paramount Global to highlight its streaming service. Roblox Corporation (RBLX -26.51%) and Shopify Inc. (SHOP -16.04%) were standout decliners following their earnings reports and disappointing outlooks. Meanwhile, Generac Holdings Inc. (GNRC +14.36%) jumped after the generator maker delivered a top and bottom line beat and forecasted strong growth in 2022. Elsewhere, Kraft Heinz Co. (KHC +5.59%) rose on better-than-expected results, with product price increases helping offset higher input costs. Owens Corning (OC +9.16%) posted a large gain following earnings and sales which beat estimates.
U.S. stocks recovered from early weakness with an afternoon rally helping the major indices finish the day mixed and little changed following the release of the Federal Reserve’s January meeting minutes. On Tuesday, stocks snapped a three-day losing streak amid signs of de-escalating tensions in Ukraine. High-level diplomacy talks are reportedly ongoing, but claims from Russia that some military units have returned to their bases are under scrutiny today, with Western leaders unable to verify Moscow’s assertion. West Texas Intermediate crude slipped 1.2% to $90.95/barrel after data showed an unexpected weekly buildup in domestic stockpiles.
Treasuries strengthened, with the yield on the 10-year note down three basis points (0.03%) to 2.02%. The yield on the more Fed-sensitive two-year note declined six basis points (0.06%) to 1.51%, while a gauge of the U.S. dollar fell 0.2%. On the data front, retail sales climbed a better-than-expected 3.8% in January, the most in 10 months, rebounding from the prior downwardly revised 2.5% decline. Separately, both import and export prices rose during the period, while industrial production increased a stronger-than-anticipated 1.4%. Additionally, a measure of homebuilder sentiment eased in February.
|
 Kenneth J. Gruneisen started out as a licensed stockbroker in August 1987, a couple of months prior to the historic stock market crash that took the Dow Jones Industrial Average down -22.6% in a single day. He has published daily fact-based fundamental and technical analysis on high-ranked stocks online for two decades. Through FACTBASEDINVESTING.COM, Kenneth provides educational articles, news, market commentary, and other information regarding proven investment systems that work in good times and bad.
Comments contained in the body of this report are technical opinions only and are not necessarily those of Gruneisen Growth Corp. The material herein has been obtained from sources believed to be reliable and accurate, however, its accuracy and completeness cannot be guaranteed. Our firm, employees, and customers may effect transactions, including transactions contrary to any recommendation herein, or have positions in the securities mentioned herein or options with respect thereto. Any recommendation contained in this report may not be suitable for all investors and it is not to be deemed an offer or solicitation on our part with respect to the purchase or sale of any securities. |
|
 |
Commodity-Linked Groups Led Financial, Retail, and Tech Indexes
Kenneth J. Gruneisen - Passed the CAN SLIM® Master's Exam
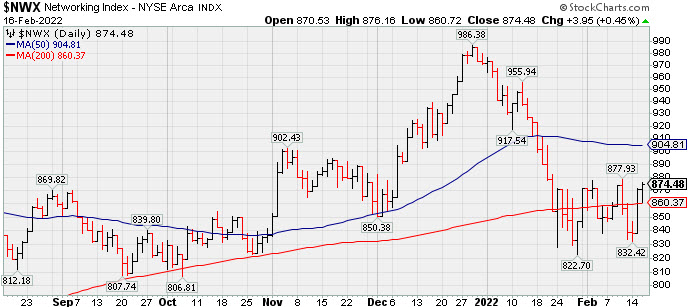
The Broker/Dealer Index ($XBD +0.28%), Bank Index ($BKX +0.25%), and Retail Index ($RLX +0.14%) each inched higher. Commodity-linked groups posted standout gains as the Gold & Silver Index ($XAU +2.78%) outpaced the Oil Services Index ($OSX +2.06%) and the Integrated Oil Index ($XOI +0.75%). The Networking Index ($NWX +0.45%) also edged higher while the Biotech Index ($BTK +0.16%) and Semiconductor Index ($SOX +0.03%) finished flat. PICTURED: The Networking Index ($NWX +0.45%) edged higher on Wednesday after a big gain and rebound above its 200-day moving average (DMA) line on the prior session.
| Oil Services |
$OSX |
69.15 |
+1.40 |
+2.06% |
+31.16% |
| Integrated Oil |
$XOI |
1,438.03 |
+10.77 |
+0.75% |
+22.05% |
| Semiconductor |
$SOX |
3,555.69 |
+1.23 |
+0.03% |
-9.89% |
| Networking |
$NWX |
874.43 |
+3.90 |
+0.45% |
-9.95% |
| Broker/Dealer |
$XBD |
506.19 |
+1.40 |
+0.28% |
+3.97% |
| Retail |
$RLX |
3,850.58 |
+5.50 |
+0.14% |
-8.89% |
| Gold & Silver |
$XAU |
139.50 |
+3.77 |
+2.78% |
+5.32% |
| Bank |
$BKX |
143.01 |
+0.35 |
+0.25% |
+8.16% |
| Biotech |
$BTK |
5,129.36 |
+8.30 |
+0.16% |
-7.05% |
|
|
|
 |
Featured Stocks
Kenneth J. Gruneisen - Passed the CAN SLIM® Master's Exam
|
|
|
Color Codes Explained :
Y - Better candidates highlighted by our
staff of experts.
G - Previously featured
in past reports as yellow but may no longer be buyable under the
guidelines.
***Last / Change / Volume data in this table is the closing quote data***
|
|
|
THESE ARE NOT BUY RECOMMENDATIONS!
Comments contained in the body of this report are technical
opinions only. The material herein has been obtained
from sources believed to be reliable and accurate, however,
its accuracy and completeness cannot be guaranteed.
This site is not an investment advisor, hence it does
not endorse or recommend any securities or other investments.
Any recommendation contained in this report may not
be suitable for all investors and it is not to be deemed
an offer or solicitation on our part with respect to
the purchase or sale of any securities. All trademarks,
service marks and trade names appearing in this report
are the property of their respective owners, and are
likewise used for identification purposes only.
This report is a service available
only to active Paid Premium Members.
You may opt-out of receiving report notifications
at any time. Questions or comments may be submitted
by writing to Premium Membership Services 665 S.E. 10 Street, Suite 201 Deerfield Beach, FL 33441-5634 or by calling 1-800-965-8307
or 954-785-1121.
|
|
|