You are not logged in.
This means you
CAN ONLY VIEW reports that were published prior to Monday, February 26, 2024.
You
MUST UPGRADE YOUR MEMBERSHIP if you want to see any current reports.
AFTER MARKET UPDATE - FRIDAY, FEBRUARY 11TH, 2022
Previous After Market Report Next After Market Report >>>
|
|
|
|
DOW |
-503.53 |
34,738.06 |
-1.43% |
|
Volume |
1,086,838,363 |
+6% |
|
Volume |
5,188,893,300 |
+1% |
|
NASDAQ |
-394.49 |
13,791.15 |
-2.78% |
|
Advancers |
910 |
29% |
|
Advancers |
1,347 |
31% |
|
S&P 500 |
-85.44 |
4,418.64 |
-1.90% |
|
Decliners |
2,255 |
71% |
|
Decliners |
3,000 |
69% |
|
Russell 2000 |
-21.02 |
2,030.15 |
-1.02% |
|
52 Wk Highs |
67 |
|
|
52 Wk Highs |
53 |
|
|
S&P 600 |
-2.83 |
1,301.19 |
-0.22% |
|
52 Wk Lows |
375 |
|
|
52 Wk Lows |
358 |
|
|
 |
Major Indices Were Hit Again With More Distributional Pressure
Kenneth J. Gruneisen - Passed the CAN SLIM® Master's Exam
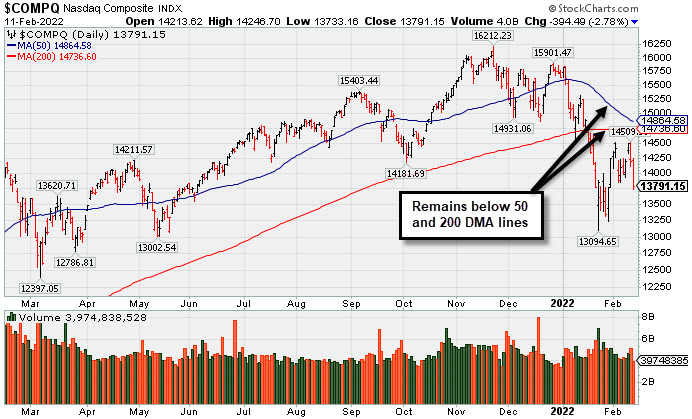
The Dow fell 503 points, capping a 1% weekly decline. The S&P 500 slumped 1.9% while the Nasdaq Composite retreated 2.8%. Both benchmarks turned negative for the week, sliding 1.8% and 2.2%, respectively. Volume totals reported were higher than the prior session on the NYSE and on the Nasdaq exchange, indicative of an increase in institutional selling pressure. Breadth was clearly negative as decliners led advancers by more than a 2-1 margin on the NYSE and on the Nasdaq exchange. There were 16 high-ranked companies from the Leaders List that hit new 52-week highs and were listed on the BreakOuts Page, versus 33 on the prior session. New 52-week lows totals expanded and solidly outnumbered shrinking new highs totals on the NYSE and on the Nasdaq exchange. A follow-through day on Monday, January 31st confirmed a new uptrend for the market averages (M criteria). PICTURED: The Nasdaq Composite Index remains below its 50-day and 200-day moving average (DMA) lines.
A sell-off in U.S. equities deepened on Friday amid escalating geopolitical tensions. Officials from both the U.S. and U.K. urged their citizens to exit Ukraine on reports of an imminent Russian invasion. Meanwhile, uncertainty surrounding the path of interest rate hikes by the Federal Reserve (Fed) also continued to weigh on investor sentiment. In commodities, West Texas Intermediate crude surged 4.3% to $93.78/barrel, capping an eighth consecutive weekly advance, its longest winning streak since October.
Perceived safe-haven assets caught a bid amid the apparent risk off tone, with the U.S. dollar rising 0.5%. Treasuries also rallied, with the yield on the 10-year note down 13 basis points (0.13%) to 1.92%, nearly erasing its weekly rout. The two-year note yield fell back below 1.50%, though the more Fed-sensitive rate remained 18 basis points (0.18%) higher compared to a week ago.
Thursday's report showed the Consumer Price Index (CPI) climbed at a 7.5% annual pace in January, marking the highest reading since February 1982. The update stoked expectations for aggressive monetary policy tightening. On the data front Friday, a preliminary February reading from the University of Michigan revealed consumer sentiment deteriorating to its lowest level since October 2011.
Nine of 11 S&P 500 sectors closed in negative territory, with Technology shares leading the decline. The Energy group outperformed amid the spike in oil prices, while the more traditionally defensive Utilities sector eked out a modest gain. |
 Kenneth J. Gruneisen started out as a licensed stockbroker in August 1987, a couple of months prior to the historic stock market crash that took the Dow Jones Industrial Average down -22.6% in a single day. He has published daily fact-based fundamental and technical analysis on high-ranked stocks online for two decades. Through FACTBASEDINVESTING.COM, Kenneth provides educational articles, news, market commentary, and other information regarding proven investment systems that work in good times and bad.
Comments contained in the body of this report are technical opinions only and are not necessarily those of Gruneisen Growth Corp. The material herein has been obtained from sources believed to be reliable and accurate, however, its accuracy and completeness cannot be guaranteed. Our firm, employees, and customers may effect transactions, including transactions contrary to any recommendation herein, or have positions in the securities mentioned herein or options with respect thereto. Any recommendation contained in this report may not be suitable for all investors and it is not to be deemed an offer or solicitation on our part with respect to the purchase or sale of any securities. |
|
 |
Commodity-Linked Groups Rose; Tech, Retail, and Financials Fell
Kenneth J. Gruneisen - Passed the CAN SLIM® Master's Exam
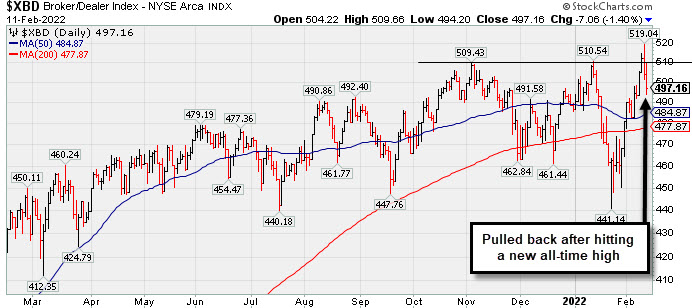
Commodity-linked groups were standout gainers with a positive bias on Friday as the Gold & Silver Index ($XAU +5.22%) outpaced the Oil Services Index ($OSX +3.83%) and the Integrated Oil Index ($XOI +2.92%). The Retail Index ($RLX -2.49%) fell and financials created a drag as the Bank Index ($BKX -1.38%) and Broker/Dealer Index ($XBD -1.40%) both lost ground. The Semiconductor Index ($SOX -4.83%) led the tech sector lower, the Networking Index ($NWX -2.01%) also slumped, and the Biotech Index ($BTK -0.62%) edged lower. PICTURED: The Broker/Dealer Index ($XBD -1.40%) pulled back on Thursday and Friday after hitting a new all-time high this week.
| Oil Services |
$OSX |
68.90 |
+2.54 |
+3.83% |
+30.68% |
| Integrated Oil |
$XOI |
1,489.13 |
+42.22 |
+2.92% |
+26.39% |
| Semiconductor |
$SOX |
3,365.25 |
-170.86 |
-4.83% |
-14.72% |
| Networking |
$NWX |
838.80 |
-17.20 |
-2.01% |
-13.62% |
| Broker/Dealer |
$XBD |
497.16 |
-7.06 |
-1.40% |
+2.12% |
| Retail |
$RLX |
3,789.94 |
-96.67 |
-2.49% |
-10.33% |
| Gold & Silver |
$XAU |
134.93 |
+6.69 |
+5.22% |
+1.87% |
| Bank |
$BKX |
141.47 |
-1.97 |
-1.38% |
+6.99% |
| Biotech |
$BTK |
5,111.76 |
-32.02 |
-0.62% |
-7.37% |
|
|
|
 |
Featured Stocks
Kenneth J. Gruneisen - Passed the CAN SLIM® Master's Exam
|
|
|
Color Codes Explained :
Y - Better candidates highlighted by our
staff of experts.
G - Previously featured
in past reports as yellow but may no longer be buyable under the
guidelines.
***Last / Change / Volume data in this table is the closing quote data***
Symbol/Exchange
Company Name
Industry Group |
PRICE |
CHANGE
(%Change) |
Day High |
Volume
(% DAV)
(% 50 day avg vol) |
52 Wk Hi
% From Hi |
Featured
Date |
Price
Featured |
Pivot Featured |
|
Max Buy |
 REGN
-
NASDAQ
REGN
-
NASDAQ
Regeneron Pharmaceutical
DRUGS - Biotechnology
|
$638.41
|
+20.19
3.27% |
$645.00
|
1,108,689
140.70% of 50 DAV
50 DAV is 788,000
|
$686.62
-7.02%
|
12/13/2021
|
$647.95
|
PP = $686.72
|
|
MB = $721.06
|
 Most Recent Note - 2/11/2022 5:04:11 PM
G - Posted a solid gain today with above average volume and rebounded above its 50 DMA line ($625.82) helping its outlook to improve. Still faces some resistance due to overhead supply up to the $686 level. Reported Dec '21 quarterly earnings +149% on +104% sales revenues versus the year ago period. Prior lows and its 200 DMA line ($595) define the important near-term support.
>>> FEATURED STOCK ARTICLE : Earnings News Due While Consolidating Above 200 DMA Line - 2/1/2022 |
View all notes |
Set NEW NOTE alert |
Company Profile |
SEC
News |
Chart |
Request a new note
C
A
S
I |
SF
-
NYSE
Stifel Financial Corp
FINANCIAL SERVICES - Investment Brokerage - Regiona
|
$78.41
|
-1.74
-2.17% |
$81.28
|
918,789
156.26% of 50 DAV
50 DAV is 588,000
|
$83.28
-5.85%
|
1/27/2022
|
$74.17
|
PP = $76.23
|
|
MB = $80.04
|
Most Recent Note - 2/11/2022 5:07:01 PM
Y - Pulled back today for a 3rd consecutive volume-driven loss after a "negative reversal" at its 52-week high. Color code is changed to yellow after pulling back below its "max buy" level. Prior highs in the $76-78 area define initial support to watch on pullbacks after rallying from the previously noted "double bottom" base.
>>> FEATURED STOCK ARTICLE : Formed Double Bottom Base and Faces Little Resistance - 1/27/2022 |
View all notes |
Set NEW NOTE alert |
Company Profile |
SEC
News |
Chart |
Request a new note
C
A
S
I |
TGH
-
NYSE
Textainer Group Holdings
TRANSPORTATION - Logistics
|
$39.06
|
-2.51
-6.04% |
$40.71
|
1,576,597
420.43% of 50 DAV
50 DAV is 375,000
|
$41.89
-6.76%
|
1/31/2022
|
$36.68
|
PP = $41.34
|
|
MB = $43.41
|
Most Recent Note - 2/11/2022 5:07:47 PM
Y - Pulled back today for a big loss on heavy volume after it reported Dec '21 quarterly earnings +80% on +23% sales revenues versus the year ago period. Volume and volatility often increase near earnings news. Hit a new 52-week high on the prior session as a gain backed by +85% above average volume and strong close above the pivot point triggered a technical buy signal. Found support at its 50 DMA line ($36.64) while recently consolidating.
>>> FEATURED STOCK ARTICLE : Consolidating Above 50-Day Moving Average - 1/31/2022 |
View all notes |
Set NEW NOTE alert |
Company Profile |
SEC
News |
Chart |
Request a new note
C
A
S
I |
HWKN
-
NASDAQ
Hawkins Inc
CHEMICALS - Basic Chemicals
|
$40.11
|
+0.46
1.16% |
$40.87
|
52,550
97.31% of 50 DAV
50 DAV is 54,000
|
$41.94
-4.36%
|
2/3/2022
|
$39.81
|
PP = $41.07
|
|
MB = $43.12
|
Most Recent Note - 2/11/2022 5:01:09 PM
Y - Consolidating with lighter volume after a solid volume-driven gain for a new all-time high on 2/08/22 clinched a technical buy signal. It was highlighted in yellow with pivot point cited based on its 1/04/22 high plus 10 cents in the 2/03/22 mid-day report following a gap up, rebounding above its 50 DMA line ($38.32).
>>> FEATURED STOCK ARTICLE : Bullish Action Followed Another Strong Quarterly Report - 2/3/2022 |
View all notes |
Set NEW NOTE alert |
Company Profile |
SEC
News |
Chart |
Request a new note
C
A
S
I |
|
|
|
THESE ARE NOT BUY RECOMMENDATIONS!
Comments contained in the body of this report are technical
opinions only. The material herein has been obtained
from sources believed to be reliable and accurate, however,
its accuracy and completeness cannot be guaranteed.
This site is not an investment advisor, hence it does
not endorse or recommend any securities or other investments.
Any recommendation contained in this report may not
be suitable for all investors and it is not to be deemed
an offer or solicitation on our part with respect to
the purchase or sale of any securities. All trademarks,
service marks and trade names appearing in this report
are the property of their respective owners, and are
likewise used for identification purposes only.
This report is a service available
only to active Paid Premium Members.
You may opt-out of receiving report notifications
at any time. Questions or comments may be submitted
by writing to Premium Membership Services 665 S.E. 10 Street, Suite 201 Deerfield Beach, FL 33441-5634 or by calling 1-800-965-8307
or 954-785-1121.
|
|
|