You are not logged in.
This means you
CAN ONLY VIEW reports that were published prior to Tuesday, April 8, 2025.
You
MUST UPGRADE YOUR MEMBERSHIP if you want to see any current reports.
AFTER MARKET UPDATE - MONDAY, FEBRUARY 14TH, 2022
Previous After Market Report Next After Market Report >>>
|
|
|
|
DOW |
-171.89 |
34,566.17 |
-0.49% |
|
Volume |
1,038,841,294 |
-4% |
|
Volume |
4,302,546,600 |
-17% |
|
NASDAQ |
-0.24 |
13,790.92 |
-0.00% |
|
Advancers |
908 |
28% |
|
Advancers |
1,511 |
33% |
|
S&P 500 |
-16.97 |
4,401.67 |
-0.38% |
|
Decliners |
2,285 |
72% |
|
Decliners |
3,007 |
67% |
|
Russell 2000 |
-9.36 |
2,020.79 |
-0.46% |
|
52 Wk Highs |
24 |
|
|
52 Wk Highs |
38 |
|
|
S&P 600 |
-4.60 |
1,296.59 |
-0.35% |
|
52 Wk Lows |
486 |
|
|
52 Wk Lows |
401 |
|
|
Following the Monday, January 31st follow-through day in the market (M criteria) which confirmed a new uptrend the major averages have again come under noted pressure. New buying efforts may be made only in stocks fitting all key criteria of the fact-based investment system.
|
 |
Leadership Waned and Major Indices Fell
Kenneth J. Gruneisen - Passed the CAN SLIM® Master's Exam
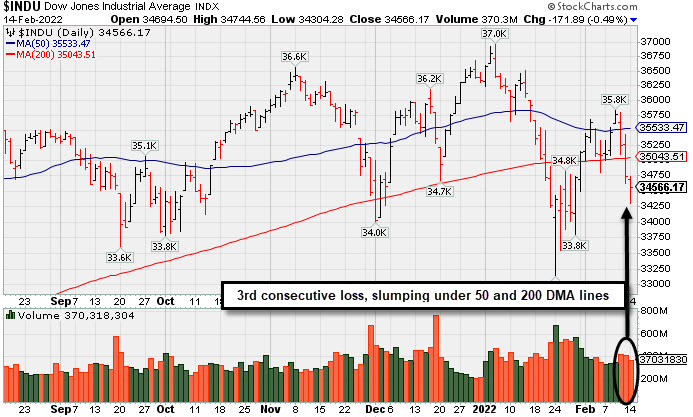
The Dow lost 171 points, while the S&P 500 slipped 0.4%. The Nasdaq Composite ended just below the flat line. Volume totals reported were lighter than the prior session on the NYSE and on the Nasdaq exchange, indicative of less institutional selling pressure. Breadth was clearly negative as decliners led advancers by a 2-1 margin on the NYSE and on the Nasdaq exchange. There were 6 high-ranked companies from the Leaders List that hit new 52-week highs and were listed on the BreakOuts Page, versus 16 on the prior session. New 52-week lows totals expanded and solidly outnumbered shrinking new highs totals on the NYSE and on the Nasdaq exchange. A new uptrend for the market averages (M criteria) has already come under pressure while leadership has waned. PICTURED: The Dow Jones Industrial Average suffered a 3rd consecutive loss while slumping below its 50-day and 200-day moving average (DMA) lines.
U.S. stocks finished lower for a third consecutive session on Monday as investors weighed lingering geopolitical tensions, ongoing inflationary pressures, and concerns over the Federal Reserve’s (Fed) policy pivot. Investors have been closely monitoring diplomacy talks between Russia, Europe, and the United States. Reports indicated that Russian President Vladimir Putin agreed to continue engaging in discussions with Western leaders, who are aiming to prevent a war in Ukraine. Still, the U.S. relocated its embassy away from Kyiv as Secretary of State Antony Blinken cited a “dramatic acceleration in the buildup of Russian forces.” West Texas Intermediate crude climbed 2% to $94.98/barrel, a fresh seven-year peak, on supply worries. Perceived safe haven assets caught a bid amid the cautious tone, with the U.S. dollar up 0.3%, while COMEX gold hit a three-month high, advancing 1.5% to $1,867.50/ounce.
Additionally, uncertainty surrounding the path of Fed rate hikes remains a market overhang. This morning, St. Louis Fed President James Bullard reiterated his view that policymakers should react to the highest inflation reading in 40 years by moving more swiftly than previously planned to remove accommodative monetary stimulus. Treasuries resumed their rout, with the yield on the 10-year note up eight basis points (0.08%) to 2.00%.
Nine of 11 S&P 500 sectors closed in negative territory, with Energy shares leading the downturn despite rising oil prices. In corporate news, Splunk Inc. (SPLK +9.15%) rose on reports that Cisco Systems Inc. (CSCO -1.35%) bid over $20 billion to acquire the cloud software company. |
 Kenneth J. Gruneisen started out as a licensed stockbroker in August 1987, a couple of months prior to the historic stock market crash that took the Dow Jones Industrial Average down -22.6% in a single day. He has published daily fact-based fundamental and technical analysis on high-ranked stocks online for two decades. Through FACTBASEDINVESTING.COM, Kenneth provides educational articles, news, market commentary, and other information regarding proven investment systems that work in good times and bad.
Comments contained in the body of this report are technical opinions only and are not necessarily those of Gruneisen Growth Corp. The material herein has been obtained from sources believed to be reliable and accurate, however, its accuracy and completeness cannot be guaranteed. Our firm, employees, and customers may effect transactions, including transactions contrary to any recommendation herein, or have positions in the securities mentioned herein or options with respect thereto. Any recommendation contained in this report may not be suitable for all investors and it is not to be deemed an offer or solicitation on our part with respect to the purchase or sale of any securities. |
|
 |
Financial, Biotech, and Energy-Linked Groups Led Decliners
Kenneth J. Gruneisen - Passed the CAN SLIM® Master's Exam
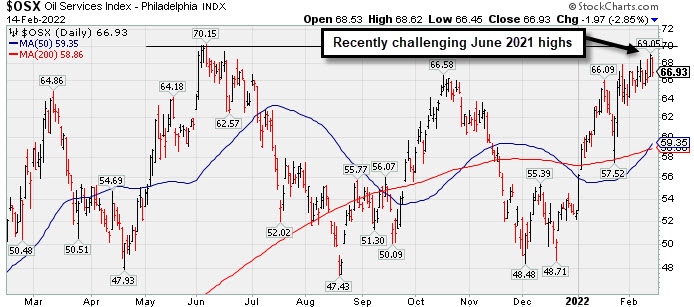
The Broker/Dealer Index ($XBD -0.80%) and Bank Index ($BKX -1.02%) suffered small losses that created a drag on the major indices while the Retail Index ($RLX +0.58%) helped offset the pressure with a modest gain. The Biotech Index ($BTK -1.74%) led the tech sector retreat while the Networking Index ($NWX -0.08%) and Semiconductor Index ($SOX +0.15%) both were little changed. Commodity-linked groups were mixed as the Oil Services Index ($OSX -2.85%) and Integrated Oil Index ($XOI -2.26%) both fell while the Gold & Silver Index ($XAU +1.66%) notched a standout gain. PICTURED: The Oil Services Index ($OSX -2.85%) pulled back on Monday after recently challenging its June 2021 high.
| Oil Services |
$OSX |
66.93 |
-1.97 |
-2.85% |
+26.95% |
| Integrated Oil |
$XOI |
1,455.53 |
-33.60 |
-2.26% |
+23.54% |
| Semiconductor |
$SOX |
3,370.20 |
+4.95 |
+0.15% |
-14.60% |
| Networking |
$NWX |
838.11 |
-0.69 |
-0.08% |
-13.69% |
| Broker/Dealer |
$XBD |
493.20 |
-3.96 |
-0.80% |
+1.30% |
| Retail |
$RLX |
3,811.87 |
+21.93 |
+0.58% |
-9.81% |
| Gold & Silver |
$XAU |
137.16 |
+2.24 |
+1.66% |
+3.56% |
| Bank |
$BKX |
140.02 |
-1.44 |
-1.02% |
+5.90% |
| Biotech |
$BTK |
5,022.76 |
-89.00 |
-1.74% |
-8.98% |
|
|
|
 |
Fourth Loss Following "Negative Reversal" at All-Time High
Kenneth J. Gruneisen - Passed the CAN SLIM® Master's Exam
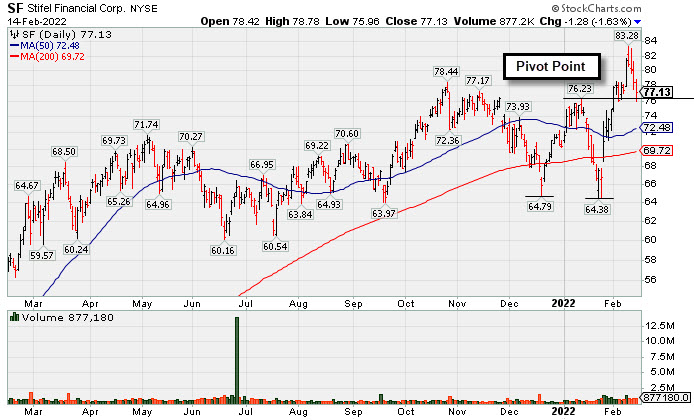
Stifel Financial Corp (SF -$1.28 or -1.63% to $77.13) pulled back today for a 4th consecutive volume-driven loss after a "negative reversal" at its 52-week high. Its color code was changed to yellow after pulling back below its "max buy" level. Prior highs in the $76-78 area define initial support to watch above its 50-day moving average (DMA) line ($72.48).
SF was highlighted in yellow with pivot point cited based on its 1/12/22 high in the 1/27/22 mid-day report (read here) while building on a "double bottom" base. It was shown in greater detail that evening with an annotated graph under the headline, "Formed Double Bottom Base and Faces Little Resistance". Since then a noted follow-through day in the market (M criteria) to confirm a new uptrend and subsequent gains above the stock's pivot point backed by at least +40% above average volume triggered a technical buy signal.
It has a 98 Earnings Per Share Rating, well above the 80+ minimum guideline for buy candidates. It reported strong results above the +25% minimum guideline (C criteria). in the past 5 quarterly comparisons through Dec '21 versus the year ago period. Annual earnings (A criteria) history has been good.
It hails from the FINANCIAL SERVICES - Investment Brokerage - Regional industry group which is currently ranked 43rd on the 197 Industry Groups list. There are 104.3 million shares outstanding (S criteria). The number of top-rated funds owning its shares rose from 601 in Mar '21 to 623 in Dec '21. Its current Up/Down Volume Ratio of 1.1 is an unbiased indication its shares have been under slight accumulation over the past 50 days. It has a Timeliness Rating of A and Sponsorship Rating of C. |
|
|
Color Codes Explained :
Y - Better candidates highlighted by our
staff of experts.
G - Previously featured
in past reports as yellow but may no longer be buyable under the
guidelines.
***Last / Change / Volume data in this table is the closing quote data***
|
|
|
THESE ARE NOT BUY RECOMMENDATIONS!
Comments contained in the body of this report are technical
opinions only. The material herein has been obtained
from sources believed to be reliable and accurate, however,
its accuracy and completeness cannot be guaranteed.
This site is not an investment advisor, hence it does
not endorse or recommend any securities or other investments.
Any recommendation contained in this report may not
be suitable for all investors and it is not to be deemed
an offer or solicitation on our part with respect to
the purchase or sale of any securities. All trademarks,
service marks and trade names appearing in this report
are the property of their respective owners, and are
likewise used for identification purposes only.
This report is a service available
only to active Paid Premium Members.
You may opt-out of receiving report notifications
at any time. Questions or comments may be submitted
by writing to Premium Membership Services 665 S.E. 10 Street, Suite 201 Deerfield Beach, FL 33441-5634 or by calling 1-800-965-8307
or 954-785-1121.
|
|
|