You are not logged in.
This means you
CAN ONLY VIEW reports that were published prior to Monday, April 14, 2025.
You
MUST UPGRADE YOUR MEMBERSHIP if you want to see any current reports.
AFTER MARKET UPDATE - MONDAY, FEBRUARY 11TH, 2013
Previous After Market Report Next After Market Report >>>
|
|
|
|
DOW |
-21.73 |
13,971.24 |
-0.16% |
|
Volume |
496,965,470 |
-14% |
|
Volume |
1,511,639,510 |
-14% |
|
NASDAQ |
-1.87 |
3,192.00 |
-0.06% |
|
Advancers |
1,345 |
43% |
|
Advancers |
1,202 |
47% |
|
S&P 500 |
-0.92 |
1,517.01 |
-0.06% |
|
Decliners |
1,641 |
53% |
|
Decliners |
1,255 |
49% |
|
Russell 2000 |
-0.64 |
913.03 |
-0.07% |
|
52 Wk Highs |
210 |
|
|
52 Wk Highs |
148 |
|
|
S&P 600 |
-0.55 |
511.69 |
-0.11% |
|
52 Wk Lows |
12 |
|
|
52 Wk Lows |
18 |
|
|
 |
Major Averages Edged Lower on Lighter Volume
Kenneth J. Gruneisen - Passed the CAN SLIM® Master's Exam
The major averages edged lower on Monday's quiet session. The volume totals were reported lighter on the NYSE and on the Nasdaq exchange, indicating no great conviction from the institutional crowd. Breadth was slightly negative as decliners led advancers by an 8-7 margin on the NYSE and an even closer margin on the Nasdaq exchange. The total number of stocks hitting new 52-week highs easily outnumbered new 52-week lows on the NYSE and on the Nasdaq exchange. There were 60 high-ranked companies from the CANSLIM.net Leaders List making new 52-week highs and appearing on the CANSLIM.net BreakOuts Page, down from the prior session total of 103 stocks. There were gains for 4 of the 13 high-ranked companies currently included on the Featured Stocks Page.
The major averages traded lower throughout the session as investors took a breather from a six-week long rally. Six of the 10 sectors on the S&P finished with losses. Energy and material stocks paced decliners with Schlumberger Ltd (SLB -1.44%) and Freeport-McMoRan Copper & Gold Inc (FCX -0.87%) falling. On the earnings front, Lowes Corp (L -0.78%) edged lower after the insurer posted their fourth-quarter profit tally. In other news, Apple Inc (AAPL +1.04%) gained on rumors that the company was testing a new watch-like device. Also in tech, Google Inc (GOOG -0.38%) fell on news its executive chairman is selling about 42% of his stake in the company.
Turning to fixed income markets, Treasuries ended relatively unchanged along the curve. The benchmark 10-year note was flat to yield 1.96% and the 30-year bond added 1/32 to yield 3.17%.
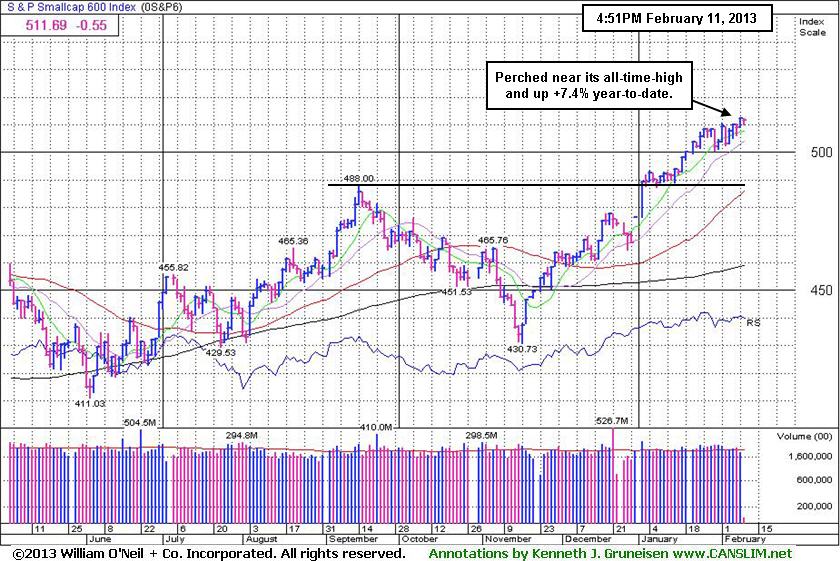
The latest rally has produced a few action worthy candidates meeting all of the fact-based investment system's criteria. Selectivity and discipline are required, as always. Investors may consider new buying efforts in stocks meeting all key criteria, as the market's (M criteria) confirmed uptrend has been comprised by great leadership (stocks hitting new 52-week highs) in the broader market. Widespread gains helped all of the major averages blast higher, and the benchmark S&P 500 Index is perched at its best level in more than five years and off its October 2007 all-time high.
Watch for an announcement via email concerning the next WEBCAST. The webcast will also be available via an updated link highlighted at the top of the Premium Member Homepage.
PICTURED: The S&P Small Cap 600 Index is perched near its all-time high and is up +7.4% year-to-date after steadily rallying from its November 2012 lows.
|
 Kenneth J. Gruneisen started out as a licensed stockbroker in August 1987, a couple of months prior to the historic stock market crash that took the Dow Jones Industrial Average down -22.6% in a single day. He has published daily fact-based fundamental and technical analysis on high-ranked stocks online for two decades. Through FACTBASEDINVESTING.COM, Kenneth provides educational articles, news, market commentary, and other information regarding proven investment systems that work in good times and bad.
Comments contained in the body of this report are technical opinions only and are not necessarily those of Gruneisen Growth Corp. The material herein has been obtained from sources believed to be reliable and accurate, however, its accuracy and completeness cannot be guaranteed. Our firm, employees, and customers may effect transactions, including transactions contrary to any recommendation herein, or have positions in the securities mentioned herein or options with respect thereto. Any recommendation contained in this report may not be suitable for all investors and it is not to be deemed an offer or solicitation on our part with respect to the purchase or sale of any securities. |
|
 |
Financial Groups Rose While Defensive Groups Lagged
Kenneth J. Gruneisen - Passed the CAN SLIM® Master's Exam
Defensive groups including the Gold & Silver Index ($XAU -2.04%) and the Healthcare Index ($HMO -1.57%) were clearly laggards on Monday. Weakness in energy-related shares pushed the Oil Services Index ($OSX -1.17%) and Integrated Oil Index ($XOI -0.53%) lower. The Semiconductor Index ($SOX +0.10%) held its ground while the Networking Index ($NWX -0.42%), Biotechnology Index ($BTK -0.71%), and Internet Index ($IIX -0.63%) each ended with a small loss. The Retail Index ($RLX -0.56%) also created a drag on the major averages while a positive bias in the financial group helped the Bank Index ($BKX +0.24%) and Broker/Dealer Index ($XBD +0.37%) post modest gains.
Charts courtesy www.stockcharts.com
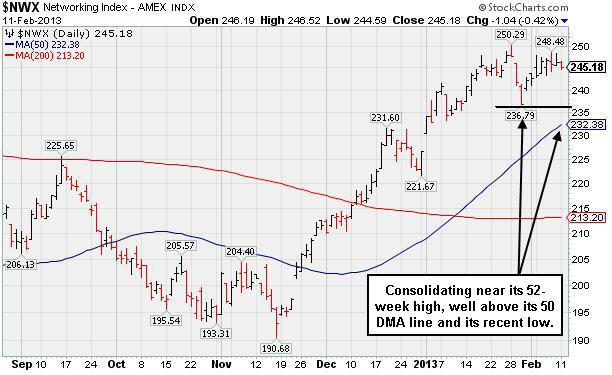
PICTURED: The Networking Index ($NWX -0.42%) is consolidating near its 52-week high, well above its 50-day moving average (DMA) line and recent low defining near-term support.
| Oil Services |
$OSX |
245.69 |
-2.92 |
-1.17% |
+11.60% |
| Healthcare |
$HMO |
2,775.69 |
-44.20 |
-1.57% |
+10.40% |
| Integrated Oil |
$XOI |
1,347.60 |
-7.22 |
-0.53% |
+8.52% |
| Semiconductor |
$SOX |
425.24 |
+0.43 |
+0.10% |
+10.72% |
| Networking |
$NWX |
245.18 |
-1.04 |
-0.42% |
+8.22% |
| Internet |
$IIX |
356.05 |
-2.25 |
-0.63% |
+8.88% |
| Broker/Dealer |
$XBD |
107.34 |
+0.39 |
+0.37% |
+13.79% |
| Retail |
$RLX |
700.44 |
-3.91 |
-0.56% |
+7.26% |
| Gold & Silver |
$XAU |
149.32 |
-3.11 |
-2.04% |
-9.83% |
| Bank |
$BKX |
55.13 |
+0.13 |
+0.24% |
+7.51% |
| Biotech |
$BTK |
1,678.12 |
-11.99 |
-0.71% |
+8.47% |
|
|
|
 |
Forming Base While Enduring Distributional Pressure Above 50-Day Moving Average
Kenneth J. Gruneisen - Passed the CAN SLIM® Master's Exam
Often, when a leading stock is setting up to breakout of a solid base it is highlighted in CANSLIM.net's Mid-Day Breakouts Report. The most relevant factors are noted in the report which alerts prudent CANSLIM oriented investors to place the issue in their watch list. After doing any necessary backup research, the investor is prepared to act after the stock triggers a technical buy signal (breaks above its pivot point on more than +50% average turnover) but before it gets too extended from a sound base. In the event the stock fails to trigger a technical buy signal and its price declines then it will simply be removed from the watch list. Disciplined investors know to buy as near as possible to the pivot point and avoid chasing stocks after they have rallied more than +5% above their pivot point. It is crucial to always limit losses whenever any stock heads the wrong direction, and disciplined investors sell if a struggling stock ever falls more than -7% from their purchase price.
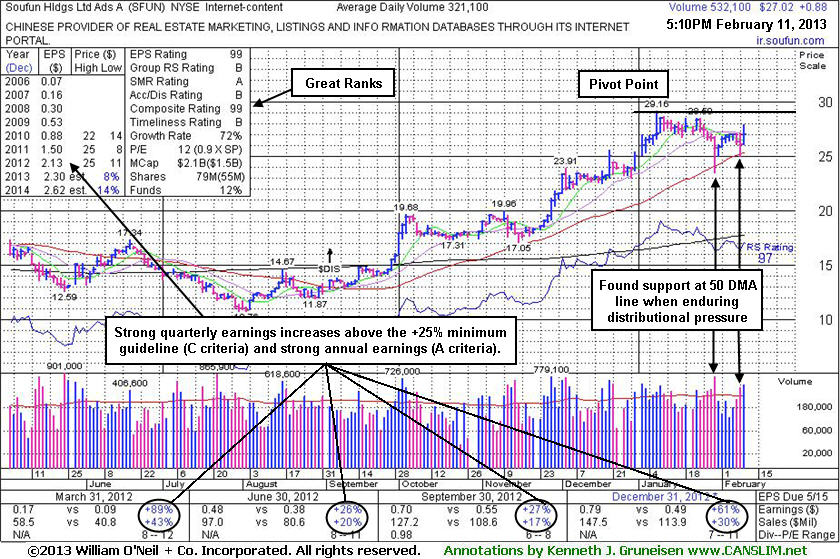
Soufun Hldgs Ltd Ads (SFUN +$0.88 or +3.37% to $27.02) was highlighted in yellow with pivot point cited based on its 1/08/13 high plus 10 cents in the earlier mid-day report (read here). Disciplined investors may watch for subsequent volume-driven gains to confirm a proper technical buy signal. It finished -7.3% off its 52-week high today. It has endured distributional pressure in recent weeks as the annotated graph below shows, yet it has been finding support at its 50-day moving average (DMA) line and still building on an orderly base pattern. Its current Up/Down Volume Ratio of 1.4 is an unbiased indication institutional accumulation (I criteria) has been taking place over the past 50 days. Reported earnings +61% on +30% sales revenues for the Dec '12 quarter, marking 4 consecutive quarters with earnings above the +25% minimum guideline (C criteria). This high-ranked Chinese Real Estate Internet portal firm's IPO was on 9/17/10 and its shares split 4:1 on 2/18/11.
|
|
|
Color Codes Explained :
Y - Better candidates highlighted by our
staff of experts.
G - Previously featured
in past reports as yellow but may no longer be buyable under the
guidelines.
***Last / Change / Volume data in this table is the closing quote data***
Symbol/Exchange
Company Name
Industry Group |
PRICE |
CHANGE
(%Change) |
Day High |
Volume
(% DAV)
(% 50 day avg vol) |
52 Wk Hi
% From Hi |
Featured
Date |
Price
Featured |
Pivot Featured |
|
Max Buy |
CELG
-
NASDAQ
Celgene Corp
DRUGS - Drug Manufacturers - Major
|
$99.94
|
-0.19
-0.19% |
$101.56
|
3,179,591
84.62% of 50 DAV
50 DAV is 3,757,700
|
$102.29
-2.30%
|
12/11/2012
|
$82.24
|
PP = $81.34
|
|
MB = $85.41
|
Most Recent Note - 2/8/2013 4:00:02 PM
G - Still perched near its all-time high, holding its ground stubbornly while very extended from its prior base.
>>> The latest Featured Stock Update with an annotated graph appeared on 2/4/2013. Click here.
View all notes |
Alert me of new notes |
CANSLIM.net Company Profile |
SEC |
Zacks Reports |
StockTalk |
News |
Chart |
Request a new note
C
A N
S L
I M


|
CFNL
-
NASDAQ
Cardinal Financial Corp
BANKING - Regional - Southeast Banks
|
$16.09
|
-0.06
-0.37% |
$16.13
|
83,900
39.80% of 50 DAV
50 DAV is 210,800
|
$16.90
-4.79%
|
12/3/2012
|
$15.20
|
PP = $16.31
|
|
MB = $17.13
|
Most Recent Note - 2/5/2013 3:49:27 PM
Y - Rebounding today with below average volume while rising back above its pivot point and still consolidating just above its 50 DMA line defining important near-term support. Subsequent losses leading to a damaging violation and a slump below the recent low ($15.74 on 1/18/13) would raise concerns and trigger technical sell signals.
>>> The latest Featured Stock Update with an annotated graph appeared on 1/31/2013. Click here.
View all notes |
Alert me of new notes |
CANSLIM.net Company Profile |
SEC |
Zacks Reports |
StockTalk |
News |
Chart |
Request a new note
C
A N
S L
I M
|
CMCSA
-
NASDAQ
Comcast Corp Cl A
MEDIA - CATV Systems
|
$38.64
|
-0.11
-0.28% |
$38.77
|
7,343,148
60.12% of 50 DAV
50 DAV is 12,214,000
|
$40.28
-4.07%
|
12/3/2012
|
$37.08
|
PP = $38.06
|
|
MB = $39.96
|
Most Recent Note - 2/5/2013 3:39:08 PM
Y - Rallying up from support near prior highs and its 50 DMA line with a solid volume-driven gain today. A subsequent violation of the latest low ($37.81 on 2/04/13) would trigger a technical sell signal.
>>> The latest Featured Stock Update with an annotated graph appeared on 1/29/2013. Click here.
View all notes |
Alert me of new notes |
CANSLIM.net Company Profile |
SEC |
Zacks Reports |
StockTalk |
News |
Chart |
Request a new note
C
A N
S L
I M
|
KORS
-
NYSE
Michael Kors Hldgs Ltd
RETAIL - Apparel Stores
|
$57.00
|
-0.10
-0.18% |
$57.76
|
7,112,566
194.05% of 50 DAV
50 DAV is 3,665,300
|
$60.00
-5.00%
|
1/23/2013
|
$54.98
|
PP = $58.72
|
|
MB = $61.66
|
Most Recent Note - 2/7/2013 6:12:57 PM
Y - Managed an impressive "positive reversal" after testing support at its 50 DMA line on 2/05/13. Recently noted repeatedly with caution - "Disciplined investors may watch for volume-driven gains above the pivot point to trigger a proper technical buy signal before taking action." See the latest FSU analysis for more details and a new annotated graph.
>>> The latest Featured Stock Update with an annotated graph appeared on 2/7/2013. Click here.
View all notes |
Alert me of new notes |
CANSLIM.net Company Profile |
SEC |
Zacks Reports |
StockTalk |
News |
Chart |
Request a new note
C
A N
S L
I M
|
LNKD
-
NYSE
Linkedin Corp Class A
INTERNET - Internet Information Providers
|
$155.41
|
+4.93
3.28% |
$158.90
|
8,422,978
452.65% of 50 DAV
50 DAV is 1,860,800
|
$151.89
2.32%
|
2/8/2013
|
$147.04
|
PP = $127.55
|
|
MB = $133.93
|
 Most Recent Note - 2/11/2013 12:36:41 PM
G - Quickly getting very extended, its color code is changed to green while tallying another considerable volume driven gain. It was highlighted in yellow with new pivot point cited based on its 1/28/13 high plus 10 cents in the 2/08/13 mid-day report. Reported earnings +192% on +81% sales revenues for then Dec '12 quarter and it gapped up today. Its considerable "breakaway gap" into new all-time high territory cleared a 4-month cup-with-handle base. A breakaway gap has been noted as the one exception which allows for new buying efforts more than +5% above prior highs, however risk increases the further one chases any stock above prior highs. See the latest FSU analysis for more details and a new annotated graph.
>>> The latest Featured Stock Update with an annotated graph appeared on 2/8/2013. Click here.
View all notes |
Alert me of new notes |
CANSLIM.net Company Profile |
SEC |
Zacks Reports |
StockTalk |
News |
Chart |
Request a new note
C
A N
S L
I M
|
Symbol/Exchange
Company Name
Industry Group |
PRICE |
CHANGE
(%Change) |
Day High |
Volume
(% DAV)
(% 50 day avg vol) |
52 Wk Hi
% From Hi |
Featured
Date |
Price
Featured |
Pivot Featured |
|
Max Buy |
MIDD
-
NASDAQ
Middleby Corp
MANUFACTURING - Diversified Machinery
|
$149.25
|
+0.21
0.14% |
$149.84
|
41,909
45.60% of 50 DAV
50 DAV is 91,900
|
$149.51
-0.17%
|
10/8/2012
|
$118.46
|
PP = $122.67
|
|
MB = $128.80
|
Most Recent Note - 2/5/2013 3:36:13 PM
G - Volume is above average while rallying and hitting another new all-time high today, getting even more extended from any sound base. Prior highs and its 50 DMA line define important near-term chart support in the $132-134 area.
>>> The latest Featured Stock Update with an annotated graph appeared on 1/30/2013. Click here.
View all notes |
Alert me of new notes |
CANSLIM.net Company Profile |
SEC |
Zacks Reports |
StockTalk |
News |
Chart |
Request a new note
C
A N
S L
I M
|
N
-
NYSE
Netsuite Inc
DIVERSIFIED SERVICES - Business/Management Services
|
$65.94
|
-1.10
-1.64% |
$67.00
|
252,886
69.78% of 50 DAV
50 DAV is 362,400
|
$75.75
-12.95%
|
12/12/2012
|
$64.75
|
PP = $67.12
|
|
MB = $70.48
|
Most Recent Note - 2/7/2013 5:29:30 PM
G - Fell again today with lighter volume and finished near its 50 DMA line ($65.92 now). Following a worrisome "negative reversal" on 2/01/13 after initially gapping up for a new 52-week high, the mid-day report cautioned - "Reported earnings +20% on +33% sales revenues for the Dec '12 quarter, below the +25% minimum earnings guideline (C criteria) raising fundamental concerns." See the latest FSU analysis for more details and a new annotated graph.
>>> The latest Featured Stock Update with an annotated graph appeared on 2/5/2013. Click here.
View all notes |
Alert me of new notes |
CANSLIM.net Company Profile |
SEC |
Zacks Reports |
StockTalk |
News |
Chart |
Request a new note
C
A N
S L
I M
|
NP
-
NYSE
Neenah Paper Inc
CONSUMER NON-DURABLES - Paper and Paper Products
|
$29.66
|
-0.30
-1.00% |
$29.99
|
74,568
94.99% of 50 DAV
50 DAV is 78,500
|
$32.57
-8.93%
|
1/25/2013
|
$31.80
|
PP = $31.76
|
|
MB = $33.35
|
Most Recent Note - 2/7/2013 5:31:18 PM
Y - Slumped further below its pivot point with today's 4th consecutive loss, closing near its 50 DMA line defining important chart support. A "negative reversal" for a loss on heavy volume after hitting a new 52-week high on 1/25/13 was noted as a worrisome sign of distributional pressure as it failed to finish strong and did not clinch a technical buy signal.
>>> The latest Featured Stock Update with an annotated graph appeared on 1/25/2013. Click here.
View all notes |
Alert me of new notes |
CANSLIM.net Company Profile |
SEC |
Zacks Reports |
StockTalk |
News |
Chart |
Request a new note
C
A N
S L
I M
|
NSR
-
NYSE
Neustar Inc
TELECOMMUNICATIONS - Diversified Communication Serv
|
$46.37
|
-0.09
-0.19% |
$46.75
|
318,349
72.06% of 50 DAV
50 DAV is 441,800
|
$47.24
-1.84%
|
12/11/2012
|
$41.85
|
PP = $41.41
|
|
MB = $43.48
|
Most Recent Note - 2/6/2013 12:33:30 PM
G - Today's volume-driven gain helped it touch another new 52-week high, getting more extended from its prior base. Its 50 DMA line (now $42.69)defines near-term support above its prior base.
>>> The latest Featured Stock Update with an annotated graph appeared on 2/1/2013. Click here.
View all notes |
Alert me of new notes |
CANSLIM.net Company Profile |
SEC |
Zacks Reports |
StockTalk |
News |
Chart |
Request a new note
C
A N
S L
I M
|
RAX
-
NYSE
Rackspace Hosting Inc
INTERNET - Internet Software and; Services
|
$75.03
|
+1.63
2.22% |
$75.28
|
1,579,266
131.06% of 50 DAV
50 DAV is 1,205,000
|
$81.36
-7.78%
|
12/18/2012
|
$71.88
|
PP = $70.10
|
|
MB = $73.61
|
Most Recent Note - 2/11/2013 5:42:58 PM
G - Found support today with a gain backed by above average volume after losses last week tested important chart support at an upward trendline and its 50 DMA line. Recently noted with caution - "It is extended from the previously noted base. Company will announce its fourth quarter 2012 financial results on Tuesday, February 12, 2013 after the close."
>>> The latest Featured Stock Update with an annotated graph appeared on 2/6/2013. Click here.
View all notes |
Alert me of new notes |
CANSLIM.net Company Profile |
SEC |
Zacks Reports |
StockTalk |
News |
Chart |
Request a new note
C
A N
S L
I M
|
Symbol/Exchange
Company Name
Industry Group |
PRICE |
CHANGE
(%Change) |
Day High |
Volume
(% DAV)
(% 50 day avg vol) |
52 Wk Hi
% From Hi |
Featured
Date |
Price
Featured |
Pivot Featured |
|
Max Buy |
RNF
-
NYSE
Rentech Nitrogen Ptnr Lp
CHEMICALS - Agricultural Chemicals
|
$43.65
|
-2.25
-4.90% |
$46.23
|
861,882
268.50% of 50 DAV
50 DAV is 321,000
|
$49.18
-11.24%
|
11/1/2012
|
$39.11
|
PP = $40.15
|
|
MB = $42.16
|
Most Recent Note - 2/11/2013 1:42:44 PM
G - Enduring more distributional pressure today with another loss on above average volume. Its 50 DMA line ($42.22 now) defines important near-term support above prior highs.
>>> The latest Featured Stock Update with an annotated graph appeared on 1/24/2013. Click here.
View all notes |
Alert me of new notes |
CANSLIM.net Company Profile |
SEC |
Zacks Reports |
StockTalk |
News |
Chart |
Request a new note
C
A N
S L
I M
|
SFUN
-
NYSE
Soufun Hldgs Ltd Ads A
INTERNET - Internet Information Providers
|
$27.02
|
+0.88
3.37% |
$27.93
|
532,418
165.81% of 50 DAV
50 DAV is 321,100
|
$29.16
-7.34%
|
3/11/2013
|
$27.46
|
PP = $29.26
|
|
MB = $30.72
|
Most Recent Note - 2/11/2013 5:40:24 PM
Y - Highlighted in yellow with pivot point cited based on its 1/08/13 high plus 10 cents in the earlier mid-day report. Disciplined investors may watch for subsequent volume-driven gains to confirm a proper technical buy signal. See the latest FSU analysis for more details and an annotated graph.
>>> The latest Featured Stock Update with an annotated graph appeared on 2/11/2013. Click here.
View all notes |
Alert me of new notes |
CANSLIM.net Company Profile |
SEC |
Zacks Reports |
StockTalk |
News |
Chart |
Request a new note
C
A N
S L
I M
|
VRX
-
NYSE
Valeant Pharmaceuticals
DRUGS - Drug Manufacturers - Other
|
$67.56
|
-0.24
-0.35% |
$67.81
|
852,126
55.83% of 50 DAV
50 DAV is 1,526,200
|
$67.98
-0.62%
|
12/20/2012
|
$60.24
|
PP = $61.21
|
|
MB = $64.27
|
Most Recent Note - 2/8/2013 7:06:03 PM
G - Hit a new 52-week high with lighter than average volume behind today's 4th consecutive gain. It is extended from its prior base, and its 50 DMA coincides with prior highs near $61 defining near-term chart support to watch on pullbacks.
>>> The latest Featured Stock Update with an annotated graph appeared on 1/28/2013. Click here.
View all notes |
Alert me of new notes |
CANSLIM.net Company Profile |
SEC |
Zacks Reports |
StockTalk |
News |
Chart |
Request a new note
C
A N
S L
I M
|
|
|
|
THESE ARE NOT BUY RECOMMENDATIONS!
Comments contained in the body of this report are technical
opinions only. The material herein has been obtained
from sources believed to be reliable and accurate, however,
its accuracy and completeness cannot be guaranteed.
This site is not an investment advisor, hence it does
not endorse or recommend any securities or other investments.
Any recommendation contained in this report may not
be suitable for all investors and it is not to be deemed
an offer or solicitation on our part with respect to
the purchase or sale of any securities. All trademarks,
service marks and trade names appearing in this report
are the property of their respective owners, and are
likewise used for identification purposes only.
This report is a service available
only to active Paid Premium Members.
You may opt-out of receiving report notifications
at any time. Questions or comments may be submitted
by writing to Premium Membership Services 665 S.E. 10 Street, Suite 201 Deerfield Beach, FL 33441-5634 or by calling 1-800-965-8307
or 954-785-1121.
|
|
|

