You are not logged in.
This means you
CAN ONLY VIEW reports that were published prior to Tuesday, April 15, 2025.
You
MUST UPGRADE YOUR MEMBERSHIP if you want to see any current reports.
AFTER MARKET UPDATE - FRIDAY, FEBRUARY 8TH, 2013
Previous After Market Report Next After Market Report >>>
|
|
|
|
DOW |
+48.92 |
13,992.97 |
+0.35% |
|
Volume |
578,065,950 |
-13% |
|
Volume |
1,755,532,170 |
-6% |
|
NASDAQ |
+28.74 |
3,193.87 |
+0.91% |
|
Advancers |
2,006 |
65% |
|
Advancers |
1,547 |
60% |
|
S&P 500 |
+8.54 |
1,517.93 |
+0.57% |
|
Decliners |
948 |
31% |
|
Decliners |
886 |
35% |
|
Russell 2000 |
+5.57 |
913.67 |
+0.61% |
|
52 Wk Highs |
308 |
|
|
52 Wk Highs |
188 |
|
|
S&P 600 |
+3.05 |
512.24 |
+0.60% |
|
52 Wk Lows |
8 |
|
|
52 Wk Lows |
17 |
|
|
 |
S&P 500 Index Posted 6th Straight Weekly Advance
Kenneth J. Gruneisen - Passed the CAN SLIM® Master's Exam
The S&P 500 Index posted its sixth-straight weekly advance with a gain of +0.3%. The Dow Jones Industrial Average was virtually unchanged for the week while the Nasdaq Composite Index advanced +0.5%. The major averages posted gains on Friday, but ended well off the session highs. The volume totals were reported lighter on the NYSE and on the Nasdaq exchange, indicating no great conviction from the institutional crowd. Breadth was positive as advancers led decliners by a 2-1 margin on the NYSE and nearly 2-1 on the Nasdaq exchange. The total number of stocks hitting new 52-week highs easily outnumbered new 52-week lows on the NYSE and on the Nasdaq exchange. There were 103 high-ranked companies from the CANSLIM.net Leaders List making new 52-week highs and appearing on the CANSLIM.net BreakOuts Page, up from the prior session total of 72 stocks. There were gains for 9 of the 12 high-ranked companies currently included on the Featured Stocks Page.
The market closed out a volatile week on a positive note, rebounding from Thursday's retreat amid encouraging economic data. The U.S. trade deficit narrowed in December to its lowest level in three years to $38.5 billion. More signs of a soft landing in China added to the positive tone as the nation's exports grew in January by the most since April 2011. Meanwhile in Europe, the EU agreed to a seven-year budget that cuts spending for the first time ever.
Fourth-quarter earnings results also helped lift the market. So far about 75% of S&P 500 companies have topped estimates for earnings and 67% have exceeded on revenue, according to Bloomberg.
Nearly all sectors traded higher on Friday. The more defensive groups of utilities and telecom lagged behind as Exelon Corp (EXC -0.92%) and Verizon Communications Inc (VZ -0.25%) ended lower. Technology paced the advance thanks to Apple Inc (AAPL +1.44%) which is now -32.6%% off its all-time high hit on 9/21/12. Note that date and its significance on the chart of the Nasdaq Composite Index discussed in greater detail below.
In fixed-income, Treasury prices were up slightly as the 10-year note gained 2/32 to yield 1.95%.
The latest rally has produced a few action worthy candidates meeting all of the fact-based investment system's criteria. Selectivity and discipline are required, as always. Investors may consider new buying efforts in stocks meeting all key criteria, as the market's (M criteria) confirmed uptrend has been comprised by great leadership (stocks hitting new 52-week highs) in the broader market. Widespread gains helped all of the major averages blast higher, and the benchmark S&P 500 Index is perched at its best level in more than five years and off its October 2007 all-time high.
Watch for an announcement via email concerning the next WEBCAST. The webcast will also be available via an updated link highlighted at the top of the Premium Member Homepage.
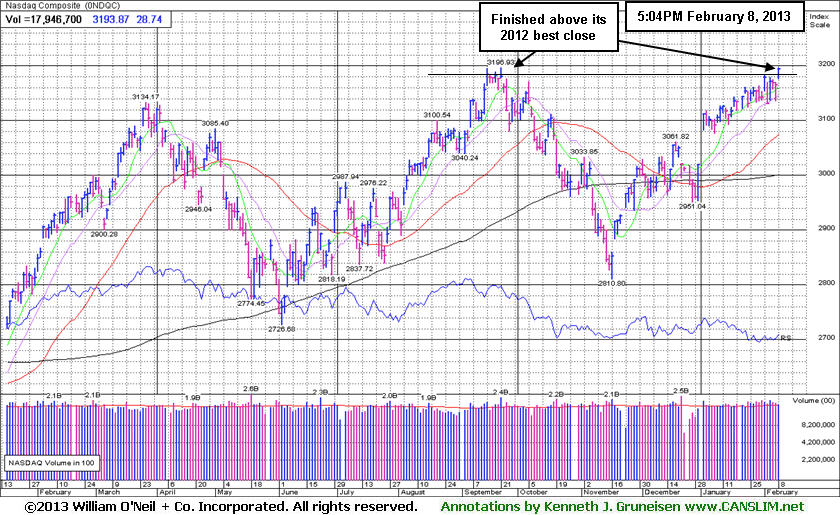
PICTURED: The Nasdaq Composite Index rose 28 points to 3,193, its best level since November 2000. It finished Friday's session above its best closes of 2012 after trading intra-day within 4 cents of the high hit on 9/21/12. Subsequent gains into new high territory may help the broader market gain more momentum and may attract greater interest in stocks overall.
|
 Kenneth J. Gruneisen started out as a licensed stockbroker in August 1987, a couple of months prior to the historic stock market crash that took the Dow Jones Industrial Average down -22.6% in a single day. He has published daily fact-based fundamental and technical analysis on high-ranked stocks online for two decades. Through FACTBASEDINVESTING.COM, Kenneth provides educational articles, news, market commentary, and other information regarding proven investment systems that work in good times and bad.
Comments contained in the body of this report are technical opinions only and are not necessarily those of Gruneisen Growth Corp. The material herein has been obtained from sources believed to be reliable and accurate, however, its accuracy and completeness cannot be guaranteed. Our firm, employees, and customers may effect transactions, including transactions contrary to any recommendation herein, or have positions in the securities mentioned herein or options with respect thereto. Any recommendation contained in this report may not be suitable for all investors and it is not to be deemed an offer or solicitation on our part with respect to the purchase or sale of any securities. |
|
 |
Compare Growth Versus Defensive Group Selection Year-To-Date
Kenneth J. Gruneisen - Passed the CAN SLIM® Master's Exam
In this "Industry Group Watch" section we compare the performance of "growth" oriented industry groups versus the "defensive" groups below. The Healthcare Index ($HMO +2.00%) posted a big gain and was a standout leader on Friday. The Retail Index ($RLX +0.75%) helped underpin the major averages' gains. The Semiconductor Index ($SOX +1.32%) and Biotechnology Index ($BTK +1.37%) led the tech sector higher, meanwhile the Internet Index ($IIX +0.46%) posted a smaller gain, and the Networking Index ($NWX +0.18%) inched higher. Financial and energy-related stocks had a positive bias as the Broker/Dealer Index ($XBD +0.12%) and Bank Index ($BKX +0.29%) each inched higher, and the Integrated Oil Index ($XOI +0.52%) and Oil Services Index ($OSX +0.95%) both posted modest gains.
Charts courtesy www.stockcharts.com
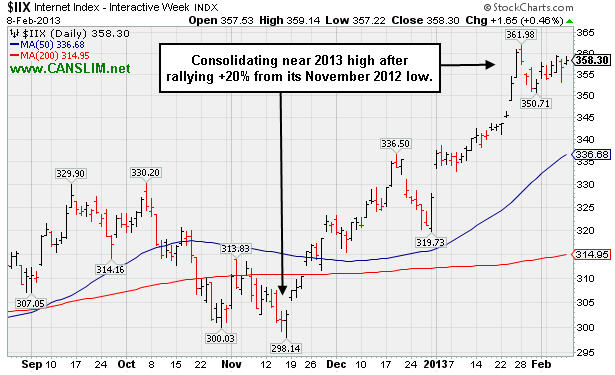
PICTURED 1: The Internet Index ($IIX +0.46%) is consolidating near its 2013 high after rallying +20% from its November 2012 low, up approximately +9.5% year-to-date. Consider the performance of this and other "growth" oriented industry groups versus the classic "defensive" group below.
Charts courtesy www.stockcharts.com
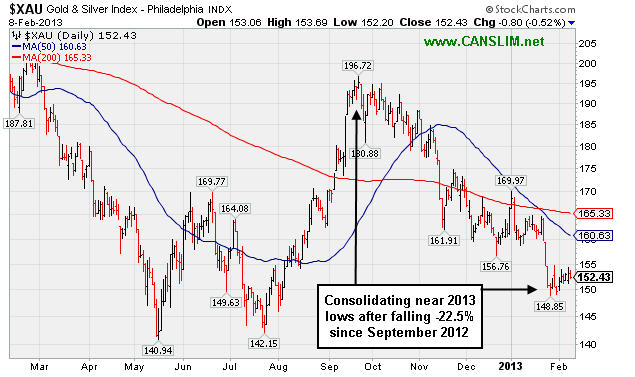
PICTURED 2: The Gold & Silver Index ($XAU -0.52%) was clearly a laggard as it edged lower on Friday, accentuating its near -8% year-to-date loss versus other groups' growing gains. This index fell -22.5% from its September 2012 peak.
| Oil Services |
$OSX |
248.61 |
+2.35 |
+0.95% |
+12.92% |
| Healthcare |
$HMO |
2,819.89 |
+55.40 |
+2.00% |
+12.16% |
| Integrated Oil |
$XOI |
1,354.82 |
+6.96 |
+0.52% |
+9.10% |
| Semiconductor |
$SOX |
424.81 |
+5.55 |
+1.32% |
+10.61% |
| Networking |
$NWX |
246.22 |
+0.45 |
+0.18% |
+8.68% |
| Internet |
$IIX |
358.30 |
+1.65 |
+0.46% |
+9.57% |
| Broker/Dealer |
$XBD |
106.95 |
+0.13 |
+0.12% |
+13.38% |
| Retail |
$RLX |
704.35 |
+5.22 |
+0.75% |
+7.85% |
| Gold & Silver |
$XAU |
152.43 |
-0.80 |
-0.52% |
-7.95% |
| Bank |
$BKX |
55.00 |
+0.16 |
+0.29% |
+7.25% |
| Biotech |
$BTK |
1,690.11 |
+22.86 |
+1.37% |
+9.25% |
|
|
|
 |
Quickly Extended From Prior Highs Following Big Breakaway Gap
Kenneth J. Gruneisen - Passed the CAN SLIM® Master's Exam
Often, when a leading stock is breaking out of a solid base it is highlighted in CANSLIM.net's Mid-Day Breakouts Report. The most relevant factors are noted in the report which alerts prudent CANSLIM oriented investors. After doing any necessary backup research, the investor is prepared to act. Disciplined investors know to buy as near as possible to the pivot point and avoid chasing stocks after they have rallied more than +5% above their pivot point. It is crucial to always limit losses whenever any stock heads the wrong direction, and disciplined investors sell if a struggling stock ever falls more than -7% from their purchase price.
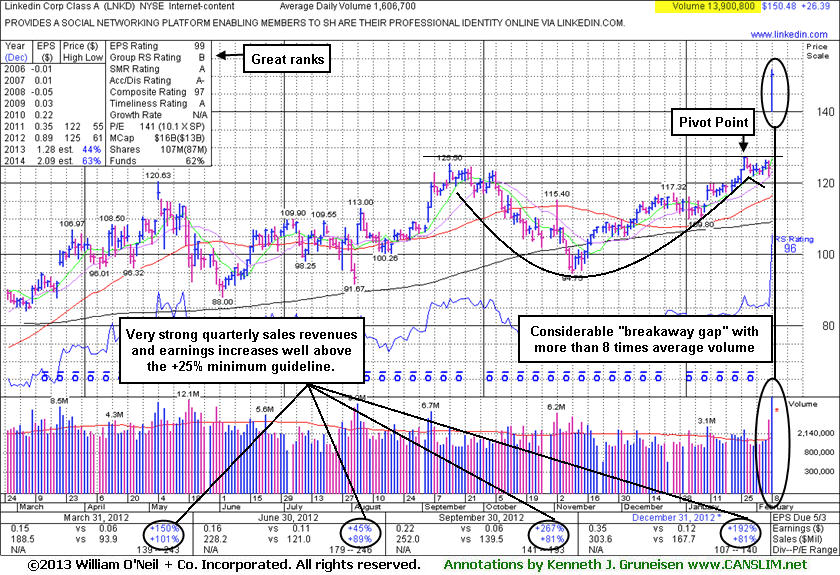
Linkedin Corp (LNKD +$26.39 or +21.27% to $150.48) was highlighted in yellow in the earlier mid-day report (read here) with new pivot point cited based on its 1/28/13 high plus 10 cents. It reported earnings +192% on +81% sales revenues for the Dec '12 quarter and it gapped up today. Its considerable "breakaway gap" into new all-time high territory helped it blast from a 4-month cup-with-handle base. Longtime members may recall that a breakaway gap has previously been noted as the one exception which allows for new buying efforts more than +5% above prior highs, however risk increases the further one chases any stock above prior highs that an ordinary pullback may trigger the fact-based system's strict sell rule. Disciplined investors always limit losses by selling if ever any stock fall more than -7% from its purchase price.
LNKD was last seen in this FSU section on 10/09/12 with an annotated graph under the headline, "Pullback Testing Prior Highs And 50-Day Moving Average", when retreating near prior highs in the $113 area along with its 50-day moving average (DMA) line. Subsequent violations triggered technical sell signals. It has rebounded impressively from lows below its 200-day moving average (DMA) line since dropped from the Featured Stocks list on 10/19/12.
Its fundamentals (C and A criteria) remain strong. It was most recently noted in the 1/10/13 mid-day report - "Patient and disciplined investors may keep it on their watch list and wait for a proper base and breakout to possibly be noted in the coming weeks."
The high-ranked leader from the Internet - Content Its Return On Equity of 11% (previously noted) is below the 17% guideline, which is a minor concern. Ownership by top-rated funds has been on the rise, increasing from 185 in Sep '11 to 809 in Dec '12, a very reassuring sign concerning the I criteria.
|
|
|
Color Codes Explained :
Y - Better candidates highlighted by our
staff of experts.
G - Previously featured
in past reports as yellow but may no longer be buyable under the
guidelines.
***Last / Change / Volume data in this table is the closing quote data***
Symbol/Exchange
Company Name
Industry Group |
PRICE |
CHANGE
(%Change) |
Day High |
Volume
(% DAV)
(% 50 day avg vol) |
52 Wk Hi
% From Hi |
Featured
Date |
Price
Featured |
Pivot Featured |
|
Max Buy |
CELG
-
NASDAQ
Celgene Corp
DRUGS - Drug Manufacturers - Major
|
$100.13
|
+2.30
2.35% |
$100.86
|
3,611,151
96.62% of 50 DAV
50 DAV is 3,737,600
|
$102.29
-2.11%
|
12/11/2012
|
$82.24
|
PP = $81.34
|
|
MB = $85.41
|
 Most Recent Note - 2/8/2013 4:00:02 PM
G - Still perched near its all-time high, holding its ground stubbornly while very extended from its prior base.
>>> The latest Featured Stock Update with an annotated graph appeared on 2/4/2013. Click here.
View all notes |
Alert me of new notes |
CANSLIM.net Company Profile |
SEC |
Zacks Reports |
StockTalk |
News |
Chart |
Request a new note
C
A N
S L
I M


|
CFNL
-
NASDAQ
Cardinal Financial Corp
BANKING - Regional - Southeast Banks
|
$16.15
|
-0.01
-0.06% |
$16.38
|
110,193
51.30% of 50 DAV
50 DAV is 214,800
|
$16.90
-4.44%
|
12/3/2012
|
$15.20
|
PP = $16.31
|
|
MB = $17.13
|
Most Recent Note - 2/5/2013 3:49:27 PM
Y - Rebounding today with below average volume while rising back above its pivot point and still consolidating just above its 50 DMA line defining important near-term support. Subsequent losses leading to a damaging violation and a slump below the recent low ($15.74 on 1/18/13) would raise concerns and trigger technical sell signals.
>>> The latest Featured Stock Update with an annotated graph appeared on 1/31/2013. Click here.
View all notes |
Alert me of new notes |
CANSLIM.net Company Profile |
SEC |
Zacks Reports |
StockTalk |
News |
Chart |
Request a new note
C
A N
S L
I M
|
CMCSA
-
NASDAQ
Comcast Corp Cl A
MEDIA - CATV Systems
|
$38.75
|
+0.13
0.34% |
$38.88
|
15,393,489
127.45% of 50 DAV
50 DAV is 12,077,900
|
$40.28
-3.80%
|
12/3/2012
|
$37.08
|
PP = $38.06
|
|
MB = $39.96
|
Most Recent Note - 2/5/2013 3:39:08 PM
Y - Rallying up from support near prior highs and its 50 DMA line with a solid volume-driven gain today. A subsequent violation of the latest low ($37.81 on 2/04/13) would trigger a technical sell signal.
>>> The latest Featured Stock Update with an annotated graph appeared on 1/29/2013. Click here.
View all notes |
Alert me of new notes |
CANSLIM.net Company Profile |
SEC |
Zacks Reports |
StockTalk |
News |
Chart |
Request a new note
C
A N
S L
I M
|
KORS
-
NYSE
Michael Kors Hldgs Ltd
RETAIL - Apparel Stores
|
$57.10
|
+0.44
0.78% |
$57.71
|
5,131,009
142.08% of 50 DAV
50 DAV is 3,611,300
|
$60.00
-4.83%
|
1/23/2013
|
$54.98
|
PP = $58.72
|
|
MB = $61.66
|
Most Recent Note - 2/7/2013 6:12:57 PM
Y - Managed an impressive "positive reversal" after testing support at its 50 DMA line on 2/05/13. Recently noted repeatedly with caution - "Disciplined investors may watch for volume-driven gains above the pivot point to trigger a proper technical buy signal before taking action." See the latest FSU analysis for more details and a new annotated graph.
>>> The latest Featured Stock Update with an annotated graph appeared on 2/7/2013. Click here.
View all notes |
Alert me of new notes |
CANSLIM.net Company Profile |
SEC |
Zacks Reports |
StockTalk |
News |
Chart |
Request a new note
C
A N
S L
I M
|
LNKD
-
NYSE
Linkedin Corp Class A
INTERNET - Internet Information Providers
|
$150.48
|
+26.39
21.27% |
$151.89
|
13,917,228
866.20% of 50 DAV
50 DAV is 1,606,700
|
$127.45
18.07%
|
2/8/2013
|
$147.04
|
PP = $127.55
|
|
MB = $133.93
|
Most Recent Note - 2/8/2013 7:09:24 PM
Y - It was highlighted in yellow with new pivot point cited based on its 1/28/13 high plus 10 cents in the earlier mid-day report. Reported earnings +192% on +81% sales revenues for then Dec '12 quarter and it gapped up today. Its considerable "breakaway gap" into new all-time high territory cleared a 4-month cup-with-handle base. A breakaway gap has been noted as the one exception which allows for new buying efforts more than +5% above prior highs, however risk increases the further one chases any stock above prior highs. See the latest FSU analysis for more details and a new annotated graph.
>>> The latest Featured Stock Update with an annotated graph appeared on 2/8/2013. Click here.
View all notes |
Alert me of new notes |
CANSLIM.net Company Profile |
SEC |
Zacks Reports |
StockTalk |
News |
Chart |
Request a new note
C
A N
S L
I M
|
Symbol/Exchange
Company Name
Industry Group |
PRICE |
CHANGE
(%Change) |
Day High |
Volume
(% DAV)
(% 50 day avg vol) |
52 Wk Hi
% From Hi |
Featured
Date |
Price
Featured |
Pivot Featured |
|
Max Buy |
MIDD
-
NASDAQ
Middleby Corp
MANUFACTURING - Diversified Machinery
|
$149.04
|
+1.48
1.00% |
$149.51
|
58,897
63.67% of 50 DAV
50 DAV is 92,500
|
$149.37
-0.22%
|
10/8/2012
|
$118.46
|
PP = $122.67
|
|
MB = $128.80
|
Most Recent Note - 2/5/2013 3:36:13 PM
G - Volume is above average while rallying and hitting another new all-time high today, getting even more extended from any sound base. Prior highs and its 50 DMA line define important near-term chart support in the $132-134 area.
>>> The latest Featured Stock Update with an annotated graph appeared on 1/30/2013. Click here.
View all notes |
Alert me of new notes |
CANSLIM.net Company Profile |
SEC |
Zacks Reports |
StockTalk |
News |
Chart |
Request a new note
C
A N
S L
I M
|
N
-
NYSE
Netsuite Inc
DIVERSIFIED SERVICES - Business/Management Services
|
$67.04
|
+0.70
1.06% |
$67.60
|
161,334
43.77% of 50 DAV
50 DAV is 368,600
|
$75.75
-11.50%
|
12/12/2012
|
$64.75
|
PP = $67.12
|
|
MB = $70.48
|
Most Recent Note - 2/7/2013 5:29:30 PM
G - Fell again today with lighter volume and finished near its 50 DMA line ($65.92 now). Following a worrisome "negative reversal" on 2/01/13 after initially gapping up for a new 52-week high, the mid-day report cautioned - "Reported earnings +20% on +33% sales revenues for the Dec '12 quarter, below the +25% minimum earnings guideline (C criteria) raising fundamental concerns." See the latest FSU analysis for more details and a new annotated graph.
>>> The latest Featured Stock Update with an annotated graph appeared on 2/5/2013. Click here.
View all notes |
Alert me of new notes |
CANSLIM.net Company Profile |
SEC |
Zacks Reports |
StockTalk |
News |
Chart |
Request a new note
C
A N
S L
I M
|
NP
-
NYSE
Neenah Paper Inc
CONSUMER NON-DURABLES - Paper and Paper Products
|
$29.96
|
+0.43
1.46% |
$30.42
|
84,764
107.98% of 50 DAV
50 DAV is 78,500
|
$32.57
-8.01%
|
1/25/2013
|
$31.80
|
PP = $31.76
|
|
MB = $33.35
|
Most Recent Note - 2/7/2013 5:31:18 PM
Y - Slumped further below its pivot point with today's 4th consecutive loss, closing near its 50 DMA line defining important chart support. A "negative reversal" for a loss on heavy volume after hitting a new 52-week high on 1/25/13 was noted as a worrisome sign of distributional pressure as it failed to finish strong and did not clinch a technical buy signal.
>>> The latest Featured Stock Update with an annotated graph appeared on 1/25/2013. Click here.
View all notes |
Alert me of new notes |
CANSLIM.net Company Profile |
SEC |
Zacks Reports |
StockTalk |
News |
Chart |
Request a new note
C
A N
S L
I M
|
NSR
-
NYSE
Neustar Inc
TELECOMMUNICATIONS - Diversified Communication Serv
|
$46.46
|
-0.07
-0.15% |
$46.71
|
264,398
59.50% of 50 DAV
50 DAV is 444,400
|
$47.24
-1.65%
|
12/11/2012
|
$41.85
|
PP = $41.41
|
|
MB = $43.48
|
Most Recent Note - 2/6/2013 12:33:30 PM
G - Today's volume-driven gain helped it touch another new 52-week high, getting more extended from its prior base. Its 50 DMA line (now $42.69)defines near-term support above its prior base.
>>> The latest Featured Stock Update with an annotated graph appeared on 2/1/2013. Click here.
View all notes |
Alert me of new notes |
CANSLIM.net Company Profile |
SEC |
Zacks Reports |
StockTalk |
News |
Chart |
Request a new note
C
A N
S L
I M
|
RAX
-
NYSE
Rackspace Hosting Inc
INTERNET - Internet Software and; Services
|
$73.40
|
+0.29
0.40% |
$73.87
|
1,255,024
105.21% of 50 DAV
50 DAV is 1,192,900
|
$81.36
-9.78%
|
12/18/2012
|
$71.88
|
PP = $70.10
|
|
MB = $73.61
|
Most Recent Note - 2/7/2013 5:21:20 PM
G - Damaging loss today with almost 2 times average volume raised concerns and led to a close testing important chart support at an upward trendline and its 50 DMA line. Recently noted with caution - "It is extended from the previously noted base. Company will announce its fourth quarter 2012 financial results on Tuesday, February 12, 2013 after the close." See the latest FSU analysis for more details and a new annotated graph.
>>> The latest Featured Stock Update with an annotated graph appeared on 2/6/2013. Click here.
View all notes |
Alert me of new notes |
CANSLIM.net Company Profile |
SEC |
Zacks Reports |
StockTalk |
News |
Chart |
Request a new note
C
A N
S L
I M
|
Symbol/Exchange
Company Name
Industry Group |
PRICE |
CHANGE
(%Change) |
Day High |
Volume
(% DAV)
(% 50 day avg vol) |
52 Wk Hi
% From Hi |
Featured
Date |
Price
Featured |
Pivot Featured |
|
Max Buy |
RNF
-
NYSE
Rentech Nitrogen Ptnr Lp
CHEMICALS - Agricultural Chemicals
|
$45.90
|
-1.58
-3.33% |
$47.43
|
445,553
140.95% of 50 DAV
50 DAV is 316,100
|
$49.18
-6.67%
|
11/1/2012
|
$39.11
|
PP = $40.15
|
|
MB = $42.16
|
Most Recent Note - 2/8/2013 3:58:36 PM
G - Retreating further from its 52-week high today with another loss on above average volume, a sign of still more distributional pressure. Previously noted - "Extended from its prior base. Prior highs and 50 DMA line coincide near $41 defining important chart support to watch on pullbacks."
>>> The latest Featured Stock Update with an annotated graph appeared on 1/24/2013. Click here.
View all notes |
Alert me of new notes |
CANSLIM.net Company Profile |
SEC |
Zacks Reports |
StockTalk |
News |
Chart |
Request a new note
C
A N
S L
I M
|
VRX
-
NYSE
Valeant Pharmaceuticals
DRUGS - Drug Manufacturers - Other
|
$67.80
|
+0.56
0.83% |
$67.98
|
725,317
47.34% of 50 DAV
50 DAV is 1,532,100
|
$67.65
0.22%
|
12/20/2012
|
$60.24
|
PP = $61.21
|
|
MB = $64.27
|
Most Recent Note - 2/8/2013 7:06:03 PM
G - Hit a new 52-week high with lighter than average volume behind today's 4th consecutive gain. It is extended from its prior base, and its 50 DMA coincides with prior highs near $61 defining near-term chart support to watch on pullbacks.
>>> The latest Featured Stock Update with an annotated graph appeared on 1/28/2013. Click here.
View all notes |
Alert me of new notes |
CANSLIM.net Company Profile |
SEC |
Zacks Reports |
StockTalk |
News |
Chart |
Request a new note
C
A N
S L
I M
|
|
|
|
THESE ARE NOT BUY RECOMMENDATIONS!
Comments contained in the body of this report are technical
opinions only. The material herein has been obtained
from sources believed to be reliable and accurate, however,
its accuracy and completeness cannot be guaranteed.
This site is not an investment advisor, hence it does
not endorse or recommend any securities or other investments.
Any recommendation contained in this report may not
be suitable for all investors and it is not to be deemed
an offer or solicitation on our part with respect to
the purchase or sale of any securities. All trademarks,
service marks and trade names appearing in this report
are the property of their respective owners, and are
likewise used for identification purposes only.
This report is a service available
only to active Paid Premium Members.
You may opt-out of receiving report notifications
at any time. Questions or comments may be submitted
by writing to Premium Membership Services 665 S.E. 10 Street, Suite 201 Deerfield Beach, FL 33441-5634 or by calling 1-800-965-8307
or 954-785-1121.
|
|
|

