You are not logged in.
This means you
CAN ONLY VIEW reports that were published prior to Tuesday, April 22, 2025.
You
MUST UPGRADE YOUR MEMBERSHIP if you want to see any current reports.
AFTER MARKET UPDATE - TUESDAY, FEBRUARY 12TH, 2013
Previous After Market Report Next After Market Report >>>
|
|
|
|
DOW |
+47.46 |
14,018.70 |
+0.34% |
|
Volume |
613,789,280 |
+24% |
|
Volume |
1,697,040,540 |
+12% |
|
NASDAQ |
-5.51 |
3,186.49 |
-0.17% |
|
Advancers |
1,935 |
62% |
|
Advancers |
1,517 |
59% |
|
S&P 500 |
+2.42 |
1,519.43 |
+0.16% |
|
Decliners |
1,054 |
34% |
|
Decliners |
949 |
37% |
|
Russell 2000 |
+4.49 |
917.52 |
+0.49% |
|
52 Wk Highs |
293 |
|
|
52 Wk Highs |
180 |
|
|
S&P 600 |
+2.25 |
513.94 |
+0.44% |
|
52 Wk Lows |
13 |
|
|
52 Wk Lows |
18 |
|
|
 |
Dow Perched Near Complete Recovery to 2007 High
Kenneth J. Gruneisen - Passed the CAN SLIM® Master's Exam
The major averages finished mostly higher in another quiet trading session Tuesday's volume totals were reported slightly higher on the NYSE and on the Nasdaq exchange. Breadth was positive as advancers led decliners by nearly a 2-1 margin on the NYSE and by a 3-2 margin on the Nasdaq exchange. The total number of stocks hitting new 52-week highs easily outnumbered new 52-week lows on the NYSE and on the Nasdaq exchange. There were 66 high-ranked companies from the CANSLIM.net Leaders List making new 52-week highs and appearing on the CANSLIM.net BreakOuts Page, versus the prior session total of 60 stocks. There were gains for 6 of the 13 high-ranked companies currently included on the Featured Stocks Page.
At 9PM EST Tuesday, President Obama will deliver his legislative priorities for the fifth time, amid the looming March 1st budget sequester. Investors will be focused on comments surrounding the looming automatic spending cuts. On the economic front, the NFIB small business optimism index increased for a second month in January. A separate report showed the U.S. government ran its first monthly budget surplus since September 2012 in January.
Nearly all sectors gained ground. Financials were leading gainers with both Citigroup Inc (C +2.78%) and Bank of America Corp (BAC +3.25%) trading up. Industrials were also notable performers, paced by Masco Corp (MAS +12.45%) as an improving housing market led to a better-than-expected profit tally. Telecommunication stocks paced the advance as Sprint Nextel Corp (S +2.07%) and AT&T Inc (T +1.05%) rose. On the downside, a retreat in The Coca-Cola Co (KO -2.72%) dragged consumer staples lower after the company posted a weak revenue tally. Losses in technology also limited gains as Apple Inc (AAPL 2.51%) and Qualcomm Inc (QCOM -1.93%) lost ground.
In fixed-income, Treasuries were lower after a government auction of 3-year notes. The 10-year note was down 3/32 to yield 1.97% and the 30-year bond lost 7/32 to yield 3.18%.
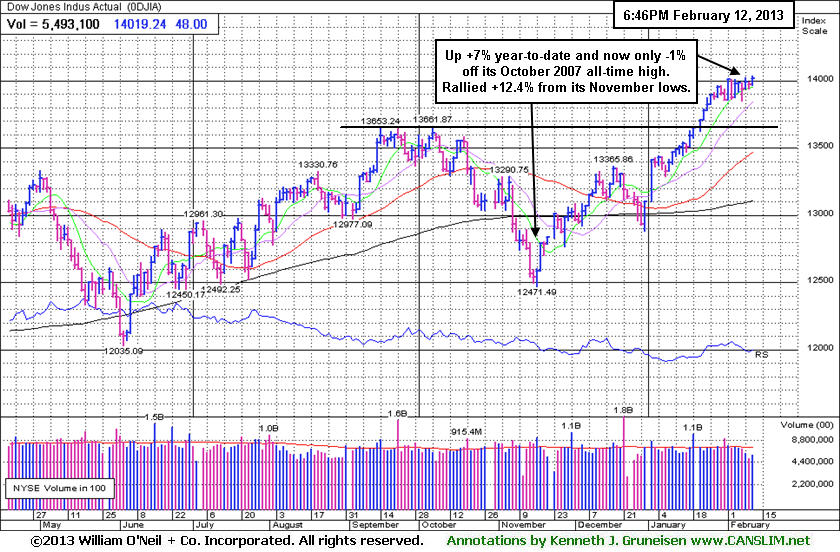
The latest rally has produced a few action worthy candidates meeting all of the fact-based investment system's criteria. Selectivity and discipline are required, as always. Investors may consider new buying efforts in stocks meeting all key criteria, as the market's (M criteria) confirmed uptrend has been comprised by great leadership (stocks hitting new 52-week highs) in the broader market. Widespread gains helped all of the major averages blast higher, and the benchmark S&P 500 Index is perched at its best level in more than five years and off its October 2007 all-time high.
Watch for an announcement via email concerning the next WEBCAST. The webcast will also be available via an updated link highlighted at the top of the Premium Member Homepage.
PICTURED: The Dow Jones Industrial Average rose 47 points to 14,018 and finished back above the psychologically important 14,000 level. It now stands about -1% below its all-time high of October 2007 while up +7% year-to-date after steadily rallying +12.4% from its November 2012 lows. Subsequent gains into new all-time high territory may help the broader market gain more momentum as headlines may attract greater interest in stocks overall.
|
 Kenneth J. Gruneisen started out as a licensed stockbroker in August 1987, a couple of months prior to the historic stock market crash that took the Dow Jones Industrial Average down -22.6% in a single day. He has published daily fact-based fundamental and technical analysis on high-ranked stocks online for two decades. Through FACTBASEDINVESTING.COM, Kenneth provides educational articles, news, market commentary, and other information regarding proven investment systems that work in good times and bad.
Comments contained in the body of this report are technical opinions only and are not necessarily those of Gruneisen Growth Corp. The material herein has been obtained from sources believed to be reliable and accurate, however, its accuracy and completeness cannot be guaranteed. Our firm, employees, and customers may effect transactions, including transactions contrary to any recommendation herein, or have positions in the securities mentioned herein or options with respect thereto. Any recommendation contained in this report may not be suitable for all investors and it is not to be deemed an offer or solicitation on our part with respect to the purchase or sale of any securities. |
|
 |
Financial Group and Broader Group Gains Underpinned Market
Kenneth J. Gruneisen - Passed the CAN SLIM® Master's Exam
The Biotechnology Index ($BTK -0.73%) lagged the tech sector as it lost ground while the Semiconductor Index ($SOX +0.24%), Internet Index ($IIX +0.28%), and the Networking Index ($NWX +0.37%) each posted a modest gain. The defensive groups edged higher as the Healthcare Index ($HMO +0.76%) and Gold & Silver Index ($XAU +0.87%) tallied gains. The financial group underpinned the market's gains as the Broker/Dealer Index ($XBD +1.02%) and Bank Index ($BKX +1.05%) posted better than +1% gains. The Retail Index ($RLX +0.33%) edged higher and a positive bias in energy-related shares lifted both the Oil Services Index ($OSX +0.33%) and the Integrated Oil Index ($XOI +0.35%).
Charts courtesy www.stockcharts.com
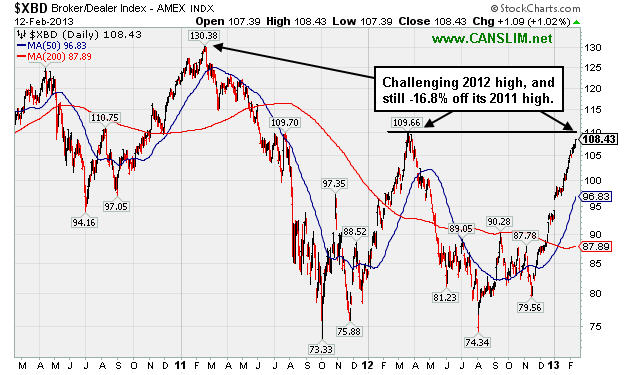
PICTURED: The 3-year graph of the Broker/Dealer Index ($XBD +1.02%) shows it now nearly challenging its 2012 high after a strong start for 2013. Meanwhile, it currently sits -16.8% off its 2011 high.
| Oil Services |
$OSX |
246.49 |
+0.80 |
+0.33% |
+11.96% |
| Healthcare |
$HMO |
2,796.76 |
+21.07 |
+0.76% |
+11.24% |
| Integrated Oil |
$XOI |
1,352.33 |
+4.73 |
+0.35% |
+8.90% |
| Semiconductor |
$SOX |
426.28 |
+1.04 |
+0.24% |
+10.99% |
| Networking |
$NWX |
246.09 |
+0.91 |
+0.37% |
+8.62% |
| Internet |
$IIX |
357.03 |
+0.98 |
+0.28% |
+9.18% |
| Broker/Dealer |
$XBD |
108.43 |
+1.09 |
+1.02% |
+14.95% |
| Retail |
$RLX |
702.75 |
+2.31 |
+0.33% |
+7.61% |
| Gold & Silver |
$XAU |
150.62 |
+1.30 |
+0.87% |
-9.05% |
| Bank |
$BKX |
55.71 |
+0.58 |
+1.05% |
+8.64% |
| Biotech |
$BTK |
1,665.82 |
-12.30 |
-0.73% |
+7.68% |
|
|
|
 |
Violation of 50-Day Moving Average Came With Heavy Volume
Kenneth J. Gruneisen - Passed the CAN SLIM® Master's Exam
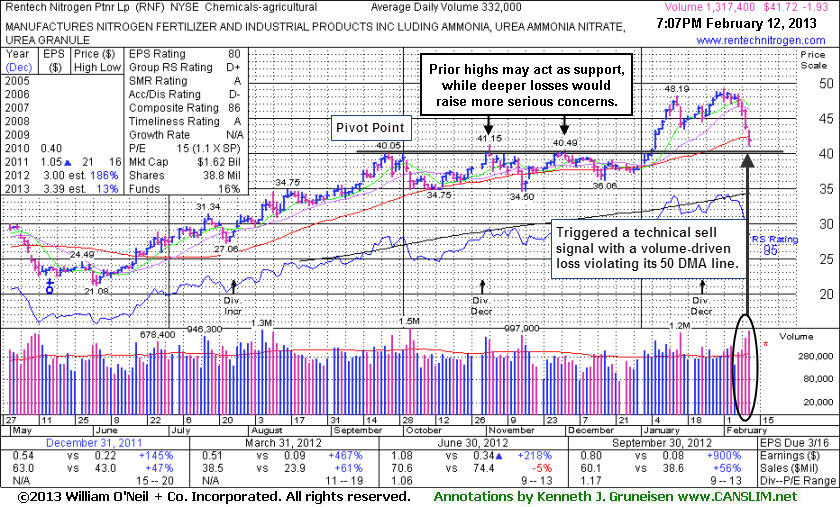
Rentech Nitrogen Ptnr LP (RNF -$1.93 or -4.42% to $41.72) fell today on heavier volume 4 times above average. After a weak finish on the prior session it gapped down and undercut its 50-day moving average (DMA) line ($42.34 now) with a volume-driven loss and weak finish raising serious concerns and triggering a technical sell signal. A prompt sign of support would be an encouraging sign, however it could spend a lot of time consolidating and doing some new base building. Meanwhile, it faces resistance due to overhead supply up through the $49 level that could hinder its progress, especially versus any other fresh breakout which may show up. Prior highs near $41 may act as support, however any deeper losses would raise more serious concerns and trigger additional worrisome sell signals. It next earnings report is scheduled for Tuesday, March 19, 2013.
It was last shown in this FSU section on 1/24/13 with an annotated graph under the headline, "Distributional Pressure After Getting Extended From Ideal Buy Range". It subsequently rallied for new 52-week highs but then it stalled without making meaningful headway above prior highs in the $48 area. It was previously noted with caution - "The number of top-rated funds owning its shares had fallen from 52 in Jun '12 to 36 as of Dec '12, a disconcerting sign concerning the I criteria.
Repeating a point emphasized in this FSU section - "Disciplined investors avoid chasing extended stocks more than +5% above their pivot point. Making sloppy buy decisions by chasing extended stocks invites a much greater chance that an ordinary consolidation might prompt investors to invoke the investment system's strict loss-limiting sell rule after a pullback of -7% or more from their purchase price."
|
|
|
Color Codes Explained :
Y - Better candidates highlighted by our
staff of experts.
G - Previously featured
in past reports as yellow but may no longer be buyable under the
guidelines.
***Last / Change / Volume data in this table is the closing quote data***
Symbol/Exchange
Company Name
Industry Group |
PRICE |
CHANGE
(%Change) |
Day High |
Volume
(% DAV)
(% 50 day avg vol) |
52 Wk Hi
% From Hi |
Featured
Date |
Price
Featured |
Pivot Featured |
|
Max Buy |
CELG
-
NASDAQ
Celgene Corp
DRUGS - Drug Manufacturers - Major
|
$98.96
|
-0.98
-0.98% |
$100.42
|
2,215,099
58.74% of 50 DAV
50 DAV is 3,771,000
|
$102.29
-3.26%
|
12/11/2012
|
$82.24
|
PP = $81.34
|
|
MB = $85.41
|
Most Recent Note - 2/8/2013 4:00:02 PM
G - Still perched near its all-time high, holding its ground stubbornly while very extended from its prior base.
>>> The latest Featured Stock Update with an annotated graph appeared on 2/4/2013. Click here.
View all notes |
Alert me of new notes |
CANSLIM.net Company Profile |
SEC |
Zacks Reports |
StockTalk |
News |
Chart |
Request a new note
C
A N
S L
I M


|
CFNL
-
NASDAQ
Cardinal Financial Corp
BANKING - Regional - Southeast Banks
|
$16.57
|
+0.48
2.98% |
$16.64
|
428,752
211.00% of 50 DAV
50 DAV is 203,200
|
$16.90
-1.95%
|
12/3/2012
|
$15.20
|
PP = $16.31
|
|
MB = $17.13
|
 Most Recent Note - 2/12/2013 1:43:34 PM
Y - Rallying from its 50 DMA line with volume running at an above average pace behind today's considerable gain while trading within close striking distance of its best-ever close. Subsequent losses leading to a damaging 50 DMA line violation or a slump below the recent low ($15.74 on 1/18/13) would raise concerns and trigger technical sell signals.
>>> The latest Featured Stock Update with an annotated graph appeared on 1/31/2013. Click here.
View all notes |
Alert me of new notes |
CANSLIM.net Company Profile |
SEC |
Zacks Reports |
StockTalk |
News |
Chart |
Request a new note
C
A N
S L
I M
|
CMCSA
-
NASDAQ
Comcast Corp Cl A
MEDIA - CATV Systems
|
$38.97
|
+0.33
0.85% |
$39.03
|
17,418,946
144.01% of 50 DAV
50 DAV is 12,095,400
|
$40.28
-3.25%
|
12/3/2012
|
$37.08
|
PP = $38.06
|
|
MB = $39.96
|
Most Recent Note - 2/12/2013 1:45:39 PM
Y - Recently finding support near prior highs and at its 50 DMA line. A damaging violation of the 50 DMA line and latest low ($37.81 on 2/04/13) could trigger technical sell signals.
>>> The latest Featured Stock Update with an annotated graph appeared on 1/29/2013. Click here.
View all notes |
Alert me of new notes |
CANSLIM.net Company Profile |
SEC |
Zacks Reports |
StockTalk |
News |
Chart |
Request a new note
C
A N
S L
I M
|
KORS
-
NYSE
Michael Kors Hldgs Ltd
RETAIL - Apparel Stores
|
$62.00
|
+5.00
8.77% |
$64.80
|
20,887,352
558.53% of 50 DAV
50 DAV is 3,739,700
|
$60.00
3.33%
|
1/23/2013
|
$54.98
|
PP = $58.72
|
|
MB = $61.66
|
Most Recent Note - 2/12/2013 12:33:10 PM
Y - Reported earnings +129% on +70% sales revenues for the Dec '12 quarter versus the year ago period. Today's considerable "breakaway gap" for a new high with heavy volume while blasting above the pivot point triggered a convincing technical buy signal. As previously noted - "A breakaway gap has been noted as the one exception which allows for new buying efforts more than +5% above prior highs, however risk increases the further one chases any stock above prior highs."
>>> The latest Featured Stock Update with an annotated graph appeared on 2/7/2013. Click here.
View all notes |
Alert me of new notes |
CANSLIM.net Company Profile |
SEC |
Zacks Reports |
StockTalk |
News |
Chart |
Request a new note
C
A N
S L
I M
|
LNKD
-
NYSE
Linkedin Corp Class A
INTERNET - Internet Information Providers
|
$155.00
|
-0.41
-0.26% |
$156.27
|
3,490,531
173.92% of 50 DAV
50 DAV is 2,007,000
|
$158.90
-2.46%
|
2/8/2013
|
$147.04
|
PP = $127.55
|
|
MB = $133.93
|
Most Recent Note - 2/12/2013 12:42:02 PM
G - Quickly got very extended from prior highs and its color code was changed to green. It was highlighted in yellow with new pivot point cited based on its 1/28/13 high plus 10 cents in the 2/08/13 mid-day report. See the 2/08/13 analysis for more details and a new annotated graph under the headline "Quickly Extended From Prior Highs Following Big Breakaway Gap".
>>> The latest Featured Stock Update with an annotated graph appeared on 2/8/2013. Click here.
View all notes |
Alert me of new notes |
CANSLIM.net Company Profile |
SEC |
Zacks Reports |
StockTalk |
News |
Chart |
Request a new note
C
A N
S L
I M
|
Symbol/Exchange
Company Name
Industry Group |
PRICE |
CHANGE
(%Change) |
Day High |
Volume
(% DAV)
(% 50 day avg vol) |
52 Wk Hi
% From Hi |
Featured
Date |
Price
Featured |
Pivot Featured |
|
Max Buy |
MIDD
-
NASDAQ
Middleby Corp
MANUFACTURING - Diversified Machinery
|
$148.60
|
-0.65
-0.44% |
$151.49
|
129,868
142.40% of 50 DAV
50 DAV is 91,200
|
$149.84
-0.83%
|
10/8/2012
|
$118.46
|
PP = $122.67
|
|
MB = $128.80
|
Most Recent Note - 2/12/2013 1:47:16 PM
G - Touched another new all-time high today then reversed into the red after getting even more extended from any sound base. Prior highs and its 50 DMA line define important near-term chart support in the $132-134 area.
>>> The latest Featured Stock Update with an annotated graph appeared on 1/30/2013. Click here.
View all notes |
Alert me of new notes |
CANSLIM.net Company Profile |
SEC |
Zacks Reports |
StockTalk |
News |
Chart |
Request a new note
C
A N
S L
I M
|
N
-
NYSE
Netsuite Inc
DIVERSIFIED SERVICES - Business/Management Services
|
$66.24
|
+0.30
0.45% |
$66.76
|
235,928
65.52% of 50 DAV
50 DAV is 360,100
|
$75.75
-12.55%
|
12/12/2012
|
$64.75
|
PP = $67.12
|
|
MB = $70.48
|
Most Recent Note - 2/12/2013 1:50:54 PM
G - Trading near its 50 DMA line ($66.17 now) today, where any more damaging losses may trigger a technical sell signal. Concerns were raised following a worrisome "negative reversal" on 2/01/13 after initially gapping up for a new 52-week high. Recent notes have repeatedly cautioned - "Reported earnings +20% on +33% sales revenues for the Dec '12 quarter, below the +25% minimum earnings guideline (C criteria) raising fundamental concerns."
>>> The latest Featured Stock Update with an annotated graph appeared on 2/5/2013. Click here.
View all notes |
Alert me of new notes |
CANSLIM.net Company Profile |
SEC |
Zacks Reports |
StockTalk |
News |
Chart |
Request a new note
C
A N
S L
I M
|
NP
-
NYSE
Neenah Paper Inc
CONSUMER NON-DURABLES - Paper and Paper Products
|
$29.60
|
-0.06
-0.20% |
$29.81
|
53,883
68.38% of 50 DAV
50 DAV is 78,800
|
$32.57
-9.12%
|
1/25/2013
|
$31.80
|
PP = $31.76
|
|
MB = $33.35
|
Most Recent Note - 2/12/2013 1:53:56 PM
G - As it recently slumped below its pivot point and traded near its 50 DMA line ($29.54 now) defining important chart support, its Relative Strength rating has slumped to a 66, well below the 80+ minimum guideline for buy candidates under the fact-based investment system, and its color code is changed to green. A "negative reversal" for a loss on heavy volume after hitting a new 52-week high on 1/25/13 was noted as a worrisome sign of distributional pressure as it failed to finish strong and did not clinch a technical buy signal.
>>> The latest Featured Stock Update with an annotated graph appeared on 1/25/2013. Click here.
View all notes |
Alert me of new notes |
CANSLIM.net Company Profile |
SEC |
Zacks Reports |
StockTalk |
News |
Chart |
Request a new note
C
A N
S L
I M
|
NSR
-
NYSE
Neustar Inc
TELECOMMUNICATIONS - Diversified Communication Serv
|
$46.55
|
+0.18
0.39% |
$46.62
|
299,434
67.64% of 50 DAV
50 DAV is 442,700
|
$47.24
-1.46%
|
12/11/2012
|
$41.85
|
PP = $41.41
|
|
MB = $43.48
|
Most Recent Note - 2/12/2013 1:55:41 PM
G - Hovering near its 52-week high, holding its ground stubbornly after getting extended from its prior base. Its 50 DMA line (now $43.11) defines near-term support above its prior base.
>>> The latest Featured Stock Update with an annotated graph appeared on 2/1/2013. Click here.
View all notes |
Alert me of new notes |
CANSLIM.net Company Profile |
SEC |
Zacks Reports |
StockTalk |
News |
Chart |
Request a new note
C
A N
S L
I M
|
RAX
-
NYSE
Rackspace Hosting Inc
INTERNET - Internet Software and; Services
|
$74.98
|
-0.05
-0.07% |
$75.37
|
3,527,141
295.65% of 50 DAV
50 DAV is 1,193,000
|
$81.36
-7.84%
|
12/18/2012
|
$71.88
|
PP = $70.10
|
|
MB = $73.61
|
Most Recent Note - 2/11/2013 5:42:58 PM
G - Found support today with a gain backed by above average volume after losses last week tested important chart support at an upward trendline and its 50 DMA line. Recently noted with caution - "It is extended from the previously noted base. Company will announce its fourth quarter 2012 financial results on Tuesday, February 12, 2013 after the close."
>>> The latest Featured Stock Update with an annotated graph appeared on 2/6/2013. Click here.
View all notes |
Alert me of new notes |
CANSLIM.net Company Profile |
SEC |
Zacks Reports |
StockTalk |
News |
Chart |
Request a new note
C
A N
S L
I M
|
Symbol/Exchange
Company Name
Industry Group |
PRICE |
CHANGE
(%Change) |
Day High |
Volume
(% DAV)
(% 50 day avg vol) |
52 Wk Hi
% From Hi |
Featured
Date |
Price
Featured |
Pivot Featured |
|
Max Buy |
RNF
-
NYSE
Rentech Nitrogen Ptnr Lp
CHEMICALS - Agricultural Chemicals
|
$41.72
|
-1.93
-4.42% |
$43.31
|
1,318,282
397.07% of 50 DAV
50 DAV is 332,000
|
$49.18
-15.17%
|
11/1/2012
|
$39.11
|
PP = $40.15
|
|
MB = $42.16
|
Most Recent Note - 2/12/2013 7:45:44 PM
G - Violated its 50 DMA line today with a damaging loss on 4 times average volume triggering a technical sell signal. Only a prompt show of support near that important short-term average and prior highs in the $41 area would be an encouraging sign, but more damaging losses would raise serious concerns and trigger additional worrisome sell signals. See the latest FSU analysis for more details and a new annotated graph.
>>> The latest Featured Stock Update with an annotated graph appeared on 2/12/2013. Click here.
View all notes |
Alert me of new notes |
CANSLIM.net Company Profile |
SEC |
Zacks Reports |
StockTalk |
News |
Chart |
Request a new note
C
A N
S L
I M
|
SFUN
-
NYSE
Soufun Hldgs Ltd Ads A
INTERNET - Internet Information Providers
|
$27.06
|
+0.04
0.15% |
$27.35
|
233,055
73.73% of 50 DAV
50 DAV is 316,100
|
$29.16
-7.20%
|
3/11/2013
|
$27.46
|
PP = $29.26
|
|
MB = $30.72
|
Most Recent Note - 2/11/2013 5:40:24 PM
Y - Highlighted in yellow with pivot point cited based on its 1/08/13 high plus 10 cents in the earlier mid-day report. Disciplined investors may watch for subsequent volume-driven gains to confirm a proper technical buy signal. See the latest FSU analysis for more details and an annotated graph.
>>> The latest Featured Stock Update with an annotated graph appeared on 2/11/2013. Click here.
View all notes |
Alert me of new notes |
CANSLIM.net Company Profile |
SEC |
Zacks Reports |
StockTalk |
News |
Chart |
Request a new note
C
A N
S L
I M
|
VRX
-
NYSE
Valeant Pharmaceuticals
DRUGS - Drug Manufacturers - Other
|
$67.43
|
-0.13
-0.19% |
$67.98
|
842,685
55.84% of 50 DAV
50 DAV is 1,509,000
|
$67.98
-0.81%
|
12/20/2012
|
$60.24
|
PP = $61.21
|
|
MB = $64.27
|
Most Recent Note - 2/8/2013 7:06:03 PM
G - Hit a new 52-week high with lighter than average volume behind today's 4th consecutive gain. It is extended from its prior base, and its 50 DMA coincides with prior highs near $61 defining near-term chart support to watch on pullbacks.
>>> The latest Featured Stock Update with an annotated graph appeared on 1/28/2013. Click here.
View all notes |
Alert me of new notes |
CANSLIM.net Company Profile |
SEC |
Zacks Reports |
StockTalk |
News |
Chart |
Request a new note
C
A N
S L
I M
|
|
|
|
THESE ARE NOT BUY RECOMMENDATIONS!
Comments contained in the body of this report are technical
opinions only. The material herein has been obtained
from sources believed to be reliable and accurate, however,
its accuracy and completeness cannot be guaranteed.
This site is not an investment advisor, hence it does
not endorse or recommend any securities or other investments.
Any recommendation contained in this report may not
be suitable for all investors and it is not to be deemed
an offer or solicitation on our part with respect to
the purchase or sale of any securities. All trademarks,
service marks and trade names appearing in this report
are the property of their respective owners, and are
likewise used for identification purposes only.
This report is a service available
only to active Paid Premium Members.
You may opt-out of receiving report notifications
at any time. Questions or comments may be submitted
by writing to Premium Membership Services 665 S.E. 10 Street, Suite 201 Deerfield Beach, FL 33441-5634 or by calling 1-800-965-8307
or 954-785-1121.
|
|
|

