***Last / Change / Volume data in this table is the closing quote data***
Symbol/Exchange
Company Name
Industry Group |
PRICE |
CHANGE
(%Change) |
Day High |
Volume
(% DAV)
(% 50 day avg vol) |
52 Wk Hi
% From Hi |
Featured
Date |
Price
Featured |
Pivot Featured |
|
Max Buy |
ADS
-
NYSE
Alliance Data Sys Corp
COMPUTER SOFTWARE and SERVICES - Information and Delivery Service
|
$117.88
|
+0.48
0.41% |
$118.00
|
1,506,057
214.66% of 50 DAV
50 DAV is 701,600
|
$117.57
0.26%
|
1/17/2012
|
$108.24
|
PP = $107.43
|
|
MB = $112.80
|
 Most Recent Note - 2/9/2012 4:15:12 PM
G - Inched further above its "max buy" level today with another new volume-driven gain for a new 52-week high. Its 50 DMA line defines support to watch on pullbacks while it is now extended from its latest base.
>>> The latest Featured Stock Update with an annotated graph appeared on 1/17/2012. Click here.
View all notes |
Alert me of new notes |
CANSLIM.net Company Profile |
SEC |
Zacks Reports |
StockTalk |
News |
Chart |
Request a new note
C
A N
S L
I M


|
ALXN
-
NASDAQ
Alexion Pharmaceuticals
DRUGS - Drug Manufacturers - Other
|
$80.41
|
+3.72
4.85% |
$83.10
|
2,365,202
207.66% of 50 DAV
50 DAV is 1,139,000
|
$80.97
-0.69%
|
11/30/2011
|
$68.66
|
PP = $70.52
|
|
MB = $74.05
|
Most Recent Note - 2/9/2012 11:52:37 AM
G - Reported better than expected earnings +58% on +46% sales for the latest quarter ended December 31, 2011 versus the year ago period. Considerable gain earlier today hit a new all-time high, getting more extended from its prior base. Prior resistance in the $70 area defines chart support coinciding with its 50 DMA line.
>>> The latest Featured Stock Update with an annotated graph appeared on 1/13/2012. Click here.
View all notes |
Alert me of new notes |
CANSLIM.net Company Profile |
SEC |
Zacks Reports |
StockTalk |
News |
Chart |
Request a new note
C
A N
S L
I M
|
BODY
-
NASDAQ
Body Central Corp
RETAIL - Catalog andamp; Mail Order Houses
|
$25.81
|
-0.15
-0.58% |
$26.11
|
87,832
57.52% of 50 DAV
50 DAV is 152,700
|
$27.24
-5.25%
|
1/27/2012
|
$26.69
|
PP = $25.46
|
|
MB = $26.73
|
Most Recent Note - 2/7/2012 11:46:14 AM
Y - Rising back above its pivot point with today's gain. Prior highs were noted as initial support to watch on pullbacks.
>>> The latest Featured Stock Update with an annotated graph appeared on 1/27/2012. Click here.
View all notes |
Alert me of new notes |
CANSLIM.net Company Profile |
SEC |
Zacks Reports |
StockTalk |
News |
Chart |
Request a new note
C
A N
S L
I M
|
CATM
-
NASDAQ
Cardtronics Inc
DIVERSIFIED SERVICES - Business/Management Services
|
$26.67
|
+0.03
0.11% |
$26.75
|
314,484
75.31% of 50 DAV
50 DAV is 417,600
|
$28.74
-7.20%
|
12/23/2011
|
$28.64
|
PP = $28.56
|
|
MB = $29.99
|
Most Recent Note - 2/6/2012 2:10:43 PM
G - Gapped down today then managed a positive reversal. Found support after it tested its 200 DMA line last week. Reported earnings +38% on +29% sales revenues for the quarter ended December 31, 2011 versus the year ago period. A rebound above its 50 DMA line is needed for its technical stance and outlook to improve.
>>> The latest Featured Stock Update with an annotated graph appeared on 1/30/2012. Click here.
View all notes |
Alert me of new notes |
CANSLIM.net Company Profile |
SEC |
Zacks Reports |
StockTalk |
News |
Chart |
Request a new note
C
A N
S L
I M
|
CDNS
-
NASDAQ
Cadence Design Systems
COMPUTER SOFTWARE and SERVICES - Technical and System Software
|
$12.00
|
+0.24
2.04% |
$12.00
|
4,276,034
146.84% of 50 DAV
50 DAV is 2,912,000
|
$11.84
1.35%
|
2/3/2012
|
$11.66
|
PP = $11.15
|
|
MB = $11.71
|
Most Recent Note - 2/9/2012 4:28:09 PM
G - Solid gain today with +42% above average volume for a new 52-week high. Its color code is changed to green after rallying above its "max buy" level. No resistance remains due to overhead supply following strong technical action.
>>> The latest Featured Stock Update with an annotated graph appeared on 2/3/2012. Click here.
View all notes |
Alert me of new notes |
CANSLIM.net Company Profile |
SEC |
Zacks Reports |
StockTalk |
News |
Chart |
Request a new note
C
A N
S L
I M
|
Symbol/Exchange
Company Name
Industry Group |
PRICE |
CHANGE
(%Change) |
Day High |
Volume
(% DAV)
(% 50 day avg vol) |
52 Wk Hi
% From Hi |
Featured
Date |
Price
Featured |
Pivot Featured |
|
Max Buy |
CELG
-
NASDAQ
Celgene Corp
DRUGS - Drug Manufacturers - Major
|
$72.00
|
-0.86
-1.18% |
$73.19
|
4,058,728
119.48% of 50 DAV
50 DAV is 3,397,000
|
$75.11
-4.14%
|
2/2/2012
|
$74.16
|
PP = $75.21
|
|
MB = $78.97
|
Most Recent Note - 2/9/2012 4:31:46 PM
Y - Lost ground today with above average volume, encountering distributional pressure. Formed an advanced "3-weeks tight" base pattern and it is still perched within close striking distance of its all-time high ($77.39 in Aug '08). Its 50 DMA line defines initial support above its prior highs in the $68 area.
>>> The latest Featured Stock Update with an annotated graph appeared on 2/2/2012. Click here.
View all notes |
Alert me of new notes |
CANSLIM.net Company Profile |
SEC |
Zacks Reports |
StockTalk |
News |
Chart |
Request a new note
C
A N
S L
I M
|
FEIC
-
NASDAQ
F E I Co
ELECTRONICS - Diversified Electronics
|
$46.50
|
+0.36
0.78% |
$48.31
|
701,537
272.87% of 50 DAV
50 DAV is 257,100
|
$47.04
-1.15%
|
12/7/2011
|
$41.41
|
PP = $42.35
|
|
MB = $44.47
|
Most Recent Note - 2/9/2012 12:14:03 PM
G - Hit a new high today with above average volume behind its 3rd consecutive gain, getting more extended from its prior base. Prior highs in the $43 area define initial chart support.
>>> The latest Featured Stock Update with an annotated graph appeared on 1/25/2012. Click here.
View all notes |
Alert me of new notes |
CANSLIM.net Company Profile |
SEC |
Zacks Reports |
StockTalk |
News |
Chart |
Request a new note
C
A N
S L
I M
|
GNC
-
NYSE
G N C Holdings Inc
RETAIL - Drug Stores
|
$30.00
|
+0.28
0.94% |
$30.32
|
1,276,708
126.29% of 50 DAV
50 DAV is 1,010,900
|
$29.82
0.61%
|
1/19/2012
|
$28.99
|
PP = $29.60
|
|
MB = $31.08
|
Most Recent Note - 2/8/2012 5:43:18 PM
Y - Considerable gain today with +26% above average volume for a new all-time high, clear of all resistance. Volume was below the minimum guideline to trigger a technical buy signal. Disciplined investors will watch for confirming gains with volume before it gets too extended from its prior highs.
>>> The latest Featured Stock Update with an annotated graph appeared on 1/19/2012. Click here.
View all notes |
Alert me of new notes |
CANSLIM.net Company Profile |
SEC |
Zacks Reports |
StockTalk |
News |
Chart |
Request a new note
C
A N
S L
I M
|
GOLD
-
NASDAQ
Randgold Resources Adr
METALS and MINING - Gold
|
$114.45
|
-0.11
-0.10% |
$115.95
|
399,727
69.93% of 50 DAV
50 DAV is 571,600
|
$120.73
-5.20%
|
2/7/2012
|
$116.21
|
PP = $120.83
|
|
MB = $126.87
|
Most Recent Note - 2/8/2012 5:45:58 PM
Y - Quiet volume behind small loss today. Featured in the 2/07/12 mid-day report in yellow with pivot point based on its 52-week high plus 10 cents after a 13-week cup shaped base. Subsequent volume-driven gains into new high territory may trigger a technical buy signal. This UK-headquartered firm in the Mining - Gold/Silver/Gems group showed very strong sales revenues and earnings increases in the Mar, Jun, Sep, and Dec '11 quarterly comparisons much greater than the +25% minimum guideline. See the latest FSU analysis for more details and a new annotated graph.
>>> The latest Featured Stock Update with an annotated graph appeared on 2/8/2012. Click here.
View all notes |
Alert me of new notes |
CANSLIM.net Company Profile |
SEC |
Zacks Reports |
StockTalk |
News |
Chart |
Request a new note
C
A N
S L
I M
|
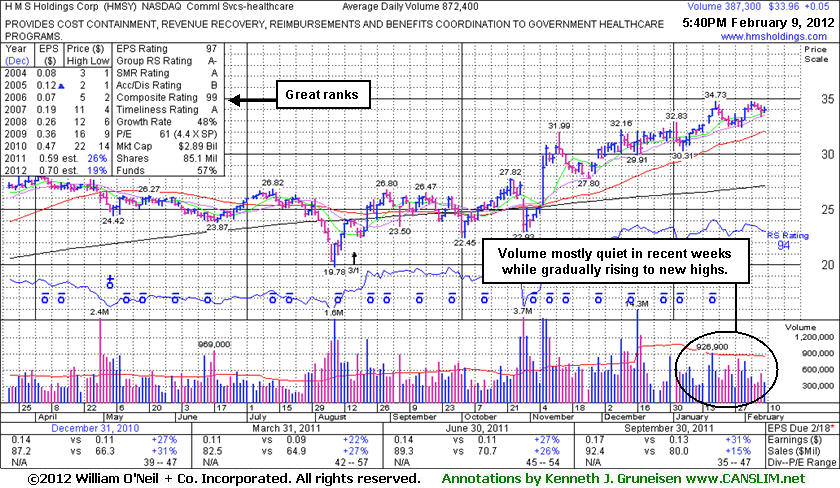
HMSY
-
NASDAQ
H M S Holdings Corp
COMPUTER SOFTWARE and SERVICES - Healthcare Information Service
|
$33.96
|
+0.05
0.15% |
$34.28
|
390,131
45.03% of 50 DAV
50 DAV is 866,400
|
$34.77
-2.33%
|
10/27/2011
|
$26.44
|
PP = $28.37
|
|
MB = $29.79
|
Most Recent Note - 2/9/2012 6:00:07 PM
G - Volume totals have been cooling in recent weeks while hovering near its all-time high. No resistance remains to hinder its progress, but it is extended from its prior base. Its 50 DMA line and prior highs near $32 define near-term chart support to watch. See the latest FSU analysis for additional details and a new annotated graph.
>>> The latest Featured Stock Update with an annotated graph appeared on 2/9/2012. Click here.
View all notes |
Alert me of new notes |
CANSLIM.net Company Profile |
SEC |
Zacks Reports |
StockTalk |
News |
Chart |
Request a new note
C
A N
S L
I M
|
Symbol/Exchange
Company Name
Industry Group |
PRICE |
CHANGE
(%Change) |
Day High |
Volume
(% DAV)
(% 50 day avg vol) |
52 Wk Hi
% From Hi |
Featured
Date |
Price
Featured |
Pivot Featured |
|
Max Buy |
ISRG
-
NASDAQ
Intuitive Surgical Inc
HEALTH SERVICES - Medical Appliances and Equipment
|
$492.41
|
+0.50
0.10% |
$493.52
|
243,779
64.59% of 50 DAV
50 DAV is 377,400
|
$495.53
-0.63%
|
12/20/2011
|
$442.43
|
PP = $449.16
|
|
MB = $471.62
|
Most Recent Note - 2/3/2012 1:23:41 PM
G - Up again today for its 4th consecutive gain and another new all-time high. Color code was changed to green after rallying beyond the "max buy" level that was cited. Reported earnings +24% on +28% sales revenues for the quarter ended December 31, 2011 versus the year ago period.
>>> The latest Featured Stock Update with an annotated graph appeared on 1/18/2012. Click here.
View all notes |
Alert me of new notes |
CANSLIM.net Company Profile |
SEC |
Zacks Reports |
StockTalk |
News |
Chart |
Request a new note
C
A N
S L
I M
|
LULU
-
NASDAQ
Lululemon Athletica
MANUFACTURING - Textile Manufacturing
|
$65.66
|
+0.89
1.37% |
$65.79
|
1,693,204
45.40% of 50 DAV
50 DAV is 3,729,600
|
$65.45
0.32%
|
1/10/2012
|
$60.97
|
PP = $59.46
|
|
MB = $62.43
|
Most Recent Note - 2/9/2012 4:24:25 PM
G - Finished at an all-time high as it inched higher with another gain today backed by below average volume. No resistance remains due to overhead supply, but it is extended from the base pattern previously noted.
>>> The latest Featured Stock Update with an annotated graph appeared on 1/10/2012. Click here.
View all notes |
Alert me of new notes |
CANSLIM.net Company Profile |
SEC |
Zacks Reports |
StockTalk |
News |
Chart |
Request a new note
C
A N
S L
I M
|
MA
-
NYSE
Mastercard Inc Cl A
DIVERSIFIED SERVICES - Business/Management Services
|
$396.40
|
+1.49
0.38% |
$401.79
|
999,902
90.87% of 50 DAV
50 DAV is 1,100,400
|
$395.16
0.31%
|
2/2/2012
|
$379.05
|
PP = $381.32
|
|
MB = $400.39
|
Most Recent Note - 2/3/2012 6:32:14 PM
Y - Hit new 52-week and all-time highs with above average volume behind today's 6th consecutive gain. It rallied above the new pivot point cited and triggered a technical buy signal, breaking out from a "double bottom" base pattern. Reported earnings +28% on +20% sales revenues for the quarter ended December 31, 2011 versus the year ago period.
>>> The latest Featured Stock Update with an annotated graph appeared on 1/3/2012. Click here.
View all notes |
Alert me of new notes |
CANSLIM.net Company Profile |
SEC |
Zacks Reports |
StockTalk |
News |
Chart |
Request a new note
C
A N
S L
I M
|
MELI
-
NASDAQ
Mercadolibre Inc
INTERNET - Internet Software and; Services
|
$94.23
|
+0.28
0.30% |
$95.98
|
289,916
54.63% of 50 DAV
50 DAV is 530,700
|
$98.75
-4.58%
|
2/6/2012
|
$97.09
|
PP = $95.58
|
|
MB = $100.36
|
Most Recent Note - 2/6/2012 6:47:17 PM
Y - Color code was changed to yellow with new pivot point cited based on its 12/06/11 high plus 10 cents after an 8-week cup shaped base without a handle. Reversed into the red after touching a new all-time high today following 3 consecutive gains with above average volume. Technically it broke out on 2/03/12 with its volume-driven gain and strong close. See the latest FSU analysis for more details and a new annotated graph.
>>> The latest Featured Stock Update with an annotated graph appeared on 2/6/2012. Click here.
View all notes |
Alert me of new notes |
CANSLIM.net Company Profile |
SEC |
Zacks Reports |
StockTalk |
News |
Chart |
Request a new note
C
A N
S L
I M
|
MKTX
-
NASDAQ
Marketaxess Holdings Inc
FINANCIAL SERVICES - Investment Brokerage - Nationa
|
$32.04
|
-0.36
-1.11% |
$32.65
|
249,032
135.93% of 50 DAV
50 DAV is 183,200
|
$35.42
-9.54%
|
10/28/2011
|
$29.79
|
PP = $31.05
|
|
MB = $32.60
|
Most Recent Note - 2/6/2012 2:07:45 PM
G - Pulling back today following a streak of 4 consecutive gains into new high territory. Prior highs in the $31-32 area define initial chart support to watch.
>>> The latest Featured Stock Update with an annotated graph appeared on 1/24/2012. Click here.
View all notes |
Alert me of new notes |
CANSLIM.net Company Profile |
SEC |
Zacks Reports |
StockTalk |
News |
Chart |
Request a new note
C
A N
S L
I M
|
Symbol/Exchange
Company Name
Industry Group |
PRICE |
CHANGE
(%Change) |
Day High |
Volume
(% DAV)
(% 50 day avg vol) |
52 Wk Hi
% From Hi |
Featured
Date |
Price
Featured |
Pivot Featured |
|
Max Buy |
OSIS
-
NASDAQ
O S I Systems Inc
ELECTRONICS - Semiconductor Equipment and Mate
|
$53.35
|
-1.37
-2.50% |
$54.97
|
61,459
62.65% of 50 DAV
50 DAV is 98,100
|
$57.51
-7.23%
|
11/1/2011
|
$42.07
|
PP = $45.57
|
|
MB = $47.85
|
Most Recent Note - 2/9/2012 4:05:08 PM
G - Down today on light volume, now consolidating -6.9% off its all-time high. Reported earnings +20% on +11% sales revenues for the Dec '11 quarter, which raised concerns as earnings growth was below the +25% minimum earnings guideline.
>>> The latest Featured Stock Update with an annotated graph appeared on 1/31/2012. Click here.
View all notes |
Alert me of new notes |
CANSLIM.net Company Profile |
SEC |
Zacks Reports |
StockTalk |
News |
Chart |
Request a new note
C
A N
S L
I M
|
PRGO
-
NASDAQ
Perrigo Co
DRUGS - Drug Related Products
|
$94.05
|
+0.11
0.11% |
$94.45
|
871,464
63.65% of 50 DAV
50 DAV is 1,369,200
|
$104.70
-10.17%
|
12/9/2011
|
$99.54
|
PP = $101.56
|
|
MB = $106.64
|
Most Recent Note - 2/3/2012 6:40:09 PM
G - Halted its slide today with a gain on higher volume, meanwhile its Relative Strength rank slumped to 77, falling below the minimum guideline for buy candidates under the fact-based system and raising concerns. Its 200 DMA line defines important near-term support, as that long-term average acted as support in prior months while it endured distributional pressure.
>>> The latest Featured Stock Update with an annotated graph appeared on 1/9/2012. Click here.
View all notes |
Alert me of new notes |
CANSLIM.net Company Profile |
SEC |
Zacks Reports |
StockTalk |
News |
Chart |
Request a new note
C
A N
S L
I M
|
RAX
-
NYSE
Rackspace Hosting Inc
INTERNET - Internet Software and; Services
|
$49.65
|
+0.61
1.24% |
$50.38
|
1,913,656
117.32% of 50 DAV
50 DAV is 1,631,100
|
$49.94
-0.58%
|
2/2/2012
|
$46.69
|
PP = $45.55
|
|
MB = $47.83
|
Most Recent Note - 2/6/2012 2:21:11 PM
G - Up again today for another new all-time high and its color code is changed to green after getting slightly extended from the previously noted orderly flat base. Prior highs in the $45 area define initial support to watch on pullbacks.
>>> The latest Featured Stock Update with an annotated graph appeared on 1/5/2012. Click here.
View all notes |
Alert me of new notes |
CANSLIM.net Company Profile |
SEC |
Zacks Reports |
StockTalk |
News |
Chart |
Request a new note
C
A N
S L
I M
|
STMP
-
NASDAQ
Stamps.Com Inc
INTERNET - Internet Software and Services
|
$32.01
|
+0.00
0.00% |
$32.14
|
637,276
175.03% of 50 DAV
50 DAV is 364,100
|
$33.73
-5.10%
|
2/7/2012
|
$32.88
|
PP = $32.91
|
|
MB = $34.56
|
Most Recent Note - 2/9/2012 4:20:04 PM
Y - Churning above average volume this week without making progress above the pivot point cited based on its 1/27/12 high. The price/volume action suggests that it has encountered resistance near its 52-week high, meanwhile a strong gain above its pivot point may trigger a technical buy signal,
>>> The latest Featured Stock Update with an annotated graph appeared on 2/7/2012. Click here.
View all notes |
Alert me of new notes |
CANSLIM.net Company Profile |
SEC |
Zacks Reports |
StockTalk |
News |
Chart |
Request a new note
C
A N
S L
I M
|
SWI
-
NYSE
Solarwinds Inc
COMPUTER SOFTWARE and SERVICES - Application Software
|
$37.45
|
+0.86
2.35% |
$37.79
|
1,833,685
164.25% of 50 DAV
50 DAV is 1,116,400
|
$37.37
0.21%
|
1/26/2012
|
$32.36
|
PP = $33.78
|
|
MB = $35.47
|
Most Recent Note - 2/9/2012 4:22:09 PM
G - Hit another new all-time high with today's volume-driven gain adding to its recent spurt, getting more extended from its latest base. No resistance remains due to overhead supply. Reported earnings +21% on +34% sales revenues for the quarter ended December 31, 2011 versus the year ago period. Earnings below the +25% guideline raise fundamental concerns.
>>> The latest Featured Stock Update with an annotated graph appeared on 1/26/2012. Click here.
View all notes |
Alert me of new notes |
CANSLIM.net Company Profile |
SEC |
Zacks Reports |
StockTalk |
News |
Chart |
Request a new note
C
A N
S L
I M
|
Symbol/Exchange
Company Name
Industry Group |
PRICE |
CHANGE
(%Change) |
Day High |
Volume
(% DAV)
(% 50 day avg vol) |
52 Wk Hi
% From Hi |
Featured
Date |
Price
Featured |
Pivot Featured |
|
Max Buy |
SXCI
-
NASDAQ
S X C Health Solutions
COMPUTER SOFTWARE and SERVICES - Healthcare Information Service
|
$61.92
|
-0.69
-1.09% |
$63.06
|
303,798
90.93% of 50 DAV
50 DAV is 334,100
|
$66.40
-6.75%
|
1/10/2012
|
$62.05
|
PP = $60.10
|
|
MB = $63.11
|
Most Recent Note - 2/8/2012 5:47:39 PM
G - Considerable gain today with above average volume, rebounding from prior highs in the $60 area and its 50 DMA line previously noted as chart support to watch on pullbacks.
>>> The latest Featured Stock Update with an annotated graph appeared on 1/20/2012. Click here.
View all notes |
Alert me of new notes |
CANSLIM.net Company Profile |
SEC |
Zacks Reports |
StockTalk |
News |
Chart |
Request a new note
C
A N
S L
I M
|
TDG
-
NYSE
Transdigm Group Inc
AEROSPACE/DEFENSE - Aerospace/Defense Products and; Services
|
$116.11
|
+0.11
0.09% |
$118.45
|
472,736
141.83% of 50 DAV
50 DAV is 333,300
|
$116.88
-0.66%
|
1/10/2012
|
$98.83
|
PP = $102.83
|
|
MB = $107.97
|
Most Recent Note - 2/8/2012 1:11:58 PM
G - Color code is changed to green while trading up further above its "max buy" level today after a considerable volume-driven gain into new high territory. No overhead supply remains to act as resistance. Prior highs near $102 define the initial support level to watch above its 50 DMA line.
>>> The latest Featured Stock Update with an annotated graph appeared on 1/4/2012. Click here.
View all notes |
Alert me of new notes |
CANSLIM.net Company Profile |
SEC |
Zacks Reports |
StockTalk |
News |
Chart |
Request a new note
C
A N
S L
I M
|
TSCO
-
NASDAQ
Tractor Supply Co
SPECIALTY RETAIL - Specialty Retail, Other
|
$83.31
|
-0.14
-0.17% |
$84.29
|
537,630
71.50% of 50 DAV
50 DAV is 751,900
|
$87.13
-4.38%
|
1/12/2012
|
$79.12
|
PP = $75.58
|
|
MB = $79.36
|
Most Recent Note - 2/8/2012 5:38:39 PM
G - Pulled back today on average volume following a considerable gain with above average volume for a new all-time high. Reported earnings +43% on +20% sales revenues for the quarter ended December 31, 2011 versus the year ago period. Prior highs in the mid-$70s which were a resistance area now define initial support to watch on pullbacks.
>>> The latest Featured Stock Update with an annotated graph appeared on 1/12/2012. Click here.
View all notes |
Alert me of new notes |
CANSLIM.net Company Profile |
SEC |
Zacks Reports |
StockTalk |
News |
Chart |
Request a new note
C
A N
S L
I M
|
UBNT
-
NASDAQ
Ubiquiti Networks Inc
TELECOMMUNICATIONS - Diversified Communication Serv
|
$24.83
|
+1.37
5.84% |
$25.00
|
274,091
103.35% of 50 DAV
50 DAV is 265,200
|
$27.23
-8.81%
|
1/27/2012
|
$22.25
|
PP = $23.14
|
|
MB = $24.30
|
Most Recent Note - 2/9/2012 4:09:28 PM
G - Overcame early weakness and managed a positive reversal today, finishing near the session high with a solid gain on near average volume. Prior highs in the $23 area define initial support to watch on pullbacks.
>>> The latest Featured Stock Update with an annotated graph appeared on 2/1/2012. Click here.
View all notes |
Alert me of new notes |
CANSLIM.net Company Profile |
SEC |
Zacks Reports |
StockTalk |
News |
Chart |
Request a new note
C
A N
S L
I M
|
ULTA
-
NASDAQ
Ulta Salon Cosm & Frag
SPECIALTY RETAIL - Specialty Retail, Other
|
$81.42
|
+0.81
1.00% |
$81.50
|
1,191,231
134.63% of 50 DAV
50 DAV is 884,800
|
$81.25
0.21%
|
1/11/2012
|
$71.97
|
PP = $75.80
|
|
MB = $79.59
|
Most Recent Note - 2/9/2012 4:11:17 PM
G - Inched to another new all-time high today with a small gain backed by +31% above average volume. Color code was changed to green after wedging up from a riskier late-stage base without sufficient volume to trigger a proper technical buy signal. Prior lows near $64 define important chart support above its 200 DMA line.
>>> The latest Featured Stock Update with an annotated graph appeared on 1/11/2012. Click here.
View all notes |
Alert me of new notes |
CANSLIM.net Company Profile |
SEC |
Zacks Reports |
StockTalk |
News |
Chart |
Request a new note
C
A N
S L
I M
|
Symbol/Exchange
Company Name
Industry Group |
PRICE |
CHANGE
(%Change) |
Day High |
Volume
(% DAV)
(% 50 day avg vol) |
52 Wk Hi
% From Hi |
Featured
Date |
Price
Featured |
Pivot Featured |
|
Max Buy |
V
-
NYSE
Visa Inc Cl A
DIVERSIFIED SERVICES - Business/Management Services
|
$112.42
|
+4.07
3.76% |
$114.90
|
9,899,195
257.56% of 50 DAV
50 DAV is 3,843,400
|
$108.64
3.48%
|
2/2/2012
|
$105.43
|
PP = $104.30
|
|
MB = $109.52
|
Most Recent Note - 2/9/2012 12:53:04 PM
G - Off earlier highs following a considerable gap up gain to a new all-time high. Its color code was changed to green after rallying beyond its "max buy" level. Leadership (L criteria) in the group of Finance -Credit Card Payment Processing firms is a reassuring sign. Prior highs in the $103-104 area define initial support.
>>> The latest Featured Stock Update with an annotated graph appeared on 1/23/2012. Click here.
View all notes |
Alert me of new notes |
CANSLIM.net Company Profile |
SEC |
Zacks Reports |
StockTalk |
News |
Chart |
Request a new note
C
A N
S L
I M
|