You are not logged in.
This means you
CAN ONLY VIEW reports that were published prior to Sunday, February 25, 2024.
You
MUST UPGRADE YOUR MEMBERSHIP if you want to see any current reports.
AFTER MARKET UPDATE - MONDAY, JANUARY 31ST, 2022
Previous After Market Report Next After Market Report >>>
|
|
|
|
DOW |
+406.39 |
35,131.86 |
+1.17% |
|
Volume |
1,401,466,696 |
+32% |
|
Volume |
5,086,465,000 |
+3% |
|
NASDAQ |
+469.31 |
14,239.88 |
+3.41% |
|
Advancers |
2,673 |
81% |
|
Advancers |
3,564 |
82% |
|
S&P 500 |
+83.70 |
4,515.55 |
+1.89% |
|
Decliners |
621 |
19% |
|
Decliners |
804 |
18% |
|
Russell 2000 |
+59.94 |
2,028.45 |
+3.05% |
|
52 Wk Highs |
26 |
|
|
52 Wk Highs |
34 |
|
|
S&P 600 |
+27.37 |
1,299.23 |
+2.15% |
|
52 Wk Lows |
118 |
|
|
52 Wk Lows |
212 |
|
|
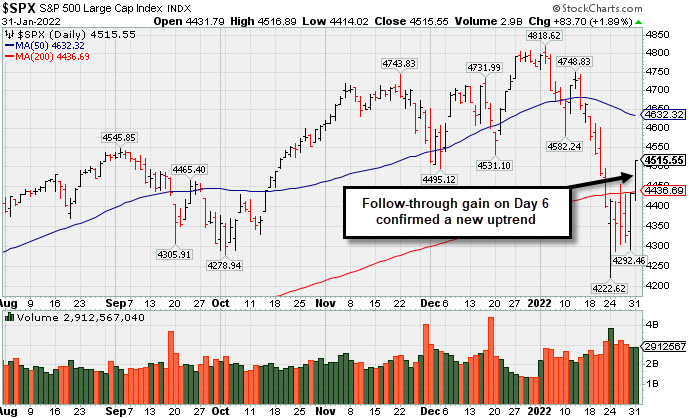
Disciplined investors may note Monday's follow-through day in the market (M criteria) confirmed a new uptrend. New buying efforts may be made in stocks fitting all key criteria of the fact-based investment system.
|
 |
Major Averages Confirmed New Uptrend With Follow-Though Gains
Kenneth J. Gruneisen - Passed the CAN SLIM® Master's Exam
The S&P 500 climbed 1.9%, and the Nasdaq Composite jumped 3.4%, with the two benchmarks trimming their January declines to 5.3% and 9%, respectively, still their biggest monthly drawdowns since March 2020. The Dow added 406 points, bringing its monthly loss to 3.3%, its worst showing since November. Volume totals reported were higher than the prior session on the NYSE and on the Nasdaq exchange, indicative of an increase in buying demand coming from the institutional crowd. Advancers led decliners by more than a 4-1 margin on the NYSE and on the Nasdaq exchange. There were 11 high-ranked companies from the Leaders List that hit new 52-week highs and were listed on the BreakOuts Page, versus 6 on the prior session. There was an increase in new 52-week highs totals on both the NYSE and Nasdaq exchanges, however, new 52-week lows still outnumbered new highs. Solid gains for the Nasdaq Composite (+3.4%) and S&P 500 Index (+1.9%) with higher volume coupled with greater leadership marked a follow-through day confirming a new uptrend for the market averages (M criteria). PICTURED: The S&P 500 Index posted a big gain with higher volume on day 6 of the rally attempt. Investors using the fact-based investment system may recognize the action as a sound follow-through day confirming a new uptrend.
U.S. stocks finished higher on Monday as Wall Street ended a turbulent month on a positive note. Jitters surrounding the Federal Reserve’s (Fed) pivot away from pandemic-era monetary stimulus whipsawed equities over the past several weeks. Policymakers have signaled the first rate hike since 2018 will likely come in March, but the exact cadence and size of rate increases remains uncertain.
Treasuries were little changed, with the yield on the 10-year note steady at 1.79%, though still 28 basis points (0.28%) higher year-to-date. In commodities, West Texas Intermediate crude settled up 1.7% to $88.32/barrel, capping its best month since February 2021 (+17.5%) as geopolitical tensions have exacerbated already tight supply conditions.
All 11 S&P 500 sectors closed in positive territory, with growth-related shares among the standouts. Netflix Inc. (NFLX +11.1%) and Tesla Inc. (TSLA +10.7%) rallied following separate analyst upgrades. Elsewhere, Citrix Systems Inc. (CTXS -3.4%) fell on news the cloud-computing company would be purchased by private equity firms Elliott Investment Management and Vista Equity Partners for $13 billion in the first major leveraged buyout of 2022.
On the data front, a measure of business activity in the Chicago Fed region unexpectedly strengthened in January, while an update from the Dallas Fed showed manufacturing activity in the region eased during the same period to the lowest level since July 2020. |
 Kenneth J. Gruneisen started out as a licensed stockbroker in August 1987, a couple of months prior to the historic stock market crash that took the Dow Jones Industrial Average down -22.6% in a single day. He has published daily fact-based fundamental and technical analysis on high-ranked stocks online for two decades. Through FACTBASEDINVESTING.COM, Kenneth provides educational articles, news, market commentary, and other information regarding proven investment systems that work in good times and bad.
Comments contained in the body of this report are technical opinions only and are not necessarily those of Gruneisen Growth Corp. The material herein has been obtained from sources believed to be reliable and accurate, however, its accuracy and completeness cannot be guaranteed. Our firm, employees, and customers may effect transactions, including transactions contrary to any recommendation herein, or have positions in the securities mentioned herein or options with respect thereto. Any recommendation contained in this report may not be suitable for all investors and it is not to be deemed an offer or solicitation on our part with respect to the purchase or sale of any securities. |
|
 |
Tech, Retail, Broker/Dealer, and Gold & Silver Indexes Rose
Kenneth J. Gruneisen - Passed the CAN SLIM® Master's Exam
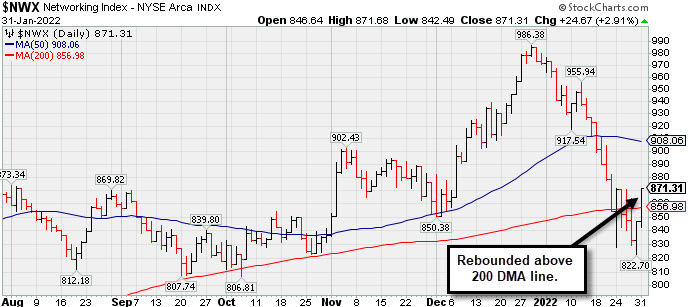
The Retail Index ($RLX +2.60%) and Broker/Dealer Index ($XBD +2.73%) posted influential gains and the Bank Index ($BKX +0.42%) also edged higher. The Semiconductor Index ($SOX +5.44%) led the tech sector rally while the Biotech Index ($BTK +2.55%) and Networking Index ($NWX +2.91%) each also posted a solid gain. Commodity-linked groups were mixed as the Gold & Silver Index ($XAU +3.24%) posted a solid gain while the Integrated Oil Index ($XOI +0.24%) also inched higher, but the Oil Services Index ($OSX -1.27%) lost ground. PICTURED: The Networking Index ($NWX +2.91%) managed to rebound above its 200-day moving average (DMA) line.
| Oil Services |
$OSX |
64.31 |
-0.83 |
-1.27% |
+21.98% |
| Integrated Oil |
$XOI |
1,385.74 |
+3.36 |
+0.24% |
+17.62% |
| Semiconductor |
$SOX |
3,483.21 |
+179.81 |
+5.44% |
-11.73% |
| Networking |
$NWX |
871.31 |
+24.67 |
+2.91% |
-10.27% |
| Broker/Dealer |
$XBD |
480.84 |
+12.79 |
+2.73% |
-1.24% |
| Retail |
$RLX |
3,803.08 |
+96.21 |
+2.60% |
-10.02% |
| Gold & Silver |
$XAU |
125.01 |
+3.92 |
+3.24% |
-5.62% |
| Bank |
$BKX |
134.98 |
+0.57 |
+0.42% |
+2.09% |
| Biotech |
$BTK |
5,076.91 |
+126.28 |
+2.55% |
-8.00% |
|
|
|
 |
Consolidating Above 50-Day Moving Average
Kenneth J. Gruneisen - Passed the CAN SLIM® Master's Exam
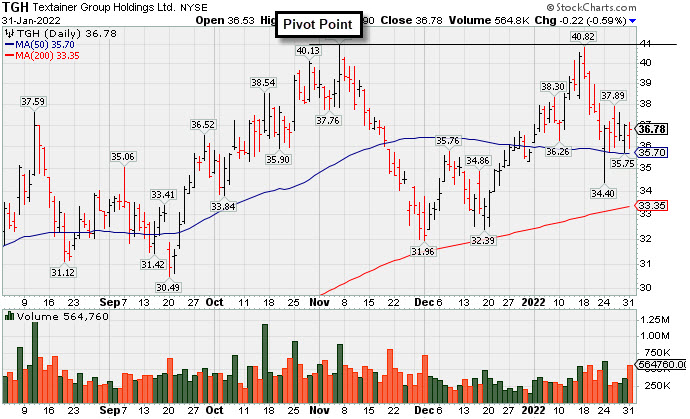
Textainer Group Holdings (TGH -$0.22 or -0.59% to $36.78) was highlighted in yellow with pivot point cited based on its 11/05/21 high plus 10 cents in the earlier mid-day report (read here). It churned higher volume but ended the day lower, a sign of distributional pressure. It is consolidating above its 50-day moving average (DMA) line ($35.75) after recently challenging its 52-week high. Some resistance remains due to overhead supply. Subsequent gains above the pivot point backed by at least +40% above average volume are needed to trigger a technical buy signal.
TGH was last shown in greater detail on November 10th with an annotated graph, "Perched Near High With Strong Fundamentals". It found support at its 200 DMA line during its consolidation after dropped from the Featured Stocks list on 11/26/21.
Fundamentals remain strong. TGH has the highest possible Earnings Per Share Rating of 99. It recently reported Sep '21 quarterly earnings +271% on +31% sales revenues versus the year ago period, its 6th strong earnings comparison. Sales revenues growth has been improving and accelerating in the 4 latest quarterly comparisons, a strong match with regard to the fact-based investment system's fundamental guidelines. Annual earnings (A criteria) history has been strong after a downturn and loss in FY '16.
It hails from the Commercial Services - Leasing industry group which is currently ranked 68th on the 197 Industry Groups list (L criteria). There are 49.3 million shares outstanding (S criteria) which can contribute to greater price volatility in the event of institutional buying or selling. The number of top-rated funds owning its shares has risen from 294 in Dec '20 to 338 in Dec '21, a reassuring sign concerning the I criteria. It has a Timeliness rating of A and an Accumulation/Distribution rating of D. |
|
|
Color Codes Explained :
Y - Better candidates highlighted by our
staff of experts.
G - Previously featured
in past reports as yellow but may no longer be buyable under the
guidelines.
***Last / Change / Volume data in this table is the closing quote data***
|
|
|
THESE ARE NOT BUY RECOMMENDATIONS!
Comments contained in the body of this report are technical
opinions only. The material herein has been obtained
from sources believed to be reliable and accurate, however,
its accuracy and completeness cannot be guaranteed.
This site is not an investment advisor, hence it does
not endorse or recommend any securities or other investments.
Any recommendation contained in this report may not
be suitable for all investors and it is not to be deemed
an offer or solicitation on our part with respect to
the purchase or sale of any securities. All trademarks,
service marks and trade names appearing in this report
are the property of their respective owners, and are
likewise used for identification purposes only.
This report is a service available
only to active Paid Premium Members.
You may opt-out of receiving report notifications
at any time. Questions or comments may be submitted
by writing to Premium Membership Services 665 S.E. 10 Street, Suite 201 Deerfield Beach, FL 33441-5634 or by calling 1-800-965-8307
or 954-785-1121.
|
|
|