You are not logged in.
This means you
CAN ONLY VIEW reports that were published prior to Tuesday, April 1, 2025.
You
MUST UPGRADE YOUR MEMBERSHIP if you want to see any current reports.
AFTER MARKET UPDATE - FRIDAY, JANUARY 28TH, 2022
Previous After Market Report Next After Market Report >>>
|
|
|
|
DOW |
+564.69 |
34,725.47 |
+1.65% |
|
Volume |
1,063,426,469 |
-1% |
|
Volume |
4,956,655,100 |
-4% |
|
NASDAQ |
+417.79 |
13,770.57 |
+3.13% |
|
Advancers |
2,217 |
68% |
|
Advancers |
2,808 |
65% |
|
S&P 500 |
+105.34 |
4,431.85 |
+2.43% |
|
Decliners |
1,042 |
32% |
|
Decliners |
1,493 |
35% |
|
Russell 2000 |
+37.22 |
1,968.51 |
+1.93% |
|
52 Wk Highs |
10 |
|
|
52 Wk Highs |
20 |
|
|
S&P 600 |
+19.37 |
1,271.86 |
+1.55% |
|
52 Wk Lows |
542 |
|
|
52 Wk Lows |
1,152 |
|
|
 |
Major Averages Rose With Less Leadership and Lackluster Volume
Kenneth J. Gruneisen - Passed the CAN SLIM® Master's Exam
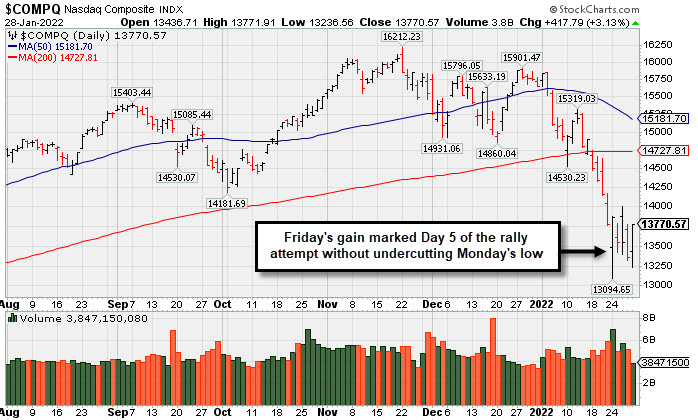
The major averages notched their best session of the year, with the Dow’s 564-point increase propelling the blue chip index 1.3% higher on the week. The S&P 500 climbed 2.4%, its best day since June 2020, ending in positive territory for the first time in the past four weeks (+0.8%). Still, the broad benchmark remains on course for its worst month since March 2020 (-7% month-to-date). The Nasdaq Composite’s 3.1% rally shockingly left the tech-heavy index unchanged on the week. Volume totals reported were lighter than the prior session on the NYSE and on the Nasdaq exchange, revealing lackluster buying demand coming from the institutional crowd. Advancers led decliners by more than a 2-1 margin on the NYSE and nearly 2-1 on the Nasdaq exchange. There were 6 high-ranked companies from the Leaders List that hit new 52-week highs and were listed on the BreakOuts Page, versus 10 on the prior session. New 52-week lows totals swelled again and easily outnumbered shrinking new 52-week highs totals on the NYSE and on the Nasdaq exchange. The market averages (M criteria) have seen damaging losses noted that signaled a more serious market correction. Greater caution is suggested until noted strength returns. PICTURED: The Nasdaq Composite Index posted a gain on Friday with lighter volume, which marked Day 5 of the rally attempt without undercutting Monday's low. At Monday's low it was -19.2% off its November 22nd record high. Investors should remain patient and disciplined, as the fact-based investment system's most ideal time is between Day 4-7 for a follow-through day to confirm a new uptrend.
U.S. stocks finished a turbulent week on a high note Friday as solid earnings reports helped Tech shares rebound. Ten of 11 S&P 500 sectors finished in positive territory, with Tech shares leading the advance (+4.3%) on strong earnings. Apple Inc. (AAPL +6.98%) jumped after delivering record sales despite ongoing supply chain issues. Meanwhile, Visa Inc. (V +10.60%) surged after posting its own record revenue.
Treasuries recovered some of their recent rout, with the yield on the 10-year note down two basis points (0.02%) to 1.79%, though still 28 basis points (0.28%) higher year-to-date. On the data front, personal spending decreased 0.6% last month, the worst reading since February 2021. Separately, the core PCE deflator (the Fed’s preferred proxy for inflation) surged the most since 1983 (+4.9% year-over-year) in December. In commodities, West Texas Intermediate crude settled at $87.15/barrel, capping its sixth straight weekly gain.
Jitters surrounding the Federal Reserve’s (Fed) pivot away from pandemic-era monetary stimulus whipsawed equities this week. On Wednesday, policymakers signaled the first interest rate hike since 2018 would likely come in March, and subsequent hawkish commentary from Fed Chair Jerome Powell only added to market uncertainty. |
 Kenneth J. Gruneisen started out as a licensed stockbroker in August 1987, a couple of months prior to the historic stock market crash that took the Dow Jones Industrial Average down -22.6% in a single day. He has published daily fact-based fundamental and technical analysis on high-ranked stocks online for two decades. Through FACTBASEDINVESTING.COM, Kenneth provides educational articles, news, market commentary, and other information regarding proven investment systems that work in good times and bad.
Comments contained in the body of this report are technical opinions only and are not necessarily those of Gruneisen Growth Corp. The material herein has been obtained from sources believed to be reliable and accurate, however, its accuracy and completeness cannot be guaranteed. Our firm, employees, and customers may effect transactions, including transactions contrary to any recommendation herein, or have positions in the securities mentioned herein or options with respect thereto. Any recommendation contained in this report may not be suitable for all investors and it is not to be deemed an offer or solicitation on our part with respect to the purchase or sale of any securities. |
|
 |
Retail, Financial, and Tech Indexes Rose
Kenneth J. Gruneisen - Passed the CAN SLIM® Master's Exam
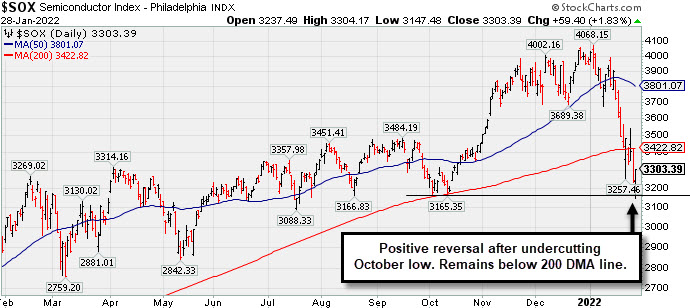
The Retail Index ($RLX +2.81%) posted a solid gain and financials also had a positive influence on the major averages on Friday as the Broker/Dealer Index ($XBD +1.69%) and Bank Index ($BKX +1.03%) rose. The Biotech Index ($BTK +3.34%) led the tech sector higher while the Semiconductor Index ($SOX +1.83%) and Networking Index ($NWX +1.68%) also posted solid gains. The Oil Services Index ($OSX +0.70%) rose while the Integrated Oil Index ($XOI -0.71%) and the Gold & Silver Index ($XAU -0.86%) lost ground. PICTURED: The Semiconductor Index ($SOX +1.83%) managed a "positive reversal" on Friday after undercutting the October low and slumping -22.6% below its January 4th record high. It remains below its 200-day moving average (DMA) line.
| Oil Services |
$OSX |
65.14 |
+0.45 |
+0.70% |
+23.55% |
| Integrated Oil |
$XOI |
1,382.38 |
-9.93 |
-0.71% |
+17.33% |
| Semiconductor |
$SOX |
3,303.39 |
+59.40 |
+1.83% |
-16.29% |
| Networking |
$NWX |
846.64 |
+14.01 |
+1.68% |
-12.81% |
| Broker/Dealer |
$XBD |
468.05 |
+7.80 |
+1.69% |
-3.86% |
| Retail |
$RLX |
3,706.87 |
+101.21 |
+2.81% |
-12.29% |
| Gold & Silver |
$XAU |
121.09 |
-1.05 |
-0.86% |
-8.58% |
| Bank |
$BKX |
134.42 |
+1.37 |
+1.03% |
+1.66% |
| Biotech |
$BTK |
4,950.63 |
+159.79 |
+3.34% |
-10.29% |
|
|
|
 |
Featured Stocks
Kenneth J. Gruneisen - Passed the CAN SLIM® Master's Exam
|
|
|
Color Codes Explained :
Y - Better candidates highlighted by our
staff of experts.
G - Previously featured
in past reports as yellow but may no longer be buyable under the
guidelines.
***Last / Change / Volume data in this table is the closing quote data***
|
|
|
THESE ARE NOT BUY RECOMMENDATIONS!
Comments contained in the body of this report are technical
opinions only. The material herein has been obtained
from sources believed to be reliable and accurate, however,
its accuracy and completeness cannot be guaranteed.
This site is not an investment advisor, hence it does
not endorse or recommend any securities or other investments.
Any recommendation contained in this report may not
be suitable for all investors and it is not to be deemed
an offer or solicitation on our part with respect to
the purchase or sale of any securities. All trademarks,
service marks and trade names appearing in this report
are the property of their respective owners, and are
likewise used for identification purposes only.
This report is a service available
only to active Paid Premium Members.
You may opt-out of receiving report notifications
at any time. Questions or comments may be submitted
by writing to Premium Membership Services 665 S.E. 10 Street, Suite 201 Deerfield Beach, FL 33441-5634 or by calling 1-800-965-8307
or 954-785-1121.
|
|
|