You are not logged in.
This means you
CAN ONLY VIEW reports that were published prior to Monday, April 14, 2025.
You
MUST UPGRADE YOUR MEMBERSHIP if you want to see any current reports.
AFTER MARKET UPDATE - MONDAY, JANUARY 27TH, 2014
Previous After Market Report Next After Market Report >>>
|
|
|
|
DOW |
-41.23 |
15,837.88 |
-0.26% |
|
Volume |
763,637,040 |
-15% |
|
Volume |
2,272,247,980 |
-3% |
|
NASDAQ |
-44.56 |
4,083.61 |
-1.08% |
|
Advancers |
795 |
25% |
|
Advancers |
589 |
22% |
|
S&P 500 |
-8.73 |
1,781.56 |
-0.49% |
|
Decliners |
2,278 |
72% |
|
Decliners |
2,036 |
76% |
|
Russell 2000 |
-16.41 |
1,127.73 |
-1.43% |
|
52 Wk Highs |
25 |
|
|
52 Wk Highs |
41 |
|
|
S&P 600 |
-8.26 |
639.17 |
-1.28% |
|
52 Wk Lows |
75 |
|
|
52 Wk Lows |
47 |
|
|
 |
Stocks Erased Gains to Sink Again While Leadership Evaporated
Kenneth J. Gruneisen - Passed the CAN SLIM® Master's Exam
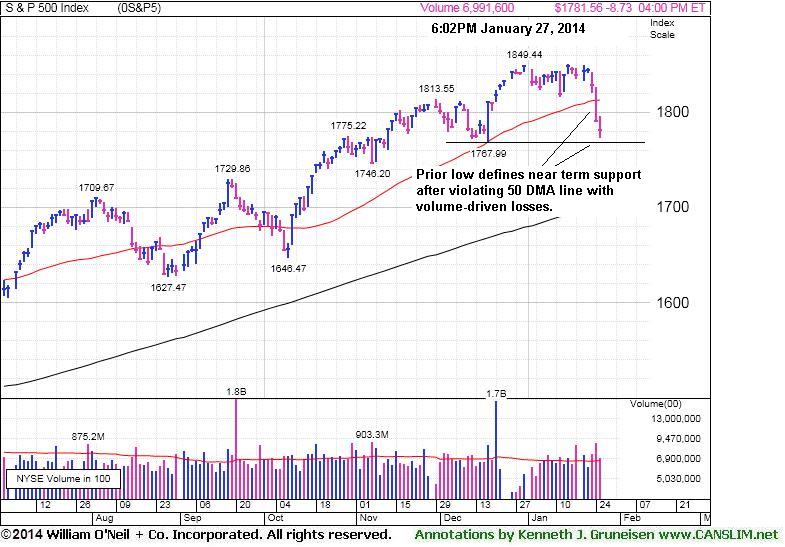
The major averages lost ground but ended well above the session lows on Monday. The volume totals were reported lighter than the prior trading session's volume totals on the NYSE and on the Nasdaq exchange, so at least the institutional crowd was not increasing their selling efforts. Breadth was negative as decliners led advancers by about 3-1 on the NYSE and on the Nasdaq exchange. There were only 2 high-ranked companies from the CANSLIM.net Leaders List that made new 52-week highs and appeared on the CANSLIM.net BreakOuts Page, down from a total of 7 stocks on the prior session. The list of stocks hitting new 52-week lows outnumbered new highs on the NYSE and on the Nasdaq exchange. There were losses for 17 of the 18 high-ranked companies currently included on the Featured Stocks Page. The Market (M criteria) has encountered distributional pressure and leadership (stocks hitting new highs) has waned, earning the label of being in another "correction". Such weakness serves as a reminder for investors to use caution and remain disciplined in following proper sell rules under the fact-based investment system to reduce market exposure.
Early enthusiasm faded while concerns rose about emerging markets and disappointing news on the housing market. Home sales for December came in lower than expected at a seasonally-adjusted annual rate of 414,000. That was down from November's revised sales of 445,000 units and below analysts' estimates of 457,000. December’s sales marked the second-consecutive monthly decline, but followed a surprisingly large 14.9% jump in October.
Caterpillar (CAT +5.94%) helped the Dow after the company announced better-than-expected earnings and revenue and new plans for a $10 billion stock repurchase plan to run through 2018. Royal Caribbean (RCL +1.93%) beat estimates and gave encouraging guidance.
After the bell all eyes were on Apple Inc (AAPL +0.81%) earnings. Investors were hoping for the results to be bolstered by strong sales of the iPhone in China based on the new deal with China's largest carrier, China Mobile Ltd (CHL -0.14%) .
Tomorrow morning, Dow component, Pfizer (PFE -1.43%), along with Ford (F -0.76%) and Comcast (CMCSA +0.17%) are expected to report.
Investors should be watchful for any individual issues flashing technical sell signals. The CANSLIM.net Featured Stocks Page shows the most action-worthy candidates and their latest notes and a Headline Link directs members to the latest detailed analysis with data-packed graphs annotated by a Certified expert along with links to additional resources. The Premium Member Homepage includes "dynamic archives" to all prior pay reports published. Watch for an announcement via email concerning the next WEBCAST.
PICTURED: The S&P 500 Index violated its 50-day moving average (DMA) line with a volume-driven loss on Friday and is now slumping toward prior lows defining the next near-term support level. Damaging losses are viewed as a worrisome sign that the market conditions are eroding, further reminding investors to stand ready to reduce their market exposure.
|
 Kenneth J. Gruneisen started out as a licensed stockbroker in August 1987, a couple of months prior to the historic stock market crash that took the Dow Jones Industrial Average down -22.6% in a single day. He has published daily fact-based fundamental and technical analysis on high-ranked stocks online for two decades. Through FACTBASEDINVESTING.COM, Kenneth provides educational articles, news, market commentary, and other information regarding proven investment systems that work in good times and bad.
Comments contained in the body of this report are technical opinions only and are not necessarily those of Gruneisen Growth Corp. The material herein has been obtained from sources believed to be reliable and accurate, however, its accuracy and completeness cannot be guaranteed. Our firm, employees, and customers may effect transactions, including transactions contrary to any recommendation herein, or have positions in the securities mentioned herein or options with respect thereto. Any recommendation contained in this report may not be suitable for all investors and it is not to be deemed an offer or solicitation on our part with respect to the purchase or sale of any securities. |
|
 |
Commodity-Linked, Financial, and Tech Indexes Fell
Kenneth J. Gruneisen - Passed the CAN SLIM® Master's Exam
The Gold & Silver Index ($XAU -3.34%) was a standout decliner while there were widespread losses weighing on most groups on Monday. The Biotechnology Index ($BTK -2.19%) led the tech sector's retreat while the Semiconductor Index ($SOX -0.68%) ended with a smaller loss, however the Networking Index ($NWX +0.43%) eked out a small gain. The Broker/Dealer Index ($XBD -2.13%) was down worse than the Bank Index ($BKX -0.73%), and the Retail Index ($RLX -0.39%) also added a small drag on the major averages. Energy-related shares also had a neagtive drift as the Oil Services Index ($OSX -0.61%) and the Integrated Oil Index ($XOI -0.38%) edged lower.
Charts courtesy www.stockcharts.com
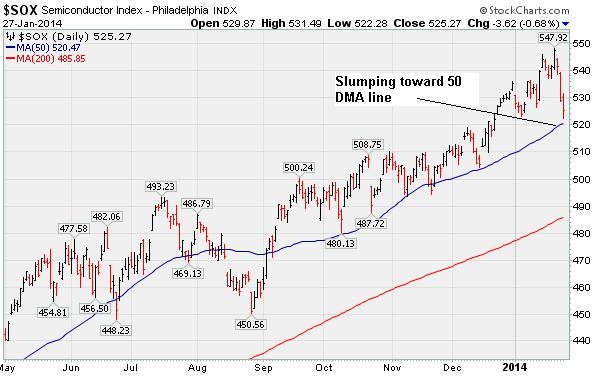
PICTURED: The Semiconductor Index ($SOX -0.68%) is slumping toward its 50-day moving average (DMA) line.
| Oil Services |
$OSX |
265.39 |
-1.62 |
-0.61% |
-5.57% |
| Integrated Oil |
$XOI |
1,425.98 |
-5.41 |
-0.38% |
-5.13% |
| Semiconductor |
$SOX |
525.27 |
-3.62 |
-0.68% |
-1.82% |
| Networking |
$NWX |
331.35 |
+1.40 |
+0.43% |
+2.29% |
| Broker/Dealer |
$XBD |
153.86 |
-3.35 |
-2.13% |
-4.17% |
| Retail |
$RLX |
889.09 |
-3.49 |
-0.39% |
-5.40% |
| Gold & Silver |
$XAU |
89.58 |
-3.10 |
-3.34% |
+6.45% |
| Bank |
$BKX |
67.94 |
-0.50 |
-0.73% |
-1.91% |
| Biotech |
$BTK |
2,471.23 |
-55.44 |
-2.19% |
+6.04% |
|
|
|
 |
Forming New Base But Enduring Distributional Pressure
Kenneth J. Gruneisen - Passed the CAN SLIM® Master's Exam
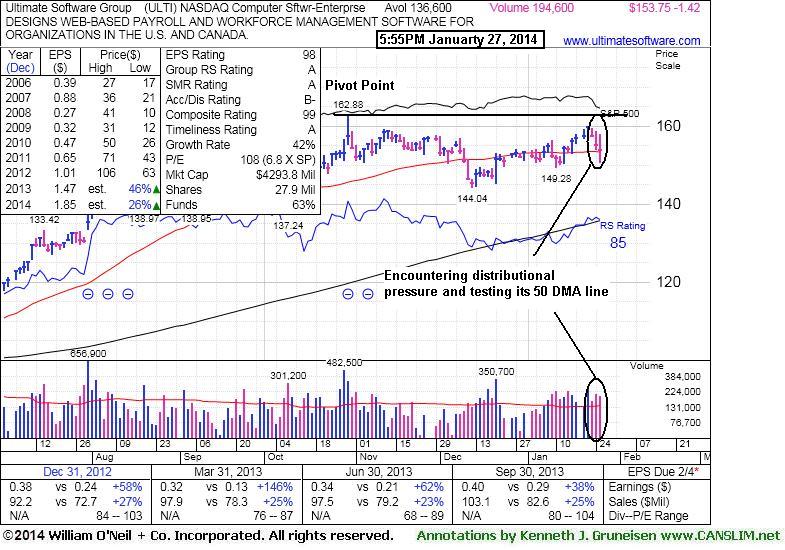
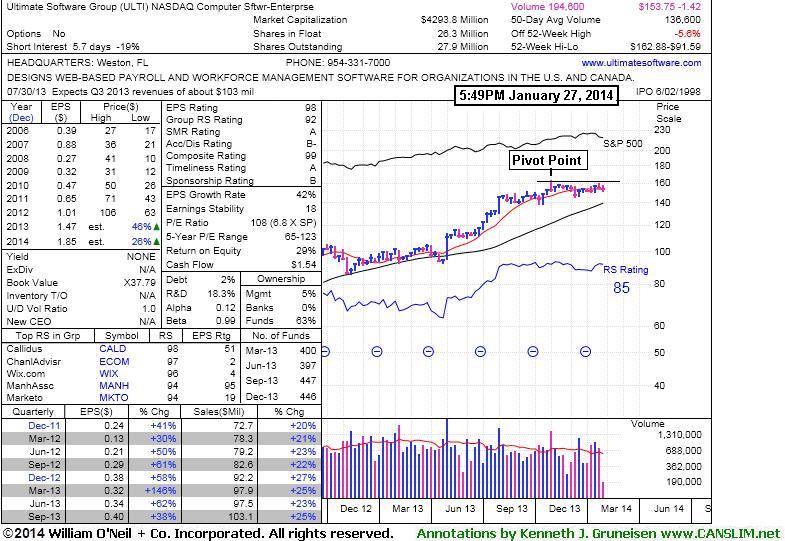
Ultimate Software Group (ULTI -$1.42 or +0.92% to $153.75) has recently been encountering distributional pressure while testing support at its 50-day moving average (DMA) line. A new pivot point has been cited based on its 10/30/13 high plus 10 cents. Subsequent volume-driven gains above the pivot point are needed to trigger a proper new technical buy signal. Meanwhile, deterioration below the 50 DMA line would raise concerns and hurt its outlook.
The company is due to report 2013 fourth quarter and year-end financial results after 4:00PM on February 4, 2014. Keep in mind that volume and volatility often increase near earnings news. Its last appearance in this FSU section was on 12/26/13 under the headline, "Gain on Light Volume While Inching Above 50-Day Average", when a finish just above its 50-day moving average (DMA) line helped its technical stance improve.
The Computer Software - Enterprise firm's Relative Strength rating of 85 now, above 80+ minimum level for buy candidates. Subsequent deterioration below its recent low ($144.04 on 12/12/13) would raise serious concerns and trigger more worrisome technical sell signals.
It made limited headway since highlighted in yellow with pivot point cited based on its 9/19/13 high plus 10 cents in the mid-day report on 10/16/13 (read here). Since then it reported earnings +38% on +25% sales revenues for the Sep '13 quarter, continuing its strong earnings history satisfying the C and A criteria. The number of top-rated funds owning its shares rose from 395 in Dec '12 to 446 funds as of Dec '13, a reassuring trend in place concerning the I criteria. Its small supply of only 26.3 million shares (S criteria) in the public float can contribute to greater price volatility in the event of institutional buying or selling. Disciplined investors avoid chasing stocks extended more than +5% above prior highs and always limit losses by selling if any stock falls more than -7% from their purchase price.
|
|
|
Color Codes Explained :
Y - Better candidates highlighted by our
staff of experts.
G - Previously featured
in past reports as yellow but may no longer be buyable under the
guidelines.
***Last / Change / Volume data in this table is the closing quote data***
Symbol/Exchange
Company Name
Industry Group |
PRICE |
CHANGE
(%Change) |
Day High |
Volume
(% DAV)
(% 50 day avg vol) |
52 Wk Hi
% From Hi |
Featured
Date |
Price
Featured |
Pivot Featured |
|
Max Buy |
ARMH
-
NASDAQ
A R M Holdings Plc Ads
ELECTRONICS - Semiconductor - Specialized
|
$47.65
|
-0.24
-0.50% |
$48.28
|
1,506,291
95.38% of 50 DAV
50 DAV is 1,579,300
|
$55.26
-13.77%
|
12/23/2013
|
$54.59
|
PP = $52.48
|
|
MB = $55.10
|
Most Recent Note - 1/24/2014 5:57:46 PM
G - Its 50 DMA line acted as resistance and its Relative Strength rating has slumped to 60, below the 80+ minimum for buy candidates. See the latest FSU analysis for more details and new annotated graphs.
>>> FEATURED STOCK ARTICLE : Relative Strength Waned and 50-Day Average Acted as Resistance - 1/24/2014
View all notes |
Set NEW NOTE alert |
CANSLIM.net Company Profile |
SEC
News |
Chart |
Request a new note
C
A N
S L
I M


|
BITA
-
NYSE
Bitauto Hldgs Ltd Ads
INTERNET - Internet Information Providers
|
$28.67
|
-3.10
-9.76% |
$31.88
|
2,367,579
173.98% of 50 DAV
50 DAV is 1,360,800
|
$39.84
-28.04%
|
1/8/2014
|
$33.00
|
PP = $35.14
|
|
MB = $36.90
|
 Most Recent Note - 1/27/2014 7:03:46 PM
Violated it 50 DMA line while suffering a 3rd consecutive big volume-driven loss triggering a technical sell signal. It will be dropped from the Featured Stocks list tonight due to weak technical action.
>>> FEATURED STOCK ARTICLE : Finished Strong and Challenged Pivot Point After Highlighted in Mid-Day Report - 1/8/2014
View all notes |
Set NEW NOTE alert |
CANSLIM.net Company Profile |
SEC
News |
Chart |
Request a new note
C
A N
S L
I M
|
CELG
-
NASDAQ
Celgene Corp
DRUGS - Drug Manufacturers - Major
|
$156.27
|
-4.95
-3.07% |
$161.00
|
5,352,983
199.09% of 50 DAV
50 DAV is 2,688,700
|
$174.66
-10.53%
|
9/12/2013
|
$149.50
|
PP = $150.02
|
|
MB = $157.52
|
Most Recent Note - 1/27/2014 12:15:14 PM
G - Down considerably today undercutting prior lows in the $157 area raising greater concerns. Violated its 50 DMA line on the prior session triggering technical sell signals.
>>> FEATURED STOCK ARTICLE : Found Support Above 50-Day Average After Gapping Down on Prior Session - 1/7/2014
View all notes |
Set NEW NOTE alert |
CANSLIM.net Company Profile |
SEC
News |
Chart |
Request a new note
C
A N
S L
I M
|
EGOV
-
NASDAQ
N I C Inc
INTERNET - Internet Software and Services
|
$22.48
|
-0.41
-1.79% |
$23.05
|
140,979
55.70% of 50 DAV
50 DAV is 253,100
|
$25.99
-13.51%
|
12/20/2013
|
$24.00
|
PP = $26.09
|
|
MB = $27.39
|
Most Recent Note - 1/21/2014 3:18:49 PM
G - Quietly sputtering below its 50 DMA line. A rally above recent resistance in the $25-26 area is needed for its technical stance to turn bullish. Meanwhile, a violation of the recent low ($22.17 on 12/16/13) would raise concern as that level defines near-term support above its 200 DMA line.
>>> FEATURED STOCK ARTICLE : Rebounded Above 50-Day Average; Relative Strength Rating Waned - 12/27/2013
View all notes |
Set NEW NOTE alert |
CANSLIM.net Company Profile |
SEC
News |
Chart |
Request a new note
C
A N
S L
I M
|
EQM
-
NYSE
E Q T Midstream Partners
ENERGY - Oil and Gas Pipelines
|
$61.96
|
-0.77
-1.23% |
$63.46
|
151,249
141.35% of 50 DAV
50 DAV is 107,000
|
$63.66
-2.67%
|
12/12/2013
|
$53.17
|
PP = $56.51
|
|
MB = $59.34
|
Most Recent Note - 1/24/2014 4:19:48 PM
G - Stubbornly holding its ground while very extended from any sound base pattern. Prior highs in the $56 area define support to watch on pullbacks.
>>> FEATURED STOCK ARTICLE : Extended From Base After Six Consecutive Weekly Gains - 1/17/2014
View all notes |
Set NEW NOTE alert |
CANSLIM.net Company Profile |
SEC
News |
Chart |
Request a new note
C
A N
S L
I M
|
Symbol/Exchange
Company Name
Industry Group |
PRICE |
CHANGE
(%Change) |
Day High |
Volume
(% DAV)
(% 50 day avg vol) |
52 Wk Hi
% From Hi |
Featured
Date |
Price
Featured |
Pivot Featured |
|
Max Buy |
FB
-
NASDAQ
Facebook Inc Cl A
INTERNET
|
$53.55
|
-0.90
-1.65% |
$54.94
|
74,021,925
115.75% of 50 DAV
50 DAV is 63,948,100
|
$59.31
-9.71%
|
12/12/2013
|
$51.40
|
PP = $54.93
|
|
MB = $57.68
|
Most Recent Note - 1/24/2014 4:21:17 PM
G - Pulled back from its 52-week high with today's 3rd consecutive gain on light volume. Disciplined investors always limit losses by selling any stock that falls more than -7% from their purchase price.
>>> FEATURED STOCK ARTICLE : Following New Offering Prior Highs Acted As Support - 1/15/2014
View all notes |
Set NEW NOTE alert |
CANSLIM.net Company Profile |
SEC
News |
Chart |
Request a new note
C
A N
S L
I M
|
JAZZ
-
NASDAQ
Jazz Pharmaceuticals Plc
DRUGS - Biotechnology
|
$142.71
|
-6.48
-4.34% |
$149.98
|
2,411,981
309.15% of 50 DAV
50 DAV is 780,200
|
$159.14
-10.32%
|
9/30/2013
|
$93.20
|
PP = $89.10
|
|
MB = $93.56
|
Most Recent Note - 1/27/2014 12:39:08 PM
G - Abruptly retreating from its 52-week high with a 2nd consecutive big loss on above average volume. Its 50 DMA line ($125.03 now) defines important support to watch on pullbacks.
>>> FEATURED STOCK ARTICLE : Very Extended From Sound Base Following Big Volume-Driven Gains - 1/14/2014
View all notes |
Set NEW NOTE alert |
CANSLIM.net Company Profile |
SEC
News |
Chart |
Request a new note
C
A N
S L
I M
|
KORS
-
NYSE
Michael Kors Hldgs Ltd
RETAIL - Apparel Stores
|
$81.09
|
+1.02
1.27% |
$81.65
|
3,884,073
92.53% of 50 DAV
50 DAV is 4,197,800
|
$84.58
-4.13%
|
8/6/2013
|
$69.66
|
PP = $66.28
|
|
MB = $69.59
|
Most Recent Note - 1/24/2014 4:22:47 PM
G - Encountering resistance and remaining below its 50 DMA line. Losses on higher volume indicate distributional pressure. Reports quarterly financial results on Tuesday, February 4, 2014, before the market opens.
>>> FEATURED STOCK ARTICLE : Technical Deterioration and RS Rating Slump Raises Concerns - 1/9/2014
View all notes |
Set NEW NOTE alert |
CANSLIM.net Company Profile |
SEC
News |
Chart |
Request a new note
C
A N
S L
I M
|
MRLN
-
NASDAQ
Marlin Business Services
DIVERSIFIED SERVICES - Rental and Leasing Services
|
$26.59
|
-1.17
-4.21% |
$27.75
|
30,900
96.56% of 50 DAV
50 DAV is 32,000
|
$29.58
-10.11%
|
12/19/2013
|
$26.69
|
PP = $28.74
|
|
MB = $30.18
|
Most Recent Note - 1/27/2014 4:44:49 PM
Y - Slumped back into the prior base and finished near the session low today raising concerns. Disciplined investor always limit losses by selling any stock that falls more than -7% from their purchase price.
>>> FEATURED STOCK ARTICLE : Hovering Near 52-Week High Following Technical Breakout - 1/22/2014
View all notes |
Set NEW NOTE alert |
CANSLIM.net Company Profile |
SEC
News |
Chart |
Request a new note
C
A N
S L
I M
|
PCLN
-
NASDAQ
Priceline.Com Inc
INTERNET - Internet Software and Services
|
$1,143.24
|
-36.69
-3.11% |
$1,186.99
|
1,203,702
203.57% of 50 DAV
50 DAV is 591,300
|
$1,214.97
-5.90%
|
12/18/2013
|
$1,156.20
|
PP = $1,198.85
|
|
MB = $1,258.79
|
Most Recent Note - 1/27/2014 12:50:20 PM
G - Slumping below its 50 DMA line today with a 3rd consecutive loss raising concerns. Its color code is changed to green, and the prior low ($1,113.01 on 1/06/13) defines near-term support to watch. Did not trigger a technical buy signal since recently featured in yellow.
>>> FEATURED STOCK ARTICLE : Managed Positive Reversal at 50-Day Moving Average Line - 1/6/2014
View all notes |
Set NEW NOTE alert |
CANSLIM.net Company Profile |
SEC
News |
Chart |
Request a new note
C
A N
S L
I M
|
Symbol/Exchange
Company Name
Industry Group |
PRICE |
CHANGE
(%Change) |
Day High |
Volume
(% DAV)
(% 50 day avg vol) |
52 Wk Hi
% From Hi |
Featured
Date |
Price
Featured |
Pivot Featured |
|
Max Buy |
RGR
-
NYSE
Sturm Ruger & Co Inc
CONSUMER DURABLES - Sporting Goods
|
$73.59
|
-0.26
-0.35% |
$75.24
|
336,941
99.25% of 50 DAV
50 DAV is 339,500
|
$85.93
-14.36%
|
1/8/2014
|
$78.87
|
PP = $80.38
|
|
MB = $84.40
|
Most Recent Note - 1/24/2014 4:12:59 PM
G- Violated its 50 DMA line with today's loss on higher volume triggering a technical sell signal. Color code is changed to green. A prompt rebound above the 50 DMA line is needed for its outlook to improve. Disciplined investors always limit losses by selling any stock if it falls more than -7% from their purchase price."
>>> FEATURED STOCK ARTICLE : Hit New Highs With 6th Consecutive Gain - 1/13/2014
View all notes |
Set NEW NOTE alert |
CANSLIM.net Company Profile |
SEC
News |
Chart |
Request a new note
C
A N
S L
I M
|
SFUN
-
NYSE
Soufun Hldgs Ltd Ads A
INTERNET - Internet Information Providers
|
$79.16
|
-2.41
-2.95% |
$82.75
|
1,844,696
157.61% of 50 DAV
50 DAV is 1,170,400
|
$95.39
-17.01%
|
10/17/2013
|
$58.02
|
PP = $53.87
|
|
MB = $56.56
|
Most Recent Note - 1/24/2014 11:33:48 AM
G - Gapped down for a 2nd consecutive session today, retreating from its all-time high after getting very extended from any sound base. Its 50 DMA line ($76.97 now) defines important support to watch.
>>> FEATURED STOCK ARTICLE : Extended From Base Following More Volume-Driven Gains - 1/10/2014
View all notes |
Set NEW NOTE alert |
CANSLIM.net Company Profile |
SEC
News |
Chart |
Request a new note
C
A N
S L
I M
|
SILC
-
NASDAQ
Silicom Ltd
COMPUTER HARDWARE - Networking andamp; Communication Dev
|
$60.88
|
-0.12
-0.20% |
$61.58
|
237,857
691.44% of 50 DAV
50 DAV is 34,400
|
$62.67
-2.86%
|
12/23/2013
|
$44.62
|
PP = $46.25
|
|
MB = $48.56
|
Most Recent Note - 1/27/2014 12:57:22 PM
G - Still holding its ground following a considerable gap up and volume-driven gain for a new 52-week high on 1/23/14 after reporting earnings +92% on +52% sales for the Dec '13 quarter, beating consensus estimates. It is extended from any sound base.
>>> FEATURED STOCK ARTICLE : Considerable Gap Up Following Strong Earnings Report - 1/23/2014
View all notes |
Set NEW NOTE alert |
CANSLIM.net Company Profile |
SEC
News |
Chart |
Request a new note
C
A N
S L
I M
|
SSNC
-
NASDAQ
S S & C Technologies
COMPUTER SOFTWARE and SERVICES - Application Software
|
$42.54
|
-0.15
-0.35% |
$43.19
|
251,148
95.42% of 50 DAV
50 DAV is 263,200
|
$46.61
-8.72%
|
10/22/2013
|
$39.17
|
PP = $40.04
|
|
MB = $42.04
|
Most Recent Note - 1/22/2014 5:34:13 PM
G - Halted its slide above its 50 DMA line today while tallying a volume-driven gain. Recently enduring distributional pressure. More damaging losses would raise greater concerns.
>>> FEATURED STOCK ARTICLE : Enduring Distributional Pressure While Retreating Near Prior Highs - 1/16/2014
View all notes |
Set NEW NOTE alert |
CANSLIM.net Company Profile |
SEC
News |
Chart |
Request a new note
C
A N
S L
I M
|
ULTI
-
NASDAQ
Ultimate Software Group
INTERNET - Internet Software and Services
|
$153.75
|
-1.42
-0.92% |
$157.89
|
194,689
143.36% of 50 DAV
50 DAV is 135,800
|
$162.88
-5.61%
|
1/27/2014
|
$153.75
|
PP = $162.98
|
|
MB = $171.13
|
Most Recent Note - 1/27/2014 6:55:04 PM
Y - Color code is changed to yellow with new pivot point cited based on its 10/30/13 high plus 10 cents. Enduring distributional pressure while trading near its 50 DMA line. See the latest FSU analysis for more details and new annotated daily and weekly graphs.
>>> FEATURED STOCK ARTICLE : Forming New Base But Enduring Distributional Pressure - 1/27/2014
View all notes |
Set NEW NOTE alert |
CANSLIM.net Company Profile |
SEC
News |
Chart |
Request a new note
C
A N
S L
I M
|
Symbol/Exchange
Company Name
Industry Group |
PRICE |
CHANGE
(%Change) |
Day High |
Volume
(% DAV)
(% 50 day avg vol) |
52 Wk Hi
% From Hi |
Featured
Date |
Price
Featured |
Pivot Featured |
|
Max Buy |
VRX
-
NYSE
Valeant Pharmaceuticals
DRUGS - Drug Manufacturers - Other
|
$131.00
|
-1.12
-0.85% |
$133.56
|
1,638,355
141.84% of 50 DAV
50 DAV is 1,155,100
|
$140.36
-6.67%
|
9/11/2013
|
$100.26
|
PP = $105.50
|
|
MB = $110.78
|
Most Recent Note - 1/21/2014 5:22:41 PM
G - Touched a new all-time high then reversed into the red today. It is extended from any sound base after volume-driven gains. Its 50 DMA line and prior highs near $115 define near-term support to watch. See the latest FSU analysis for more details and new annotated graphs.
>>> FEATURED STOCK ARTICLE : Bullish Action Has Continued Despite Fundamental Concerns - 1/21/2014
View all notes |
Set NEW NOTE alert |
CANSLIM.net Company Profile |
SEC
News |
Chart |
Request a new note
C
A N
S L
I M
|
YNDX
-
NASDAQ
Yandex N V Class A
INTERNET - Internet Information Providers
|
$37.22
|
-0.80
-2.10% |
$38.43
|
7,020,490
299.46% of 50 DAV
50 DAV is 2,344,400
|
$45.42
-18.05%
|
11/27/2013
|
$39.61
|
PP = $42.10
|
|
MB = $44.21
|
Most Recent Note - 1/27/2014 6:58:02 PM
Finished in the middle of its intra-day range yet down for a 4th consecutive loss on ever-increasing volume. A rebound above the 50 DMA line is needed for its outlook to improve. It will be dropped from the Featured Stocks list due to technical deterioration.
>>> FEATURED STOCK ARTICLE : Best Ever Close With Gain on Light Volume - 12/31/2013
View all notes |
Set NEW NOTE alert |
CANSLIM.net Company Profile |
SEC
News |
Chart |
Request a new note
C
A N
S L
I M
|
YY
-
NASDAQ
YY Inc Ads
INTERNET - Internet Service Providers
|
$56.99
|
-2.80
-4.68% |
$61.90
|
3,190,749
218.74% of 50 DAV
50 DAV is 1,458,700
|
$72.78
-21.70%
|
1/3/2014
|
$55.08
|
PP = $56.85
|
|
MB = $59.69
|
Most Recent Note - 1/27/2014 7:05:20 PM
It will be dropped from the Featured Stocks list tonight. Down today for a 4th big loss with above average volume in the span of 5 sessions, enduring damaging distributional pressure amid widespread weakness in China-related companies. Prior highs in the $56 area define initial support to watch above its 50 DMA line ($54.77 now).
>>> FEATURED STOCK ARTICLE : Finished Strong With High Volume After Featured in Mid-Day Report - 1/3/2014
View all notes |
Set NEW NOTE alert |
CANSLIM.net Company Profile |
SEC
News |
Chart |
Request a new note
C
A N
S L
I M
|
|
|
|
THESE ARE NOT BUY RECOMMENDATIONS!
Comments contained in the body of this report are technical
opinions only. The material herein has been obtained
from sources believed to be reliable and accurate, however,
its accuracy and completeness cannot be guaranteed.
This site is not an investment advisor, hence it does
not endorse or recommend any securities or other investments.
Any recommendation contained in this report may not
be suitable for all investors and it is not to be deemed
an offer or solicitation on our part with respect to
the purchase or sale of any securities. All trademarks,
service marks and trade names appearing in this report
are the property of their respective owners, and are
likewise used for identification purposes only.
This report is a service available
only to active Paid Premium Members.
You may opt-out of receiving report notifications
at any time. Questions or comments may be submitted
by writing to Premium Membership Services 665 S.E. 10 Street, Suite 201 Deerfield Beach, FL 33441-5634 or by calling 1-800-965-8307
or 954-785-1121.
|
|
|

