You are not logged in.
This means you
CAN ONLY VIEW reports that were published prior to Thursday, April 10, 2025.
You
MUST UPGRADE YOUR MEMBERSHIP if you want to see any current reports.
AFTER MARKET UPDATE - TUESDAY, JANUARY 28TH, 2014
Previous After Market Report Next After Market Report >>>
|
|
|
|
DOW |
+90.68 |
15,928.56 |
+0.57% |
|
Volume |
608,898,090 |
-20% |
|
Volume |
1,866,675,030 |
-18% |
|
NASDAQ |
+14.34 |
4,097.95 |
+0.35% |
|
Advancers |
2,277 |
72% |
|
Advancers |
1,753 |
65% |
|
S&P 500 |
+10.94 |
1,792.50 |
+0.61% |
|
Decliners |
762 |
24% |
|
Decliners |
854 |
32% |
|
Russell 2000 |
+10.51 |
1,138.24 |
+0.93% |
|
52 Wk Highs |
27 |
|
|
52 Wk Highs |
41 |
|
|
S&P 600 |
+5.17 |
644.34 |
+0.81% |
|
52 Wk Lows |
41 |
|
|
52 Wk Lows |
23 |
|
|
 |
Major Averages Rose With Lighter Volume
Kenneth J. Gruneisen - Passed the CAN SLIM® Master's Exam
The major averages finished higher on Tuesday's session. The volume totals were reported lighter than the prior trading session's volume totals on the NYSE and on the Nasdaq exchange, so the institutional crowd was not increasing their buying efforts. Breadth was positive as advancers led decliners by about 3-1 on the NYSE and 2-1 on the Nasdaq exchange. There were 7 high-ranked companies from the CANSLIM.net Leaders List that made new 52-week highs and appeared on the CANSLIM.net BreakOuts Page, up from a total of 2 stocks on the prior session. The list of stocks hitting new 52-week lows outnumbered new highs on the NYSE while new highs outnumbered new lows on the Nasdaq exchange. There were gains for 11 of the 15 high-ranked companies currently included on the Featured Stocks Page. The Market (M criteria) has encountered distributional pressure and leadership (stocks hitting new highs) has waned, earning the label of being in another "correction". Such weakness serves as a reminder for investors to use caution and remain disciplined in following proper sell rules under the fact-based investment system to reduce market exposure.
The Dow Jones Industrial Average gained 90 points to 15,928, snapping a five-session losing streak. The S&P 500 added more than 10 points to 1,792 and the NASDAQ ended higher by 14 points with the index at 4,097.
Stocks managed to pare their recent declines as investors looked to make moves ahead of the conclusion of the Fed's 2-day policy meeting. Focus will be on Wednesday's FOMC statement at 2PM ET and if the central bank will announce further reductions in asset purchases.
Most sectors on the S&P ended higher. Health care stocks showed strength with shares of Pfizer Inc (PFE +2.56%), rallying after posting a better-than-expected profit tally. American Airlines Group Inc(AAL +5.9%) rose following their quarterly report. On the downside, Apple (AAPL -7.99%) as the company posted quarterly iPhone sales below analysts' estimates.
Turning to fixed income markets, Treasuries were little changed along the curve. The benchmark 10-year note was up 1/32 to yield 2.75% and the 30-year bond gave up 1/8 of a point to yield 3.67%.
Investors should be watchful for any individual issues flashing technical sell signals. The CANSLIM.net Featured Stocks Page shows the most action-worthy candidates and their latest notes and a Headline Link directs members to the latest detailed analysis with data-packed graphs annotated by a Certified expert along with links to additional resources. The Premium Member Homepage includes "dynamic archives" to all prior pay reports published. Watch for an announcement via email concerning the next WEBCAST.
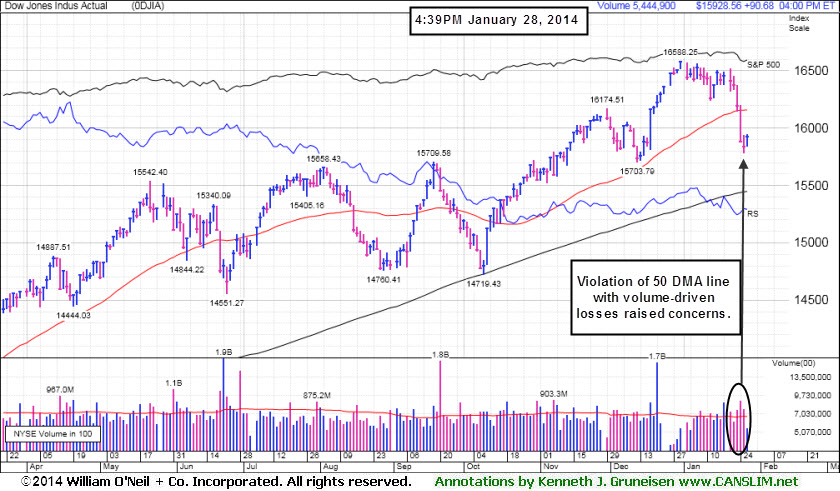
PICTURED: The Dow Jones Industrial Average violated its 50-day moving average (DMA) line with volume-driven losses. The damaging losses are viewed as a worrisome sign that the market conditions are eroding, further reminding investors to stand ready to reduce their market exposure.
|
 Kenneth J. Gruneisen started out as a licensed stockbroker in August 1987, a couple of months prior to the historic stock market crash that took the Dow Jones Industrial Average down -22.6% in a single day. He has published daily fact-based fundamental and technical analysis on high-ranked stocks online for two decades. Through FACTBASEDINVESTING.COM, Kenneth provides educational articles, news, market commentary, and other information regarding proven investment systems that work in good times and bad.
Comments contained in the body of this report are technical opinions only and are not necessarily those of Gruneisen Growth Corp. The material herein has been obtained from sources believed to be reliable and accurate, however, its accuracy and completeness cannot be guaranteed. Our firm, employees, and customers may effect transactions, including transactions contrary to any recommendation herein, or have positions in the securities mentioned herein or options with respect thereto. Any recommendation contained in this report may not be suitable for all investors and it is not to be deemed an offer or solicitation on our part with respect to the purchase or sale of any securities. |
|
 |
Financial, Retail, Tech, and Commodity-Linked Groups Rose
Kenneth J. Gruneisen - Passed the CAN SLIM® Master's Exam
Financial shares helped underpin the major averages' gains on Tuesday as the Broker/Dealer Index ($XBD +1.39%) and the Bank Index ($BKX +0.88%) rose. The Gold & Silver Index ($XAU +1.75%) outpaced energy-related shares as the Oil Services Index ($OSX +0.40%) and the Integrated Oil Index ($XOI +0.76%) posted modest gains. The Retail Index ($RLX +0.64%), Semiconductor Index ($SOX +0.43%), and the Networking Index ($NWX +0.55%) rounded out the mostly positive session with modest gains.
Charts courtesy www.stockcharts.com
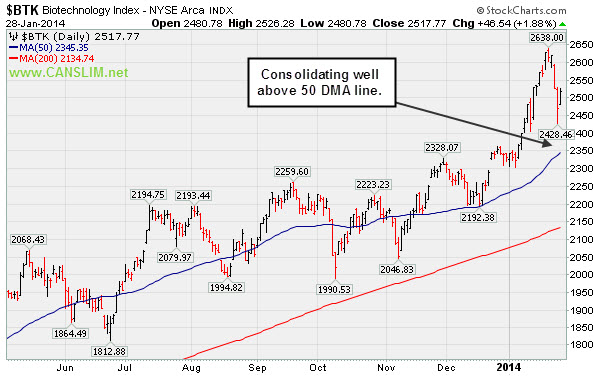
PICTURED: The Biotechnology Index ($BTK +1.84%) is consolidating above its 50-day moving average (DMA) line.
| Oil Services |
$OSX |
266.45 |
+1.06 |
+0.40% |
-5.19% |
| Integrated Oil |
$XOI |
1,436.76 |
+10.78 |
+0.76% |
-4.42% |
| Semiconductor |
$SOX |
527.54 |
+2.27 |
+0.43% |
-1.40% |
| Networking |
$NWX |
333.18 |
+1.82 |
+0.55% |
+2.85% |
| Broker/Dealer |
$XBD |
155.99 |
+2.13 |
+1.39% |
-2.85% |
| Retail |
$RLX |
894.74 |
+5.65 |
+0.64% |
-4.79% |
| Gold & Silver |
$XAU |
91.15 |
+1.57 |
+1.75% |
+8.32% |
| Bank |
$BKX |
68.54 |
+0.60 |
+0.88% |
-1.04% |
| Biotech |
$BTK |
2,516.81 |
+45.58 |
+1.84% |
+8.00% |
|
|
|
 |
Relative Strength Rating Wanes While Slumping on Higher Volume
Kenneth J. Gruneisen - Passed the CAN SLIM® Master's Exam
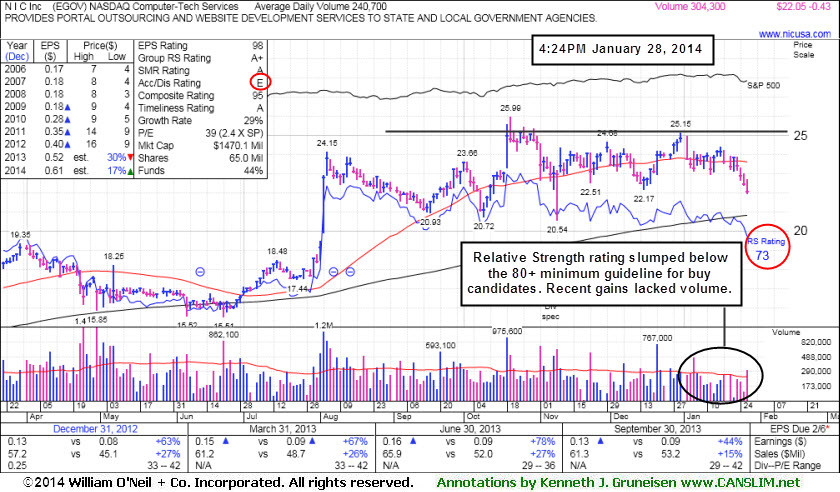
NIC Inc. (EGOV -$0.49 or -2.18% to $21.99) is still quietly sputtering below its 50-day moving average (DMA) line and its Relative Strength (RS) rating has fallen to 73, below the 80+ minimum guideline for buy candidates. A rally above recent resistance in the $25-26 area is needed for its technical stance to turn bullish. Above average volume was behind its slump below the recent low ($22.17 on 12/16/13), a sign further deterioration raising greater concerns. It was last shown in this FSU section on 12/27/13 with annotated graphs under the headline, "Rebounded Above 50-Day Average; Relative Strength Rating Waned".
EGOV needs to rebound above its 50 DMA line for its outlook to improve. Subsequent gains for new highs may offer proof of fresh institutional buying demand that could lead to a sustained and meaningful advance in price. EGOV made only limited progress since highlighted in the 10/18/13 mid-day report (read here) in yellow with an annotated daily graph. One flaw that has developed is that its Relative Strength (RS) rating has slumped to 73, below the 80+ minimum guideline for buy candidates. The stock has earned a high 98 Earnings Per Share (EPS) rating. The company recently reported earnings +44% on +15% sales revenues for the Sep '13 quarter, marking its 4th consecutive quarter with earnings above the +25% minimum guideline (C criteria). However, it was previously noted - "Blue triangles beside the quarterly and annual earnings figures within the datagraphs used by CANSLIM.net experts indicate pre-tax, non-recurring items were included (where possible, such items are normally removed to provide data better suited for comparison)."
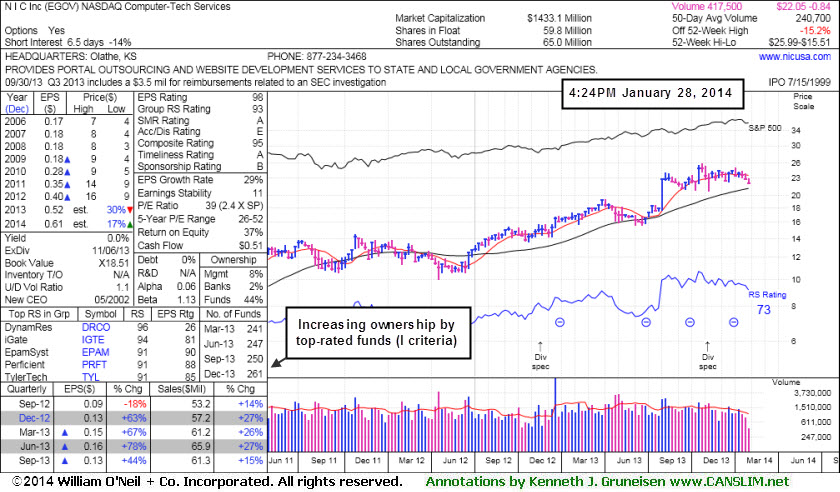
The number of top-rated funds owning its shares rose from 223 in Dec '12 to 261 in Dec '13, a somewhat reassuring trend concerning the I criteria. The Computer - Tech Services group has a 93 Group Relative Strength Rating, encouraging news concerning the L criteria. Its small supply of only 65 million shares (S criteria) outstanding can contribute to greater price volatility in the event of institutional buying or selling. Its Accumulation/Distribution rating has also slumped to E, the worst possible rating.
|
|
|
Color Codes Explained :
Y - Better candidates highlighted by our
staff of experts.
G - Previously featured
in past reports as yellow but may no longer be buyable under the
guidelines.
***Last / Change / Volume data in this table is the closing quote data***
Symbol/Exchange
Company Name
Industry Group |
PRICE |
CHANGE
(%Change) |
Day High |
Volume
(% DAV)
(% 50 day avg vol) |
52 Wk Hi
% From Hi |
Featured
Date |
Price
Featured |
Pivot Featured |
|
Max Buy |
ARMH
-
NASDAQ
A R M Holdings Plc Ads
ELECTRONICS - Semiconductor - Specialized
|
$46.82
|
-0.83
-1.74% |
$47.59
|
2,514,981
159.25% of 50 DAV
50 DAV is 1,579,300
|
$55.26
-15.27%
|
12/23/2013
|
$54.59
|
PP = $52.48
|
|
MB = $55.10
|
 Most Recent Note - 1/28/2014 5:17:50 PM
Slumped further below it 50 DMA line with a loss on higher volume. Relative Strength rating has slumped to 52, below the 80+ minimum for buy candidates. Due to technical deterioration it will be dropped from the Featured Stocks list tonight.
>>> FEATURED STOCK ARTICLE : Relative Strength Waned and 50-Day Average Acted as Resistance - 1/24/2014
View all notes |
Set NEW NOTE alert |
CANSLIM.net Company Profile |
SEC
News |
Chart |
Request a new note
C
A N
S L
I M


|
CELG
-
NASDAQ
Celgene Corp
DRUGS - Drug Manufacturers - Major
|
$159.98
|
+3.71
2.37% |
$160.57
|
3,672,603
136.59% of 50 DAV
50 DAV is 2,688,700
|
$174.66
-8.40%
|
9/12/2013
|
$149.50
|
PP = $150.02
|
|
MB = $157.52
|
Most Recent Note - 1/27/2014 12:15:14 PM
G - Down considerably today undercutting prior lows in the $157 area raising greater concerns. Violated its 50 DMA line on the prior session triggering technical sell signals.
>>> FEATURED STOCK ARTICLE : Found Support Above 50-Day Average After Gapping Down on Prior Session - 1/7/2014
View all notes |
Set NEW NOTE alert |
CANSLIM.net Company Profile |
SEC
News |
Chart |
Request a new note
C
A N
S L
I M
|
EGOV
-
NASDAQ
N I C Inc
INTERNET - Internet Software and Services
|
$22.05
|
-0.43
-1.91% |
$22.71
|
354,678
140.13% of 50 DAV
50 DAV is 253,100
|
$25.99
-15.16%
|
12/20/2013
|
$24.00
|
PP = $26.09
|
|
MB = $27.39
|
Most Recent Note - 1/28/2014 5:15:24 PM
G - Slumped further below its 50 DMA line today on higher volume and undercut the recent low ($22.17 on 12/16/13) raising greater concerns. Its Relative Strength (RS) rating has fallen to 67, below the 80+ minimum guideline for buy candidates. A rally above recent resistance in the $25-26 area is needed for its technical stance to turn bullish. See the latest FSU analysis for more details and new annotated graphs.
>>> FEATURED STOCK ARTICLE : Relative Strength Rating Wanes While Slumping on Higher Volume - 1/28/2014
View all notes |
Set NEW NOTE alert |
CANSLIM.net Company Profile |
SEC
News |
Chart |
Request a new note
C
A N
S L
I M
|
EQM
-
NYSE
E Q T Midstream Partners
ENERGY - Oil and Gas Pipelines
|
$62.13
|
+0.17
0.27% |
$62.56
|
134,745
125.93% of 50 DAV
50 DAV is 107,000
|
$63.66
-2.40%
|
12/12/2013
|
$53.17
|
PP = $56.51
|
|
MB = $59.34
|
Most Recent Note - 1/24/2014 4:19:48 PM
G - Stubbornly holding its ground while very extended from any sound base pattern. Prior highs in the $56 area define support to watch on pullbacks.
>>> FEATURED STOCK ARTICLE : Extended From Base After Six Consecutive Weekly Gains - 1/17/2014
View all notes |
Set NEW NOTE alert |
CANSLIM.net Company Profile |
SEC
News |
Chart |
Request a new note
C
A N
S L
I M
|
FB
-
NASDAQ
Facebook Inc Cl A
INTERNET
|
$55.14
|
+1.59
2.97% |
$55.28
|
48,072,606
75.17% of 50 DAV
50 DAV is 63,948,100
|
$59.31
-7.03%
|
12/12/2013
|
$51.40
|
PP = $54.93
|
|
MB = $57.68
|
Most Recent Note - 1/28/2014 5:19:20 PM
G - Gain today on lighter volume halted its slide at its 50 DMA line after 4 consecutive losses. Disciplined investors always limit losses by selling any stock that falls more than -7% from their purchase price.
>>> FEATURED STOCK ARTICLE : Following New Offering Prior Highs Acted As Support - 1/15/2014
View all notes |
Set NEW NOTE alert |
CANSLIM.net Company Profile |
SEC
News |
Chart |
Request a new note
C
A N
S L
I M
|
Symbol/Exchange
Company Name
Industry Group |
PRICE |
CHANGE
(%Change) |
Day High |
Volume
(% DAV)
(% 50 day avg vol) |
52 Wk Hi
% From Hi |
Featured
Date |
Price
Featured |
Pivot Featured |
|
Max Buy |
JAZZ
-
NASDAQ
Jazz Pharmaceuticals Plc
DRUGS - Biotechnology
|
$151.44
|
+8.73
6.12% |
$154.42
|
1,478,607
189.52% of 50 DAV
50 DAV is 780,200
|
$159.14
-4.84%
|
9/30/2013
|
$93.20
|
PP = $89.10
|
|
MB = $93.56
|
Most Recent Note - 1/28/2014 12:52:33 PM
G - Rebounding toward its 52-week high with a gap up gain today following 2 consecutive big losses on above average volume. Its 50 DMA line ($125.973 now) defines important support to watch on pullbacks.
>>> FEATURED STOCK ARTICLE : Very Extended From Sound Base Following Big Volume-Driven Gains - 1/14/2014
View all notes |
Set NEW NOTE alert |
CANSLIM.net Company Profile |
SEC
News |
Chart |
Request a new note
C
A N
S L
I M
|
KORS
-
NYSE
Michael Kors Hldgs Ltd
RETAIL - Apparel Stores
|
$81.85
|
+0.76
0.94% |
$83.06
|
3,711,129
88.41% of 50 DAV
50 DAV is 4,197,800
|
$84.58
-3.23%
|
8/6/2013
|
$69.66
|
PP = $66.28
|
|
MB = $69.59
|
Most Recent Note - 1/24/2014 4:22:47 PM
G - Encountering resistance and remaining below its 50 DMA line. Losses on higher volume indicate distributional pressure. Reports quarterly financial results on Tuesday, February 4, 2014, before the market opens.
>>> FEATURED STOCK ARTICLE : Technical Deterioration and RS Rating Slump Raises Concerns - 1/9/2014
View all notes |
Set NEW NOTE alert |
CANSLIM.net Company Profile |
SEC
News |
Chart |
Request a new note
C
A N
S L
I M
|
MRLN
-
NASDAQ
Marlin Business Services
DIVERSIFIED SERVICES - Rental and Leasing Services
|
$26.50
|
-0.09
-0.34% |
$26.63
|
40,798
127.49% of 50 DAV
50 DAV is 32,000
|
$29.58
-10.41%
|
12/19/2013
|
$26.69
|
PP = $28.74
|
|
MB = $30.18
|
Most Recent Note - 1/27/2014 4:44:49 PM
Y - Slumped back into the prior base and finished near the session low today raising concerns. Disciplined investor always limit losses by selling any stock that falls more than -7% from their purchase price.
>>> FEATURED STOCK ARTICLE : Hovering Near 52-Week High Following Technical Breakout - 1/22/2014
View all notes |
Set NEW NOTE alert |
CANSLIM.net Company Profile |
SEC
News |
Chart |
Request a new note
C
A N
S L
I M
|
PCLN
-
NASDAQ
Priceline.Com Inc
INTERNET - Internet Software and Services
|
$1,162.53
|
+19.29
1.69% |
$1,168.64
|
631,853
106.86% of 50 DAV
50 DAV is 591,300
|
$1,214.97
-4.32%
|
12/18/2013
|
$1,156.20
|
PP = $1,198.85
|
|
MB = $1,258.79
|
Most Recent Note - 1/27/2014 12:50:20 PM
G - Slumping below its 50 DMA line today with a 3rd consecutive loss raising concerns. Its color code is changed to green, and the prior low ($1,113.01 on 1/06/13) defines near-term support to watch. Did not trigger a technical buy signal since recently featured in yellow.
>>> FEATURED STOCK ARTICLE : Managed Positive Reversal at 50-Day Moving Average Line - 1/6/2014
View all notes |
Set NEW NOTE alert |
CANSLIM.net Company Profile |
SEC
News |
Chart |
Request a new note
C
A N
S L
I M
|
RGR
-
NYSE
Sturm Ruger & Co Inc
CONSUMER DURABLES - Sporting Goods
|
$75.18
|
+1.59
2.16% |
$75.45
|
238,200
70.16% of 50 DAV
50 DAV is 339,500
|
$85.93
-12.51%
|
1/8/2014
|
$78.87
|
PP = $80.38
|
|
MB = $84.40
|
Most Recent Note - 1/24/2014 4:12:59 PM
G- Violated its 50 DMA line with today's loss on higher volume triggering a technical sell signal. Color code is changed to green. A prompt rebound above the 50 DMA line is needed for its outlook to improve. Disciplined investors always limit losses by selling any stock if it falls more than -7% from their purchase price."
>>> FEATURED STOCK ARTICLE : Hit New Highs With 6th Consecutive Gain - 1/13/2014
View all notes |
Set NEW NOTE alert |
CANSLIM.net Company Profile |
SEC
News |
Chart |
Request a new note
C
A N
S L
I M
|
Symbol/Exchange
Company Name
Industry Group |
PRICE |
CHANGE
(%Change) |
Day High |
Volume
(% DAV)
(% 50 day avg vol) |
52 Wk Hi
% From Hi |
Featured
Date |
Price
Featured |
Pivot Featured |
|
Max Buy |
SFUN
-
NYSE
Soufun Hldgs Ltd Ads A
INTERNET - Internet Information Providers
|
$81.48
|
+2.32
2.93% |
$83.48
|
2,007,832
171.55% of 50 DAV
50 DAV is 1,170,400
|
$95.39
-14.58%
|
10/17/2013
|
$58.02
|
PP = $53.87
|
|
MB = $56.56
|
Most Recent Note - 1/28/2014 1:51:10 PM
G - Gain today halted its slide at its 50 DMA line after 3 consecutive volume-driven losses.Very extended from any sound base, and its 50 DMA line ($77.60 now) defines important support to watch.
>>> FEATURED STOCK ARTICLE : Extended From Base Following More Volume-Driven Gains - 1/10/2014
View all notes |
Set NEW NOTE alert |
CANSLIM.net Company Profile |
SEC
News |
Chart |
Request a new note
C
A N
S L
I M
|
SILC
-
NASDAQ
Silicom Ltd
COMPUTER HARDWARE - Networking andamp; Communication Dev
|
$61.78
|
+0.90
1.48% |
$63.91
|
152,575
443.53% of 50 DAV
50 DAV is 34,400
|
$62.67
-1.42%
|
12/23/2013
|
$44.62
|
PP = $46.25
|
|
MB = $48.56
|
Most Recent Note - 1/28/2014 1:05:28 PM
G - Touching another new 52-week high today. Stubbornly held its ground since a considerable gap up on 1/23/14 after reporting earnings +92% on +52% sales for the Dec '13 quarter, beating consensus estimates. It is extended from any sound base.
>>> FEATURED STOCK ARTICLE : Considerable Gap Up Following Strong Earnings Report - 1/23/2014
View all notes |
Set NEW NOTE alert |
CANSLIM.net Company Profile |
SEC
News |
Chart |
Request a new note
C
A N
S L
I M
|
SSNC
-
NASDAQ
S S & C Technologies
COMPUTER SOFTWARE and SERVICES - Application Software
|
$41.81
|
-0.73
-1.72% |
$42.65
|
333,232
126.61% of 50 DAV
50 DAV is 263,200
|
$46.61
-10.29%
|
10/22/2013
|
$39.17
|
PP = $40.04
|
|
MB = $42.04
|
Most Recent Note - 1/28/2014 1:36:53 PM
G - Slumping below its 50 DMA line with today's 3rd consecutive loss raising greater concerns and triggering a technical sell signal. Only a prompt rebound above the 50 DMA line ($42.65 now) would help its outlook.
>>> FEATURED STOCK ARTICLE : Enduring Distributional Pressure While Retreating Near Prior Highs - 1/16/2014
View all notes |
Set NEW NOTE alert |
CANSLIM.net Company Profile |
SEC
News |
Chart |
Request a new note
C
A N
S L
I M
|
ULTI
-
NASDAQ
Ultimate Software Group
INTERNET - Internet Software and Services
|
$156.32
|
+2.57
1.67% |
$156.98
|
169,627
124.91% of 50 DAV
50 DAV is 135,800
|
$162.88
-4.03%
|
1/27/2014
|
$153.75
|
PP = $162.98
|
|
MB = $171.13
|
Most Recent Note - 1/27/2014 6:55:04 PM
Y - Color code is changed to yellow with new pivot point cited based on its 10/30/13 high plus 10 cents. Enduring distributional pressure while trading near its 50 DMA line. See the latest FSU analysis for more details and new annotated daily and weekly graphs.
>>> FEATURED STOCK ARTICLE : Forming New Base But Enduring Distributional Pressure - 1/27/2014
View all notes |
Set NEW NOTE alert |
CANSLIM.net Company Profile |
SEC
News |
Chart |
Request a new note
C
A N
S L
I M
|
VRX
-
NYSE
Valeant Pharmaceuticals
DRUGS - Drug Manufacturers - Other
|
$132.80
|
+1.80
1.37% |
$133.48
|
1,000,131
86.58% of 50 DAV
50 DAV is 1,155,100
|
$140.36
-5.39%
|
9/11/2013
|
$100.26
|
PP = $105.50
|
|
MB = $110.78
|
Most Recent Note - 1/28/2014 1:38:14 PM
G - Extended from any sound base and enduring mild distributional pressure for the past week. Its 50 DMA line and prior highs near $115 define near-term support to watch.
>>> FEATURED STOCK ARTICLE : Bullish Action Has Continued Despite Fundamental Concerns - 1/21/2014
View all notes |
Set NEW NOTE alert |
CANSLIM.net Company Profile |
SEC
News |
Chart |
Request a new note
C
A N
S L
I M
|
Symbol/Exchange
Company Name
Industry Group |
PRICE |
CHANGE
(%Change) |
Day High |
Volume
(% DAV)
(% 50 day avg vol) |
52 Wk Hi
% From Hi |
Featured
Date |
Price
Featured |
Pivot Featured |
|
Max Buy |
|
|
|
THESE ARE NOT BUY RECOMMENDATIONS!
Comments contained in the body of this report are technical
opinions only. The material herein has been obtained
from sources believed to be reliable and accurate, however,
its accuracy and completeness cannot be guaranteed.
This site is not an investment advisor, hence it does
not endorse or recommend any securities or other investments.
Any recommendation contained in this report may not
be suitable for all investors and it is not to be deemed
an offer or solicitation on our part with respect to
the purchase or sale of any securities. All trademarks,
service marks and trade names appearing in this report
are the property of their respective owners, and are
likewise used for identification purposes only.
This report is a service available
only to active Paid Premium Members.
You may opt-out of receiving report notifications
at any time. Questions or comments may be submitted
by writing to Premium Membership Services 665 S.E. 10 Street, Suite 201 Deerfield Beach, FL 33441-5634 or by calling 1-800-965-8307
or 954-785-1121.
|
|
|

