You are not logged in.
This means you
CAN ONLY VIEW reports that were published prior to Wednesday, April 9, 2025.
You
MUST UPGRADE YOUR MEMBERSHIP if you want to see any current reports.
AFTER MARKET UPDATE - FRIDAY, JANUARY 24TH, 2014
Previous After Market Report Next After Market Report >>>
|
|
|
|
DOW |
-318.24 |
15,879.11 |
-1.96% |
|
Volume |
902,285,780 |
+18% |
|
Volume |
2,345,402,770 |
+17% |
|
NASDAQ |
-90.05 |
4,128.82 |
-2.13% |
|
Advancers |
411 |
13% |
|
Advancers |
376 |
14% |
|
S&P 500 |
-38.17 |
1,790.29 |
-2.09% |
|
Decliners |
2,669 |
84% |
|
Decliners |
2,251 |
84% |
|
Russell 2000 |
-28.26 |
1,144.13 |
-2.41% |
|
52 Wk Highs |
30 |
|
|
52 Wk Highs |
42 |
|
|
S&P 600 |
-15.21 |
647.43 |
-2.30% |
|
52 Wk Lows |
74 |
|
|
52 Wk Lows |
32 |
|
|
 |
Dow and S&P 500 Index Both Violated 50-Day Average Lines
Kenneth J. Gruneisen - Passed the CAN SLIM® Master's Exam
Friday's retreat led to the Dow's worst weekly loss since May 2012 as it declined -3.5%. The S&P 500 finished lower for a second week with a loss of -2.6%. The NASDAQ snapped a two-week winning streak as it fell -1.7%. Friday's volume totals were reported higher than the prior trading session's volume totals on the NYSE and on the Nasdaq exchange, again showing that the institutional crowd was increasing their selling efforts. Breadth was negative as decliners led advancers by more than 4-1 on the NYSE and by 6-1 on the Nasdaq exchange. There were only 7 high-ranked companies from the CANSLIM.net Leaders List that made new 52-week highs and appeared on the CANSLIM.net BreakOuts Page, down from a total of 25 stocks on the prior session. The list of stocks hitting new 52-week highs outnumbered new lows on the Nasdaq exchange however new lows outnumbered new highs on the NYSE. There were losses for 18 of the 19 high-ranked companies currently included on the Featured Stocks Page. The Market (M criteria) has encountered distributional pressure and leadership (stocks hitting new highs) has waned, earning the label of being in another "correction". Such weakness serves as a reminder for investors to use caution and remain disciplined in following proper sell rules under the fact-based investment system to reduce market exposure.
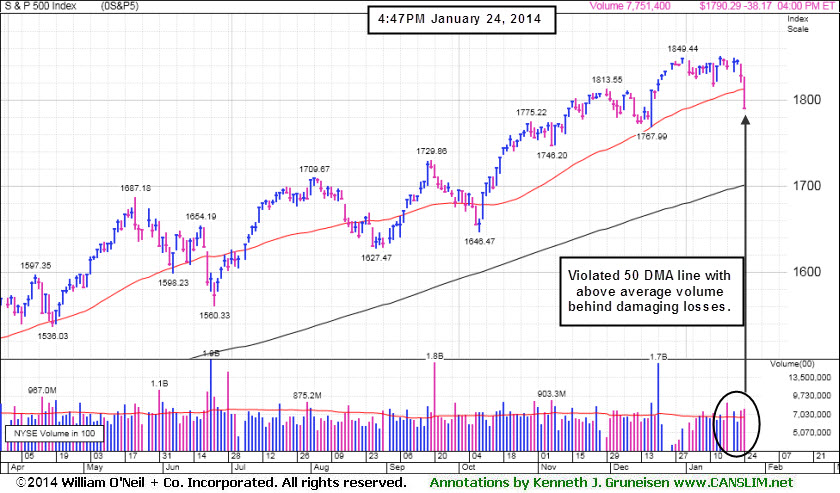
The major averages experienced another setback on Friday. The Dow lost 318 points to 15,879. The S&P 500 Index fell 38 points to 1,790. The NASDAQ declined 90 points to 4,128.
Stocks retreated following a selloff in emerging-market currencies and as investors turned cautious ahead of next week’s FOMC meeting. Concerns of a slowdown in China also weighed on the market following yesterday’s report that showed the country’s manufacturing contracted.
Overall, every sector in the S&P 500 closed in negative territory. Dow Chemical (DOW -2.9%) fell while materials and industrials were the worst performing groups. Kansas City Southern (KSC -15.4%) dove after falling short of earnings estimates as coal shipments declined. Financials and health care were also hit with large losses as Citigroup Inc (C -2.7%) and Pfizer (PFE -2.6%) slumped.
Treasuries extended yesterday’s advance. The 10-year note increased 14/32 to yield 2.73%. The 30-year bond gained 23/32 to yield 3.64%.
Investors should be watchful for any individual issues flashing technical sell signals. The CANSLIM.net Featured Stocks Page shows the most action-worthy candidates and their latest notes and a Headline Link directs members to the latest detailed analysis with data-packed graphs annotated by a Certified expert along with links to additional resources. The Premium Member Homepage includes "dynamic archives" to all prior pay reports published. Watch for an announcement via email concerning the next WEBCAST.
PICTURED: The S&P 500 Index violated its 50-day moving average (DMA) line. The damaging losses are viewed as a worrisome sign that the market conditions are eroding, further reminding investors to stand ready to reduce their market exposure.
|
 Kenneth J. Gruneisen started out as a licensed stockbroker in August 1987, a couple of months prior to the historic stock market crash that took the Dow Jones Industrial Average down -22.6% in a single day. He has published daily fact-based fundamental and technical analysis on high-ranked stocks online for two decades. Through FACTBASEDINVESTING.COM, Kenneth provides educational articles, news, market commentary, and other information regarding proven investment systems that work in good times and bad.
Comments contained in the body of this report are technical opinions only and are not necessarily those of Gruneisen Growth Corp. The material herein has been obtained from sources believed to be reliable and accurate, however, its accuracy and completeness cannot be guaranteed. Our firm, employees, and customers may effect transactions, including transactions contrary to any recommendation herein, or have positions in the securities mentioned herein or options with respect thereto. Any recommendation contained in this report may not be suitable for all investors and it is not to be deemed an offer or solicitation on our part with respect to the purchase or sale of any securities. |
|
 |
Losses for Retail, Financial, Tech, and Commodity-Linked Groups
Kenneth J. Gruneisen - Passed the CAN SLIM® Master's Exam
Weakness in financial shares weighed on the major averages as the Bank Index ($BKX -2.55%) and Broker/Dealer Index ($XBD -2.37%) pulled back. The tech sector was led lower by the Biotechnology Index ($BTK -3.41%), and the Semiconductor Index ($SOX -2.33%) and Networking Index ($NWX -1.29%) also fell. Energy-related shares slumped and the Integrated Oil Index ($XOI -2.24%) and Oil Services Index ($OSX -2.08%) fell. Losses for the Retail Index ($RLX -1.79%) and the Gold & Silver Index ($XAU -0.82%) rounded out a solidly negative session to close the week.
Charts courtesy www.stockcharts.com
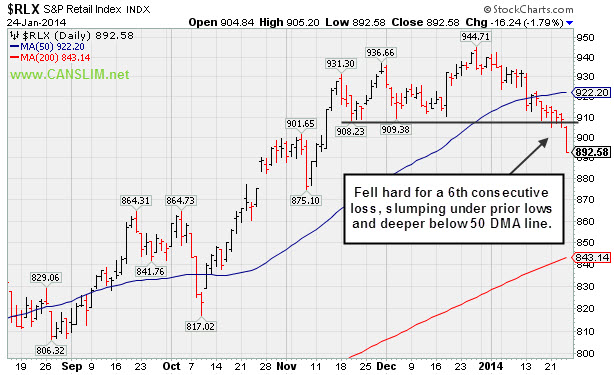
PICTURED: The Retail Index ($RLX -1.79%) fell hard for a 6th consecutive loss, slumping under prior lows and deeper below 50-day moving average (DMA) line. Prior pullbacks below the 50 DMA line were not as sustained, while this one has just turned uglier with time.
| Oil Services |
$OSX |
267.01 |
-5.67 |
-2.08% |
-4.99% |
| Integrated Oil |
$XOI |
1,431.39 |
-32.80 |
-2.24% |
-4.77% |
| Semiconductor |
$SOX |
528.89 |
-12.60 |
-2.33% |
-1.15% |
| Networking |
$NWX |
329.95 |
-4.30 |
-1.29% |
+1.86% |
| Broker/Dealer |
$XBD |
157.20 |
-3.82 |
-2.37% |
-2.09% |
| Retail |
$RLX |
892.58 |
-16.24 |
-1.79% |
-5.02% |
| Gold & Silver |
$XAU |
92.68 |
-0.77 |
-0.82% |
+10.14% |
| Bank |
$BKX |
68.44 |
-1.79 |
-2.55% |
-1.18% |
| Biotech |
$BTK |
2,529.46 |
-89.20 |
-3.41% |
+8.54% |
|
|
|
 |
Relative Strength Waned and 50-Day Average Acted as Resistance
Kenneth J. Gruneisen - Passed the CAN SLIM® Master's Exam
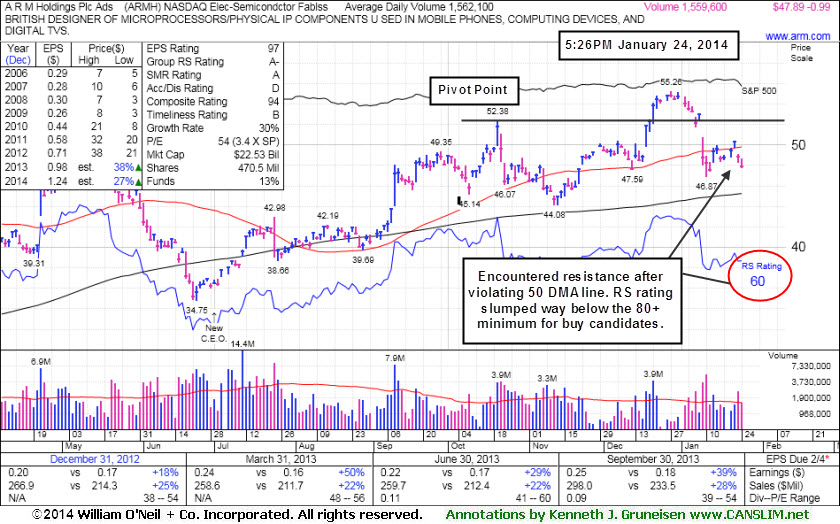
A R M Holdings Plc Ads (ARMH -$0.99 or -2.03% to $47.89) is below its 50-day moving average (DMA) line which has acted as resistance following damaging losses which triggered technical sell signals. Disciplined investors always limit losses by selling any stock that falls more than -7% from their purchase price. Its Relative Strength Rating has slumped to 60, well below the 80+ minimum necessary for buy candidates under the fact-based system, so it faces important technical hurdles before it might have the look of a serious buy candidate again. The market correction (M criteria) is also an overriding concern for the near term.
It was last shown in this FSU section on 12/23/13 with annotated graphs under the headline, "No Overhead Supply Remains Following Volume-Driven Breakout". after highlighted in yellow in the mid-day report (read here) with pivot point cited based on its 10/21/13 high plus 10 cents. It hit a new 52-week high with above average volume behind gains, however it stalled soon after flashing signs of great buying demand coming from the institutional crowd. Disciplined investors avoid chasing stocks extended more than +5% above their prior high or pivot point, and they always limit losses be selling if any stock falls more than -7% from their purchase price. Any stock that is sold can always be bought back later if strength returns.
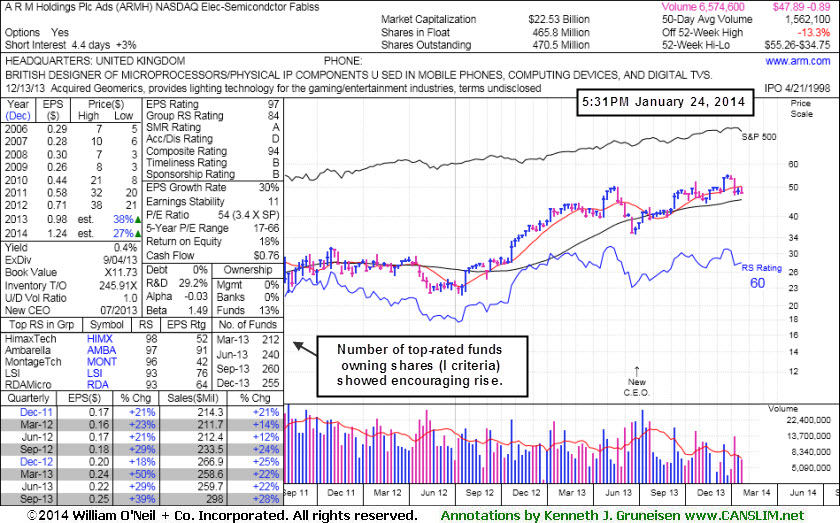
This high-ranked UK-based Electronics - Semiconductor firm reported earnings +39% on +28% sales in the Sep '13 quarter, marking 3 consecutive quarterly comparisons with an earnings increase above the +25% minimum earnings guideline (C criteria). It followed a downturn in FY '09 earnings with strong annual earnings increases (A criteria). It has a large supply of 470 million shares outstanding, however the number of top-rated funds owning its shares rose from 206 in Sep '12 to 255 in Dec '13, a reassuring sign concerning the I criteria.
|
|
|
Color Codes Explained :
Y - Better candidates highlighted by our
staff of experts.
G - Previously featured
in past reports as yellow but may no longer be buyable under the
guidelines.
***Last / Change / Volume data in this table is the closing quote data***
Symbol/Exchange
Company Name
Industry Group |
PRICE |
CHANGE
(%Change) |
Day High |
Volume
(% DAV)
(% 50 day avg vol) |
52 Wk Hi
% From Hi |
Featured
Date |
Price
Featured |
Pivot Featured |
|
Max Buy |
ARMH
-
NASDAQ
A R M Holdings Plc Ads
ELECTRONICS - Semiconductor - Specialized
|
$47.89
|
-0.99
-2.03% |
$48.70
|
1,582,400
100.20% of 50 DAV
50 DAV is 1,579,300
|
$55.26
-13.34%
|
12/23/2013
|
$54.59
|
PP = $52.48
|
|
MB = $55.10
|
 Most Recent Note - 1/24/2014 5:57:46 PM
G - Its 50 DMA line acted as resistance and its Relative Strength rating has slumped to 60, below the 80+ minimum for buy candidates. See the latest FSU analysis for more details and new annotated graphs.
>>> FEATURED STOCK ARTICLE : Relative Strength Waned and 50-Day Average Acted as Resistance - 1/24/2014
View all notes |
Set NEW NOTE alert |
CANSLIM.net Company Profile |
SEC
News |
Chart |
Request a new note
C
A N
S L
I M


|
BITA
-
NYSE
Bitauto Hldgs Ltd Ads
INTERNET - Internet Information Providers
|
$31.77
|
-3.21
-9.18% |
$34.82
|
2,256,113
165.79% of 50 DAV
50 DAV is 1,360,800
|
$39.84
-20.26%
|
1/8/2014
|
$33.00
|
PP = $35.14
|
|
MB = $36.90
|
Most Recent Note - 1/24/2014 11:32:23 AM
Y - Suffering a 2nd consecutive big loss amid widespread weakness in China-related issues. Raising concerns while undercutting prior highs in the $35 area previously noted as support to watch above its 50 DMA line ($31.52 now).
>>> FEATURED STOCK ARTICLE : Finished Strong and Challenged Pivot Point After Highlighted in Mid-Day Report - 1/8/2014
View all notes |
Set NEW NOTE alert |
CANSLIM.net Company Profile |
SEC
News |
Chart |
Request a new note
C
A N
S L
I M
|
CELG
-
NASDAQ
Celgene Corp
DRUGS - Drug Manufacturers - Major
|
$161.22
|
-7.33
-4.35% |
$167.39
|
3,978,671
147.98% of 50 DAV
50 DAV is 2,688,700
|
$174.66
-7.69%
|
9/12/2013
|
$149.50
|
PP = $150.02
|
|
MB = $157.52
|
Most Recent Note - 1/24/2014 4:14:33 PM
G - Violated its 50 DMA line with today's loss on high volume raising greater concerns and triggering technical sell signals. Only a prompt rebound above the 50 DMA line would help its outlook improve.
>>> FEATURED STOCK ARTICLE : Found Support Above 50-Day Average After Gapping Down on Prior Session - 1/7/2014
View all notes |
Set NEW NOTE alert |
CANSLIM.net Company Profile |
SEC
News |
Chart |
Request a new note
C
A N
S L
I M
|
EGOV
-
NASDAQ
N I C Inc
INTERNET - Internet Software and Services
|
$22.89
|
-0.52
-2.22% |
$23.32
|
202,494
80.01% of 50 DAV
50 DAV is 253,100
|
$25.99
-11.93%
|
12/20/2013
|
$24.00
|
PP = $26.09
|
|
MB = $27.39
|
Most Recent Note - 1/21/2014 3:18:49 PM
G - Quietly sputtering below its 50 DMA line. A rally above recent resistance in the $25-26 area is needed for its technical stance to turn bullish. Meanwhile, a violation of the recent low ($22.17 on 12/16/13) would raise concern as that level defines near-term support above its 200 DMA line.
>>> FEATURED STOCK ARTICLE : Rebounded Above 50-Day Average; Relative Strength Rating Waned - 12/27/2013
View all notes |
Set NEW NOTE alert |
CANSLIM.net Company Profile |
SEC
News |
Chart |
Request a new note
C
A N
S L
I M
|
EQM
-
NYSE
E Q T Midstream Partners
ENERGY - Oil and Gas Pipelines
|
$62.73
|
-0.10
-0.16% |
$63.39
|
91,815
85.81% of 50 DAV
50 DAV is 107,000
|
$63.66
-1.46%
|
12/12/2013
|
$53.17
|
PP = $56.51
|
|
MB = $59.34
|
Most Recent Note - 1/24/2014 4:19:48 PM
G - Stubbornly holding its ground while very extended from any sound base pattern. Prior highs in the $56 area define support to watch on pullbacks.
>>> FEATURED STOCK ARTICLE : Extended From Base After Six Consecutive Weekly Gains - 1/17/2014
View all notes |
Set NEW NOTE alert |
CANSLIM.net Company Profile |
SEC
News |
Chart |
Request a new note
C
A N
S L
I M
|
Symbol/Exchange
Company Name
Industry Group |
PRICE |
CHANGE
(%Change) |
Day High |
Volume
(% DAV)
(% 50 day avg vol) |
52 Wk Hi
% From Hi |
Featured
Date |
Price
Featured |
Pivot Featured |
|
Max Buy |
FB
-
NASDAQ
Facebook Inc Cl A
INTERNET
|
$54.45
|
-2.18
-3.85% |
$56.42
|
55,422,055
86.67% of 50 DAV
50 DAV is 63,948,100
|
$59.31
-8.19%
|
12/12/2013
|
$51.40
|
PP = $54.93
|
|
MB = $57.68
|
Most Recent Note - 1/24/2014 4:21:17 PM
G - Pulled back from its 52-week high with today's 3rd consecutive gain on light volume. Disciplined investors always limit losses by selling any stock that falls more than -7% from their purchase price.
>>> FEATURED STOCK ARTICLE : Following New Offering Prior Highs Acted As Support - 1/15/2014
View all notes |
Set NEW NOTE alert |
CANSLIM.net Company Profile |
SEC
News |
Chart |
Request a new note
C
A N
S L
I M
|
GNRC
-
NYSE
Generac Hldgs Inc
CONSUMER DURABLES - Electronic Equipment
|
$47.50
|
-2.68
-5.34% |
$48.63
|
3,241,282
483.27% of 50 DAV
50 DAV is 670,700
|
$57.29
-17.09%
|
11/26/2013
|
$53.02
|
PP = $52.42
|
|
MB = $55.04
|
Most Recent Note - 1/24/2014 11:26:44 AM
Gapped down today and it is suffering yet another damaging loss on heavy volume following previously noted technical sell signals. Due to technical deterioration it will be dropped from the Featured Stocks list tonight.
>>> FEATURED STOCK ARTICLE : Volume Totals Cooling While Holding Ground Near Highs - 1/2/2014
View all notes |
Set NEW NOTE alert |
CANSLIM.net Company Profile |
SEC
News |
Chart |
Request a new note
C
A N
S L
I M
|
JAZZ
-
NASDAQ
Jazz Pharmaceuticals Plc
DRUGS - Biotechnology
|
$149.19
|
-9.88
-6.21% |
$157.85
|
1,719,384
220.38% of 50 DAV
50 DAV is 780,200
|
$159.14
-6.25%
|
9/30/2013
|
$93.20
|
PP = $89.10
|
|
MB = $93.56
|
Most Recent Note - 1/24/2014 12:21:10 PM
G - Pulling back today after 6 consecutive gains. Previously noted - "Very extended from any sound base. Its 50 DMA line defines important support to watch on pullbacks."
>>> FEATURED STOCK ARTICLE : Very Extended From Sound Base Following Big Volume-Driven Gains - 1/14/2014
View all notes |
Set NEW NOTE alert |
CANSLIM.net Company Profile |
SEC
News |
Chart |
Request a new note
C
A N
S L
I M
|
KORS
-
NYSE
Michael Kors Hldgs Ltd
RETAIL - Apparel Stores
|
$80.07
|
-0.22
-0.27% |
$81.10
|
5,250,467
125.08% of 50 DAV
50 DAV is 4,197,800
|
$84.58
-5.33%
|
8/6/2013
|
$69.66
|
PP = $66.28
|
|
MB = $69.59
|
Most Recent Note - 1/24/2014 4:22:47 PM
G - Encountering resistance and remaining below its 50 DMA line. Losses on higher volume indicate distributional pressure. Reports quarterly financial results on Tuesday, February 4, 2014, before the market opens.
>>> FEATURED STOCK ARTICLE : Technical Deterioration and RS Rating Slump Raises Concerns - 1/9/2014
View all notes |
Set NEW NOTE alert |
CANSLIM.net Company Profile |
SEC
News |
Chart |
Request a new note
C
A N
S L
I M
|
MRLN
-
NASDAQ
Marlin Business Services
DIVERSIFIED SERVICES - Rental and Leasing Services
|
$27.76
|
-0.44
-1.56% |
$28.25
|
42,189
131.84% of 50 DAV
50 DAV is 32,000
|
$29.58
-6.15%
|
12/19/2013
|
$26.69
|
PP = $28.74
|
|
MB = $30.18
|
Most Recent Note - 1/22/2014 5:31:34 PM
Y - Its stalled after recent volume-driven gains triggered a technical buy signal. No resistance remains due to overhead supply. See the latest FSU analysis for more details and new annotated graphs.
>>> FEATURED STOCK ARTICLE : Hovering Near 52-Week High Following Technical Breakout - 1/22/2014
View all notes |
Set NEW NOTE alert |
CANSLIM.net Company Profile |
SEC
News |
Chart |
Request a new note
C
A N
S L
I M
|
Symbol/Exchange
Company Name
Industry Group |
PRICE |
CHANGE
(%Change) |
Day High |
Volume
(% DAV)
(% 50 day avg vol) |
52 Wk Hi
% From Hi |
Featured
Date |
Price
Featured |
Pivot Featured |
|
Max Buy |
PCLN
-
NASDAQ
Priceline.Com Inc
INTERNET - Internet Software and Services
|
$1,179.93
|
-28.93
-2.39% |
$1,203.16
|
879,361
148.72% of 50 DAV
50 DAV is 591,300
|
$1,214.97
-2.88%
|
12/18/2013
|
$1,156.20
|
PP = $1,198.85
|
|
MB = $1,258.79
|
Most Recent Note - 1/24/2014 4:18:43 PM
Y - Consolidating above its 50 DMA line which recently acted as support. A volume-driven gain above its pivot point may trigger a technical buy signal, meanwhile, its 50 DMA line and prior low ($1,113.01 on 1/06/13) define near-term support to watch.
>>> FEATURED STOCK ARTICLE : Managed Positive Reversal at 50-Day Moving Average Line - 1/6/2014
View all notes |
Set NEW NOTE alert |
CANSLIM.net Company Profile |
SEC
News |
Chart |
Request a new note
C
A N
S L
I M
|
RGR
-
NYSE
Sturm Ruger & Co Inc
CONSUMER DURABLES - Sporting Goods
|
$73.85
|
-4.20
-5.38% |
$77.62
|
496,202
146.16% of 50 DAV
50 DAV is 339,500
|
$85.93
-14.06%
|
1/8/2014
|
$78.87
|
PP = $80.38
|
|
MB = $84.40
|
Most Recent Note - 1/24/2014 4:12:59 PM
G- Violated its 50 DMA line with today's loss on higher volume triggering a technical sell signal. Color code is changed to green. A prompt rebound above the 50 DMA line is needed for its outlook to improve. Disciplined investors always limit losses by selling any stock if it falls more than -7% from their purchase price."
>>> FEATURED STOCK ARTICLE : Hit New Highs With 6th Consecutive Gain - 1/13/2014
View all notes |
Set NEW NOTE alert |
CANSLIM.net Company Profile |
SEC
News |
Chart |
Request a new note
C
A N
S L
I M
|
SFUN
-
NYSE
Soufun Hldgs Ltd Ads A
INTERNET - Internet Information Providers
|
$81.57
|
-5.90
-6.75% |
$85.22
|
2,848,219
243.35% of 50 DAV
50 DAV is 1,170,400
|
$95.39
-14.49%
|
10/17/2013
|
$58.02
|
PP = $53.87
|
|
MB = $56.56
|
Most Recent Note - 1/24/2014 11:33:48 AM
G - Gapped down for a 2nd consecutive session today, retreating from its all-time high after getting very extended from any sound base. Its 50 DMA line ($76.97 now) defines important support to watch.
>>> FEATURED STOCK ARTICLE : Extended From Base Following More Volume-Driven Gains - 1/10/2014
View all notes |
Set NEW NOTE alert |
CANSLIM.net Company Profile |
SEC
News |
Chart |
Request a new note
C
A N
S L
I M
|
SILC
-
NASDAQ
Silicom Ltd
COMPUTER HARDWARE - Networking andamp; Communication Dev
|
$61.00
|
+0.75
1.24% |
$62.63
|
259,036
753.01% of 50 DAV
50 DAV is 34,400
|
$62.67
-2.66%
|
12/23/2013
|
$44.62
|
PP = $46.25
|
|
MB = $48.56
|
Most Recent Note - 1/24/2014 12:53:14 PM
G - Holding its ground today amid widespread weakness. Gapped up for a considerable volume-driven gain and new 52-week high on the prior session. Reported earnings +92% on +52% sales for the Dec '13 quarter, beating consensus estimates. See the latest FSU analysis for more details and annotated graphs.
>>> FEATURED STOCK ARTICLE : Considerable Gap Up Following Strong Earnings Report - 1/23/2014
View all notes |
Set NEW NOTE alert |
CANSLIM.net Company Profile |
SEC
News |
Chart |
Request a new note
C
A N
S L
I M
|
SSNC
-
NASDAQ
S S & C Technologies
COMPUTER SOFTWARE and SERVICES - Application Software
|
$42.69
|
-0.67
-1.55% |
$43.27
|
335,138
127.33% of 50 DAV
50 DAV is 263,200
|
$46.61
-8.40%
|
10/22/2013
|
$39.17
|
PP = $40.04
|
|
MB = $42.04
|
Most Recent Note - 1/22/2014 5:34:13 PM
G - Halted its slide above its 50 DMA line today while tallying a volume-driven gain. Recently enduring distributional pressure. More damaging losses would raise greater concerns.
>>> FEATURED STOCK ARTICLE : Enduring Distributional Pressure While Retreating Near Prior Highs - 1/16/2014
View all notes |
Set NEW NOTE alert |
CANSLIM.net Company Profile |
SEC
News |
Chart |
Request a new note
C
A N
S L
I M
|
Symbol/Exchange
Company Name
Industry Group |
PRICE |
CHANGE
(%Change) |
Day High |
Volume
(% DAV)
(% 50 day avg vol) |
52 Wk Hi
% From Hi |
Featured
Date |
Price
Featured |
Pivot Featured |
|
Max Buy |
ULTI
-
NASDAQ
Ultimate Software Group
INTERNET - Internet Software and Services
|
$155.17
|
-2.39
-1.52% |
$158.65
|
207,960
153.14% of 50 DAV
50 DAV is 135,800
|
$162.88
-4.73%
|
10/16/2013
|
$142.95
|
PP = $151.18
|
|
MB = $158.74
|
Most Recent Note - 1/22/2014 5:35:25 PM
G - Finished at a best-ever close with above average volume behind today's 4th consecutive gain. Below its 50 DMA line the recent low ($144.04 on 12/12/13) defines the next near-term support to watch.
>>> FEATURED STOCK ARTICLE : Gain on Light Volume While Inching Above 50-Day Average - 12/26/2013
View all notes |
Set NEW NOTE alert |
CANSLIM.net Company Profile |
SEC
News |
Chart |
Request a new note
C
A N
S L
I M
|
VRX
-
NYSE
Valeant Pharmaceuticals
DRUGS - Drug Manufacturers - Other
|
$132.12
|
-2.90
-2.15% |
$133.41
|
1,712,249
148.23% of 50 DAV
50 DAV is 1,155,100
|
$140.36
-5.87%
|
9/11/2013
|
$100.26
|
PP = $105.50
|
|
MB = $110.78
|
Most Recent Note - 1/21/2014 5:22:41 PM
G - Touched a new all-time high then reversed into the red today. It is extended from any sound base after volume-driven gains. Its 50 DMA line and prior highs near $115 define near-term support to watch. See the latest FSU analysis for more details and new annotated graphs.
>>> FEATURED STOCK ARTICLE : Bullish Action Has Continued Despite Fundamental Concerns - 1/21/2014
View all notes |
Set NEW NOTE alert |
CANSLIM.net Company Profile |
SEC
News |
Chart |
Request a new note
C
A N
S L
I M
|
YNDX
-
NASDAQ
Yandex N V Class A
INTERNET - Internet Information Providers
|
$38.02
|
-2.85
-6.97% |
$40.15
|
6,491,536
276.90% of 50 DAV
50 DAV is 2,344,400
|
$45.42
-16.29%
|
11/27/2013
|
$39.61
|
PP = $42.10
|
|
MB = $44.21
|
Most Recent Note - 1/24/2014 11:29:01 AM
G - Violated its 50 DMA line with today's 3rd consecutive loss on ever-increasing volume, raising concerns and triggering a technical sell signal. Only a prompt rebound above the 50 DMA line would help its outlook improve.
>>> FEATURED STOCK ARTICLE : Best Ever Close With Gain on Light Volume - 12/31/2013
View all notes |
Set NEW NOTE alert |
CANSLIM.net Company Profile |
SEC
News |
Chart |
Request a new note
C
A N
S L
I M
|
YY
-
NASDAQ
YY Inc Ads
INTERNET - Internet Service Providers
|
$59.79
|
-3.98
-6.24% |
$63.48
|
2,951,454
202.33% of 50 DAV
50 DAV is 1,458,700
|
$72.78
-17.85%
|
1/3/2014
|
$55.08
|
PP = $56.85
|
|
MB = $59.69
|
Most Recent Note - 1/24/2014 4:10:35 PM
G - Down today for a 3rd big loss with above average volume in the span of 4 sessions, enduring damaging distributional pressure amid widespread weakness in China-related companies. Prior highs in the $56 area define initial support to watch above its 50 DMA line.
>>> FEATURED STOCK ARTICLE : Finished Strong With High Volume After Featured in Mid-Day Report - 1/3/2014
View all notes |
Set NEW NOTE alert |
CANSLIM.net Company Profile |
SEC
News |
Chart |
Request a new note
C
A N
S L
I M
|
|
|
|
THESE ARE NOT BUY RECOMMENDATIONS!
Comments contained in the body of this report are technical
opinions only. The material herein has been obtained
from sources believed to be reliable and accurate, however,
its accuracy and completeness cannot be guaranteed.
This site is not an investment advisor, hence it does
not endorse or recommend any securities or other investments.
Any recommendation contained in this report may not
be suitable for all investors and it is not to be deemed
an offer or solicitation on our part with respect to
the purchase or sale of any securities. All trademarks,
service marks and trade names appearing in this report
are the property of their respective owners, and are
likewise used for identification purposes only.
This report is a service available
only to active Paid Premium Members.
You may opt-out of receiving report notifications
at any time. Questions or comments may be submitted
by writing to Premium Membership Services 665 S.E. 10 Street, Suite 201 Deerfield Beach, FL 33441-5634 or by calling 1-800-965-8307
or 954-785-1121.
|
|
|

