You are not logged in.
This means you
CAN ONLY VIEW reports that were published prior to Monday, April 14, 2025.
You
MUST UPGRADE YOUR MEMBERSHIP if you want to see any current reports.
AFTER MARKET UPDATE - THURSDAY, JANUARY 23RD, 2014
Previous After Market Report Next After Market Report >>>
|
|
|
|
DOW |
-175.99 |
16,197.35 |
-1.07% |
|
Volume |
765,238,120 |
+24% |
|
Volume |
2,001,550,980 |
+7% |
|
NASDAQ |
-24.13 |
4,218.87 |
-0.57% |
|
Advancers |
1,019 |
32% |
|
Advancers |
802 |
30% |
|
S&P 500 |
-16.40 |
1,828.46 |
-0.89% |
|
Decliners |
2,070 |
65% |
|
Decliners |
1,797 |
67% |
|
Russell 2000 |
-8.90 |
1,172.40 |
-0.75% |
|
52 Wk Highs |
91 |
|
|
52 Wk Highs |
105 |
|
|
S&P 600 |
-4.58 |
662.64 |
-0.69% |
|
52 Wk Lows |
39 |
|
|
52 Wk Lows |
23 |
|
|
 |
Weak Action Punished Dow Industrials Worst
Kenneth J. Gruneisen - Passed the CAN SLIM® Master's Exam
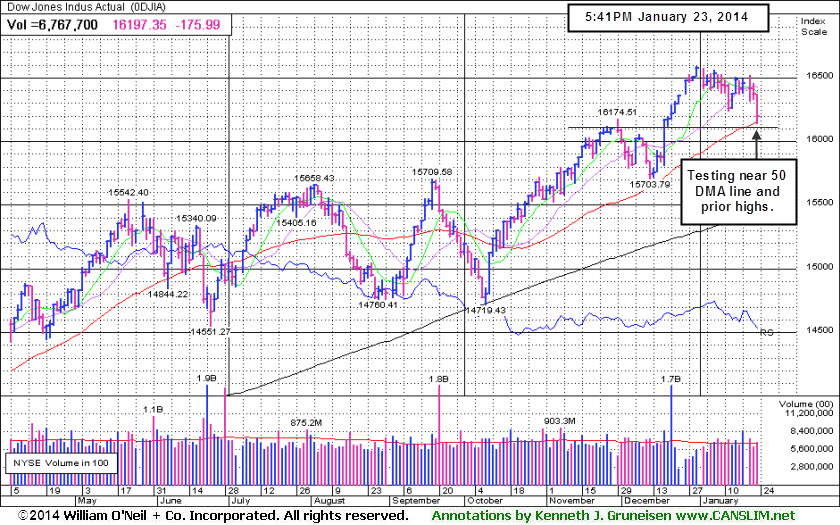
Behind Thursday's solidly negative session for the major indices the volume totals were reported higher than the prior trading session's volume totals on the NYSE and on the Nasdaq exchange, showing that the institutional crowd was increasing their selling efforts. Breadth was negative as decliners led advancers by more than 2-1 on the NYSE and on the Nasdaq exchange. There were 25 high-ranked companies from the CANSLIM.net Leaders List that made new 52-week highs and appeared on the CANSLIM.net BreakOuts Page, down from a total of 61 stocks on the prior session. The list of stocks hitting new 52-week highs outnumbered new lows on the Nasdaq exchange and on the NYSE. There were gains for 6 of the 20 high-ranked companies currently included on the Featured Stocks Page. The Market (M criteria) has encountered distributional pressure and leadership (stocks hitting new highs) has waned. The uptrend which came under recent pressure now threatens to earn the label of being in another "correction". Such weakness serves as a reminder for investors to use caution and remain disciplined in following proper buy and sell rules under the fact-based investment system.
Stocks retreated as a Chinese manufacturing gauge contracted for the first time in six months. On our shores, home prices posted the smallest monthly gain since July 2012 while existing home sales increased for the first time in four months. Other reports showed claims for unemployment benefits held near a one-month low and the index of leading indicators rose in December.
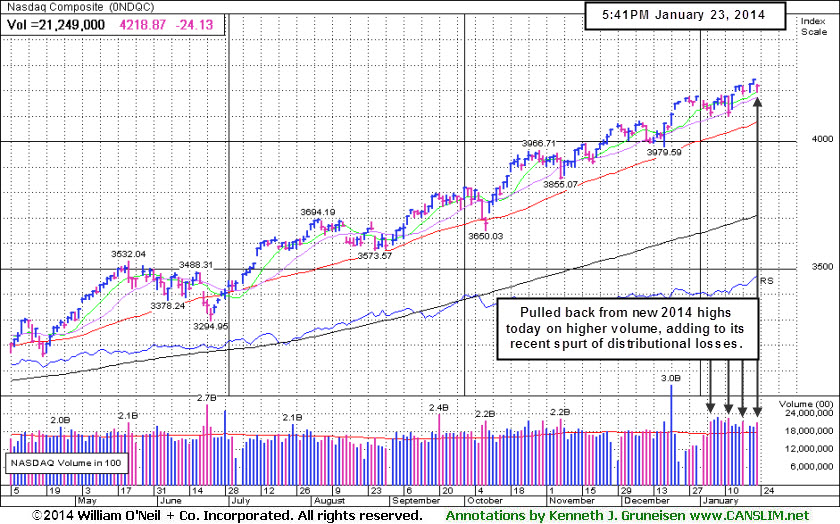
PICTURED 1: The Nasdaq Composite Index pulled back from a new 2014 high hit on the prior session, however the loss on higher volume added to its recent spurt of distributional losses.
Overall, nine of the 10 S&P 500 sectors finished in negative territory. Financials and materials were the worst performing groups as JP Morgan Chase & Co (JPM -1.94%) and DuPont (DD -2.02%) fell. Industrials and health care stocks also retreated. Precision Castparts (PCP -3.54%) missed earnings expectations. Netflix (NFLX +16.48%) posted a big gain after its latest earnings and encouraging forecast. Shares of Johnson & Johnson (JNJ -1.68) after the company issued a disappointing outlook for 2014.
Treasuries snapped a two-day slump. The 10-year note rose 24/32 to yield 2.78%. The 30-year bond nearly gained a full point and a half to yield 3.68%.
Investors should be watchful for any individual issues flashing technical sell signals. The CANSLIM.net Featured Stocks Page shows the most action-worthy candidates and their latest notes and a Headline Link directs members to the latest detailed analysis with data-packed graphs annotated by a Certified expert along with links to additional resources. The Premium Member Homepage includes "dynamic archives" to all prior pay reports published. Watch for an announcement via email concerning the next WEBCAST.
PICTURED 2: The Dow Jones Industrial Average slumped near its 50-day moving average (DMA) line and prior highs which may serve as a support level. More damaging losses leading to a violation would be a worrisome sign that the market conditions are eroding, further reminding investors to stand ready to reduce their market exposure.
|
 Kenneth J. Gruneisen started out as a licensed stockbroker in August 1987, a couple of months prior to the historic stock market crash that took the Dow Jones Industrial Average down -22.6% in a single day. He has published daily fact-based fundamental and technical analysis on high-ranked stocks online for two decades. Through FACTBASEDINVESTING.COM, Kenneth provides educational articles, news, market commentary, and other information regarding proven investment systems that work in good times and bad.
Comments contained in the body of this report are technical opinions only and are not necessarily those of Gruneisen Growth Corp. The material herein has been obtained from sources believed to be reliable and accurate, however, its accuracy and completeness cannot be guaranteed. Our firm, employees, and customers may effect transactions, including transactions contrary to any recommendation herein, or have positions in the securities mentioned herein or options with respect thereto. Any recommendation contained in this report may not be suitable for all investors and it is not to be deemed an offer or solicitation on our part with respect to the purchase or sale of any securities. |
|
 |
Financial, Tech, and Energy-Related Groups Fell
Kenneth J. Gruneisen - Passed the CAN SLIM® Master's Exam
Financial shares' losses weighed on the major averages as the Bank Index ($BKX -1.64%) and Broker/Dealer Index ($XBD -1.37%) fell on Thursday. The tech sector saw losses from Networking Index ($NWX -1.36%) and the Semiconductor Index ($SOX -1.09%) while the Biotechnology Index ($BTK +0.14%) eked out a small gain and the Retail Index ($RLX -0.11%) inched lower. Energy-related shares pulled back as the Oil Services Index ($OSX -1.73%) and Integrated Oil Index ($XOI -0.82%) slumped. The Gold & Silver Index ($XAU +2.48%) was a standout gainer.
Charts courtesy www.stockcharts.com
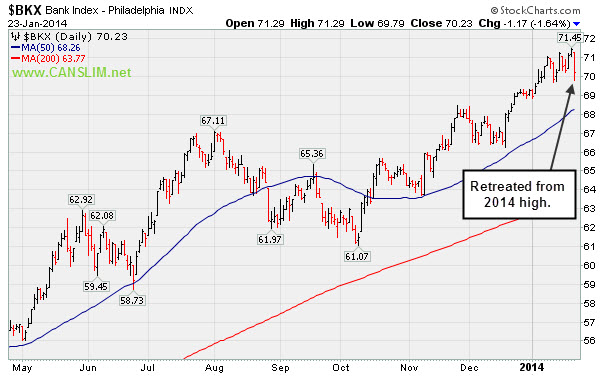
PICTURED: The Bank Index ($BKX -1.64%) retreated from 2014 highs.
| Oil Services |
$OSX |
272.68 |
-4.81 |
-1.73% |
-2.97% |
| Integrated Oil |
$XOI |
1,464.19 |
-12.16 |
-0.82% |
-2.59% |
| Semiconductor |
$SOX |
541.49 |
-5.98 |
-1.09% |
+1.21% |
| Networking |
$NWX |
334.25 |
-4.59 |
-1.36% |
+3.18% |
| Broker/Dealer |
$XBD |
161.02 |
-2.24 |
-1.37% |
+0.29% |
| Retail |
$RLX |
908.82 |
-1.02 |
-0.11% |
-3.30% |
| Gold & Silver |
$XAU |
93.45 |
+2.26 |
+2.48% |
+11.05% |
| Bank |
$BKX |
70.23 |
-1.17 |
-1.64% |
+1.40% |
| Biotech |
$BTK |
2,618.67 |
+3.72 |
+0.14% |
+12.37% |
|
|
|
 |
Considerable Gap Up Following Strong Earnings Report
Kenneth J. Gruneisen - Passed the CAN SLIM® Master's Exam
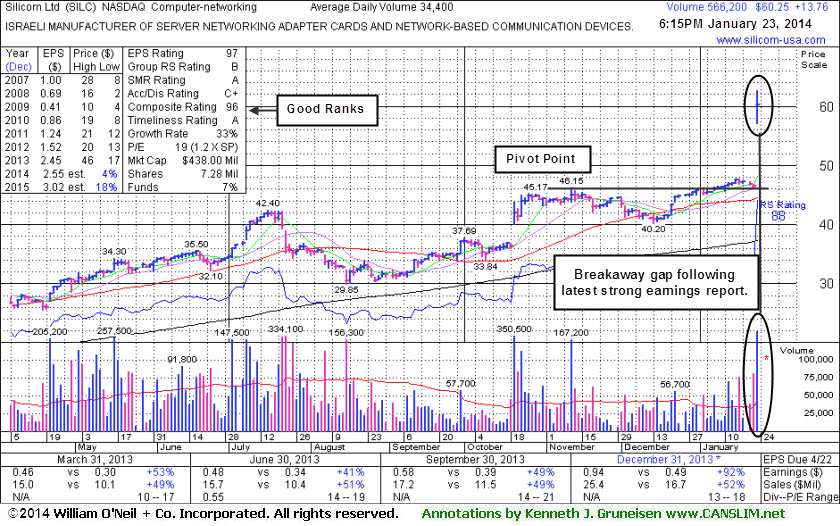
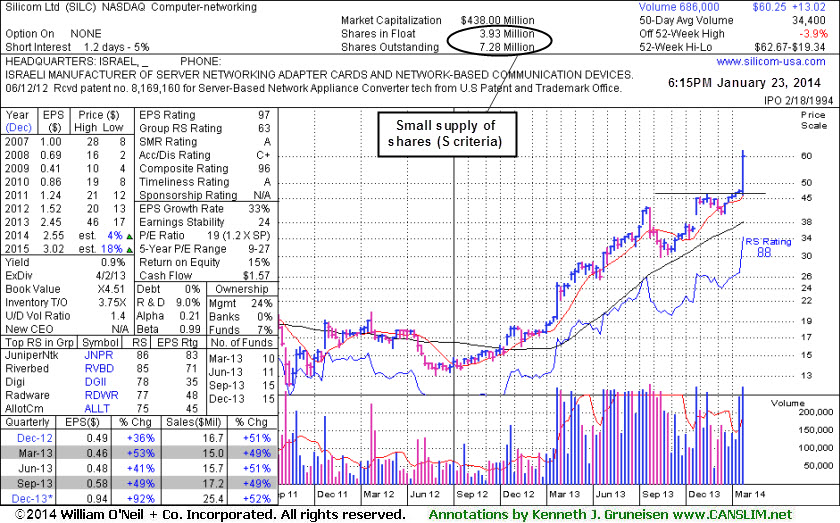
Silicom Ltd (SILC +$13.76 or +29.6% to $60.25) reported earnings +92% on +52% sales for the Dec '13 quarter, beating consensus estimates and continuing its streak of strong quarterly earnings increases satisfying the C criteria. It gapped up today for a considerable volume-driven gain and new 52-week high. Its color code was changed to green after exceeding its "max buy" level.
SILC was last shown in this FSU section on 12/24/13 with annotated graphs under the headline, "Stock With Small Supply Has Formed a Sound Base Pattern". The high-ranked Computer - Networking firm had finished strong after highlighted in the 12/23/13 mid-day report in yellow with pivot point cited based on its 11/12/13 high plus 10 cents (read here). Members were reminded -
"Subsequent volume-driven gains above the pivot point may trigger a technical buy signal. Disciplined investors know there is no advantage to buying "early", but after fresh proof of institutional buying demand the odds are considered most favorable for any stock to continue on to produce meaningful gains."
"After a downturn in FY '08 and '09 earnings its annual earnings (A criteria) history has shown strong and steady growth. Its small supply (S criteria) of only 3.93 million shares in the public float can contribute to greater price volatility in the event of institutional buying or selling. The number of top-rated funds owning its shares rose from 7 in Dec '12 to 15 in Sep '13, a reassuring sign concerning the I criteria. Its current Up/Down Volume Ratio of 1.8 is also an unbiased indication its shares have been under accumulation over the past 50 days."
Below is a summary of recent notes which alerted members when taking action may have been appropriate under the fact-based investment system's guidelines. Remember that your upgraded membership allows you to chose the "Set NEW NOTE alert" link for any stocks you wish closely monitor, then you will automatically receive new notes from our experts directly via email as soon as they are published, keeping you informed ahead of the subsequently published reports. All prior notes on stocks can be reviewed via the "View all notes" links and via the Company Profile pages members can go back and review all Featured Articles & Daily Graphs annotated in prior reports.
1/22/2014 12:40:47 PM - Y - Still hovering near its 52-week high following a streak of 10 consecutive small gains. It remains below its "max buy" level with near-term support to watch at its 50 DMA line.
1/16/2014 1:29:34 PM - Y - Inching to yet another new 52-week high with today's 10th consecutive small gain, yet it remains below its "max buy" level. Last noted on 1/13/14, its small gain on the session with +122% above average volume confirmed a technical buy signal.
1/13/2014 1:21:24 PM - Y - Hitting another new 52-week high with today's 7th consecutive small gain, inching higher without especially great volume conviction. Volume should be a minimum of +40% above average behind gains above a stock's pivot point to trigger a proper technical buy signal.
|
|
|
Color Codes Explained :
Y - Better candidates highlighted by our
staff of experts.
G - Previously featured
in past reports as yellow but may no longer be buyable under the
guidelines.
***Last / Change / Volume data in this table is the closing quote data***
Symbol/Exchange
Company Name
Industry Group |
PRICE |
CHANGE
(%Change) |
Day High |
Volume
(% DAV)
(% 50 day avg vol) |
52 Wk Hi
% From Hi |
Featured
Date |
Price
Featured |
Pivot Featured |
|
Max Buy |
ARMH
-
NASDAQ
A R M Holdings Plc Ads
ELECTRONICS - Semiconductor - Specialized
|
$48.88
|
-1.44
-2.86% |
$49.15
|
2,489,844
157.65% of 50 DAV
50 DAV is 1,579,300
|
$55.26
-11.55%
|
12/23/2013
|
$54.59
|
PP = $52.48
|
|
MB = $55.10
|
Most Recent Note - 1/21/2014 3:14:22 PM
G - Still consolidating near its 50 DMA line ($49.60) which has acted as resistance following damaging losses which triggered technical sell signals. Disciplined investors always limit losses by selling any stock that falls more than -7% from their purchase price.
>>> FEATURED STOCK ARTICLE : No Overhead Supply Remains Following Volume-Driven Breakout - 12/23/2013
View all notes |
Set NEW NOTE alert |
CANSLIM.net Company Profile |
SEC
News |
Chart |
Request a new note
C
A N
S L
I M


|
BITA
-
NYSE
Bitauto Hldgs Ltd Ads
INTERNET - Internet Information Providers
|
$34.98
|
-3.22
-8.43% |
$37.68
|
2,207,595
162.23% of 50 DAV
50 DAV is 1,360,800
|
$39.84
-12.20%
|
1/8/2014
|
$33.00
|
PP = $35.14
|
|
MB = $36.90
|
 Most Recent Note - 1/23/2014 3:18:58 PM
Y - Down considerably today amid widespread weakness in China-related issues. Color code is changed to yellow after retreating below its "max buy" level. Prior highs in the $35 area define support to watch above its 50 DMA line.
>>> FEATURED STOCK ARTICLE : Finished Strong and Challenged Pivot Point After Highlighted in Mid-Day Report - 1/8/2014
View all notes |
Set NEW NOTE alert |
CANSLIM.net Company Profile |
SEC
News |
Chart |
Request a new note
C
A N
S L
I M
|
CELG
-
NASDAQ
Celgene Corp
DRUGS - Drug Manufacturers - Major
|
$168.55
|
-1.43
-0.84% |
$169.80
|
2,823,510
105.01% of 50 DAV
50 DAV is 2,688,700
|
$174.66
-3.50%
|
9/12/2013
|
$149.50
|
PP = $150.02
|
|
MB = $157.52
|
Most Recent Note - 1/21/2014 3:18:01 PM
G - Hovering within close striking distance of its 52-week high and still consolidating above its 50 DMA line which has acted as support recently. Subsequent violations would raise greater concerns and trigger technical sell signals.
>>> FEATURED STOCK ARTICLE : Found Support Above 50-Day Average After Gapping Down on Prior Session - 1/7/2014
View all notes |
Set NEW NOTE alert |
CANSLIM.net Company Profile |
SEC
News |
Chart |
Request a new note
C
A N
S L
I M
|
EGOV
-
NASDAQ
N I C Inc
INTERNET - Internet Software and Services
|
$23.41
|
-0.43
-1.80% |
$23.90
|
224,470
88.69% of 50 DAV
50 DAV is 253,100
|
$25.99
-9.93%
|
12/20/2013
|
$24.00
|
PP = $26.09
|
|
MB = $27.39
|
Most Recent Note - 1/21/2014 3:18:49 PM
G - Quietly sputtering below its 50 DMA line. A rally above recent resistance in the $25-26 area is needed for its technical stance to turn bullish. Meanwhile, a violation of the recent low ($22.17 on 12/16/13) would raise concern as that level defines near-term support above its 200 DMA line.
>>> FEATURED STOCK ARTICLE : Rebounded Above 50-Day Average; Relative Strength Rating Waned - 12/27/2013
View all notes |
Set NEW NOTE alert |
CANSLIM.net Company Profile |
SEC
News |
Chart |
Request a new note
C
A N
S L
I M
|
EQM
-
NYSE
E Q T Midstream Partners
ENERGY - Oil and Gas Pipelines
|
$62.83
|
+1.17
1.90% |
$63.66
|
93,134
87.04% of 50 DAV
50 DAV is 107,000
|
$62.07
1.22%
|
12/12/2013
|
$53.17
|
PP = $56.51
|
|
MB = $59.34
|
Most Recent Note - 1/17/2014 5:28:02 PM
G - Reversed into the red again today for a loss on light volume. It is very extended from any sound base pattern, and prior highs in the $56 area define support to watch on pullbacks. See the latest FSU analysis for more details and new annotated graphs.
>>> FEATURED STOCK ARTICLE : Extended From Base After Six Consecutive Weekly Gains - 1/17/2014
View all notes |
Set NEW NOTE alert |
CANSLIM.net Company Profile |
SEC
News |
Chart |
Request a new note
C
A N
S L
I M
|
Symbol/Exchange
Company Name
Industry Group |
PRICE |
CHANGE
(%Change) |
Day High |
Volume
(% DAV)
(% 50 day avg vol) |
52 Wk Hi
% From Hi |
Featured
Date |
Price
Featured |
Pivot Featured |
|
Max Buy |
FB
-
NASDAQ
Facebook Inc Cl A
INTERNET
|
$56.63
|
-0.88
-1.53% |
$56.68
|
47,961,097
75.00% of 50 DAV
50 DAV is 63,948,100
|
$59.31
-4.52%
|
12/12/2013
|
$51.40
|
PP = $54.93
|
|
MB = $57.68
|
Most Recent Note - 1/21/2014 5:25:12 PM
G - Rallied for a best-ever close with today's gain backed below average volume. Prior highs in the $54 area acted as support during its recent consolidation. Disciplined investors always limit losses by selling any stock that falls more than -7% from their purchase price.
>>> FEATURED STOCK ARTICLE : Following New Offering Prior Highs Acted As Support - 1/15/2014
View all notes |
Set NEW NOTE alert |
CANSLIM.net Company Profile |
SEC
News |
Chart |
Request a new note
C
A N
S L
I M
|
GNRC
-
NYSE
Generac Hldgs Inc
CONSUMER DURABLES - Electronic Equipment
|
$50.18
|
-0.88
-1.72% |
$51.12
|
576,091
85.89% of 50 DAV
50 DAV is 670,700
|
$57.29
-12.41%
|
11/26/2013
|
$53.02
|
PP = $52.42
|
|
MB = $55.04
|
Most Recent Note - 1/21/2014 3:24:08 PM
G - Today's gain has it rebounding toward its 50 DMA line which may act as resistance after volume-driven losses raised concerns last week. A prompt rebound above its 50 DMA line is needed for its outlook to improve.
>>> FEATURED STOCK ARTICLE : Volume Totals Cooling While Holding Ground Near Highs - 1/2/2014
View all notes |
Set NEW NOTE alert |
CANSLIM.net Company Profile |
SEC
News |
Chart |
Request a new note
C
A N
S L
I M
|
HLF
-
NYSE
Herbalife Ltd
DRUGS - Nutrition and Weight Management
|
$65.92
|
-7.61
-10.35% |
$73.89
|
15,761,957
508.09% of 50 DAV
50 DAV is 3,102,200
|
$83.51
-21.06%
|
11/22/2013
|
$72.21
|
PP = $75.04
|
|
MB = $78.79
|
Most Recent Note - 1/23/2014 3:14:03 PM
Down considerably today with heavy volume. Encountered resistance at its 50 DMA line after triggering technical sell signals. Disciplined investors always limit losses if any stock falls more than -7% from their purchase price. It will be dropped from the Featured Stocks list tonight
>>> FEATURED STOCK ARTICLE : Volume Totals Cooling While Perched Near Highs - 12/30/2013
View all notes |
Set NEW NOTE alert |
CANSLIM.net Company Profile |
SEC
News |
Chart |
Request a new note
C
A N
S L
I M
|
JAZZ
-
NASDAQ
Jazz Pharmaceuticals Plc
DRUGS - Biotechnology
|
$159.07
|
+2.35
1.50% |
$159.14
|
896,764
114.94% of 50 DAV
50 DAV is 780,200
|
$157.65
0.90%
|
9/30/2013
|
$93.20
|
PP = $89.10
|
|
MB = $93.56
|
Most Recent Note - 1/21/2014 3:20:06 PM
G - Hitting another new 52-week high today with its 4th consecutive gain, very extended from any sound base. Its 50 DMA line defines important support to watch on pullbacks.
>>> FEATURED STOCK ARTICLE : Very Extended From Sound Base Following Big Volume-Driven Gains - 1/14/2014
View all notes |
Set NEW NOTE alert |
CANSLIM.net Company Profile |
SEC
News |
Chart |
Request a new note
C
A N
S L
I M
|
KORS
-
NYSE
Michael Kors Hldgs Ltd
RETAIL - Apparel Stores
|
$80.29
|
+0.54
0.68% |
$80.34
|
3,937,477
93.80% of 50 DAV
50 DAV is 4,197,800
|
$84.58
-5.07%
|
8/6/2013
|
$69.66
|
PP = $66.28
|
|
MB = $69.59
|
Most Recent Note - 1/16/2014 1:20:15 PM
G - Gapped down today, slumping further below its 50 DMA line. Damaging losses on higher volume indicate distributional pressure. Reports quarterly financial results on Tuesday, February 4, 2014, before the market opens.
>>> FEATURED STOCK ARTICLE : Technical Deterioration and RS Rating Slump Raises Concerns - 1/9/2014
View all notes |
Set NEW NOTE alert |
CANSLIM.net Company Profile |
SEC
News |
Chart |
Request a new note
C
A N
S L
I M
|
Symbol/Exchange
Company Name
Industry Group |
PRICE |
CHANGE
(%Change) |
Day High |
Volume
(% DAV)
(% 50 day avg vol) |
52 Wk Hi
% From Hi |
Featured
Date |
Price
Featured |
Pivot Featured |
|
Max Buy |
MRLN
-
NASDAQ
Marlin Business Services
DIVERSIFIED SERVICES - Rental and Leasing Services
|
$28.20
|
+0.12
0.43% |
$28.97
|
44,583
139.32% of 50 DAV
50 DAV is 32,000
|
$29.58
-4.66%
|
12/19/2013
|
$26.69
|
PP = $28.74
|
|
MB = $30.18
|
Most Recent Note - 1/22/2014 5:31:34 PM
Y - Its stalled after recent volume-driven gains triggered a technical buy signal. No resistance remains due to overhead supply. See the latest FSU analysis for more details and new annotated graphs.
>>> FEATURED STOCK ARTICLE : Hovering Near 52-Week High Following Technical Breakout - 1/22/2014
View all notes |
Set NEW NOTE alert |
CANSLIM.net Company Profile |
SEC
News |
Chart |
Request a new note
C
A N
S L
I M
|
PCLN
-
NASDAQ
Priceline.Com Inc
INTERNET - Internet Software and Services
|
$1,208.86
|
-4.43
-0.37% |
$1,214.97
|
532,039
89.98% of 50 DAV
50 DAV is 591,300
|
$1,214.19
-0.44%
|
12/18/2013
|
$1,156.20
|
PP = $1,198.85
|
|
MB = $1,258.79
|
Most Recent Note - 1/16/2014 12:46:57 PM
Y - Perched within close striking distance of its 52-week high while consolidating above its 50 DMA line which has recently acted as support. A volume-driven gain above its pivot point may trigger a technical buy signal, meanwhile, its 50 DMA line and prior low ($1,113.01 on 1/06/13) define near-term support to watch.
>>> FEATURED STOCK ARTICLE : Managed Positive Reversal at 50-Day Moving Average Line - 1/6/2014
View all notes |
Set NEW NOTE alert |
CANSLIM.net Company Profile |
SEC
News |
Chart |
Request a new note
C
A N
S L
I M
|
RGR
-
NYSE
Sturm Ruger & Co Inc
CONSUMER DURABLES - Sporting Goods
|
$78.05
|
-0.45
-0.57% |
$78.44
|
274,239
80.78% of 50 DAV
50 DAV is 339,500
|
$85.93
-9.17%
|
1/8/2014
|
$78.87
|
PP = $80.38
|
|
MB = $84.40
|
Most Recent Note - 1/21/2014 12:16:01 PM
Y - Retreating from its 52-week high following a streak of gains, undercutting prior highs. Previously noted - "Prior highs in the $80 area define initial support to watch on pullbacks. Disciplined investors always limit losses by selling any stock if it falls more than -7% from their purchase price."
>>> FEATURED STOCK ARTICLE : Hit New Highs With 6th Consecutive Gain - 1/13/2014
View all notes |
Set NEW NOTE alert |
CANSLIM.net Company Profile |
SEC
News |
Chart |
Request a new note
C
A N
S L
I M
|
SFUN
-
NYSE
Soufun Hldgs Ltd Ads A
INTERNET - Internet Information Providers
|
$87.47
|
-7.33
-7.73% |
$89.75
|
3,441,491
294.04% of 50 DAV
50 DAV is 1,170,400
|
$95.39
-8.30%
|
10/17/2013
|
$58.02
|
PP = $53.87
|
|
MB = $56.56
|
Most Recent Note - 1/23/2014 12:41:58 PM
G - Gapped down today, retreating from its all-time high after getting very extended from any sound base. Its 50 DMA line ($76.59 now) defines important support to watch.
>>> FEATURED STOCK ARTICLE : Extended From Base Following More Volume-Driven Gains - 1/10/2014
View all notes |
Set NEW NOTE alert |
CANSLIM.net Company Profile |
SEC
News |
Chart |
Request a new note
C
A N
S L
I M
|
SILC
-
NASDAQ
Silicom Ltd
COMPUTER HARDWARE - Networking andamp; Communication Dev
|
$60.25
|
+13.76
29.60% |
$62.67
|
566,753
1,647.54% of 50 DAV
50 DAV is 34,400
|
$47.70
26.31%
|
12/23/2013
|
$44.62
|
PP = $46.25
|
|
MB = $48.56
|
Most Recent Note - 1/23/2014 6:35:13 PM
G - Reported earnings +92% on +52% sales for the Dec '13 quarter, beating consensus estimates. Gapped up today for a considerable volume-driven gain and new 52-week high. Color code was changed to green after exceeding its "max buy" level. See the latest FSU analysis for more details and new annotated graphs.
>>> FEATURED STOCK ARTICLE : Considerable Gap Up Following Strong Earnings Report - 1/23/2014
View all notes |
Set NEW NOTE alert |
CANSLIM.net Company Profile |
SEC
News |
Chart |
Request a new note
C
A N
S L
I M
|
Symbol/Exchange
Company Name
Industry Group |
PRICE |
CHANGE
(%Change) |
Day High |
Volume
(% DAV)
(% 50 day avg vol) |
52 Wk Hi
% From Hi |
Featured
Date |
Price
Featured |
Pivot Featured |
|
Max Buy |
SSNC
-
NASDAQ
S S & C Technologies
COMPUTER SOFTWARE and SERVICES - Application Software
|
$43.36
|
+0.09
0.21% |
$43.40
|
447,342
169.96% of 50 DAV
50 DAV is 263,200
|
$46.61
-6.96%
|
10/22/2013
|
$39.17
|
PP = $40.04
|
|
MB = $42.04
|
Most Recent Note - 1/22/2014 5:34:13 PM
G - Halted its slide above its 50 DMA line today while tallying a volume-driven gain. Recently enduring distributional pressure. More damaging losses would raise greater concerns.
>>> FEATURED STOCK ARTICLE : Enduring Distributional Pressure While Retreating Near Prior Highs - 1/16/2014
View all notes |
Set NEW NOTE alert |
CANSLIM.net Company Profile |
SEC
News |
Chart |
Request a new note
C
A N
S L
I M
|
ULTI
-
NASDAQ
Ultimate Software Group
INTERNET - Internet Software and Services
|
$157.56
|
-2.27
-1.42% |
$159.36
|
162,605
119.74% of 50 DAV
50 DAV is 135,800
|
$162.88
-3.27%
|
10/16/2013
|
$142.95
|
PP = $151.18
|
|
MB = $158.74
|
Most Recent Note - 1/22/2014 5:35:25 PM
G - Finished at a best-ever close with above average volume behind today's 4th consecutive gain. Below its 50 DMA line the recent low ($144.04 on 12/12/13) defines the next near-term support to watch.
>>> FEATURED STOCK ARTICLE : Gain on Light Volume While Inching Above 50-Day Average - 12/26/2013
View all notes |
Set NEW NOTE alert |
CANSLIM.net Company Profile |
SEC
News |
Chart |
Request a new note
C
A N
S L
I M
|
VRX
-
NYSE
Valeant Pharmaceuticals
DRUGS - Drug Manufacturers - Other
|
$135.02
|
-2.80
-2.03% |
$137.06
|
1,164,544
100.82% of 50 DAV
50 DAV is 1,155,100
|
$140.36
-3.80%
|
9/11/2013
|
$100.26
|
PP = $105.50
|
|
MB = $110.78
|
Most Recent Note - 1/21/2014 5:22:41 PM
G - Touched a new all-time high then reversed into the red today. It is extended from any sound base after volume-driven gains. Its 50 DMA line and prior highs near $115 define near-term support to watch. See the latest FSU analysis for more details and new annotated graphs.
>>> FEATURED STOCK ARTICLE : Bullish Action Has Continued Despite Fundamental Concerns - 1/21/2014
View all notes |
Set NEW NOTE alert |
CANSLIM.net Company Profile |
SEC
News |
Chart |
Request a new note
C
A N
S L
I M
|
YNDX
-
NASDAQ
Yandex N V Class A
INTERNET - Internet Information Providers
|
$40.87
|
-1.82
-4.26% |
$43.14
|
4,096,889
174.75% of 50 DAV
50 DAV is 2,344,400
|
$45.42
-10.02%
|
11/27/2013
|
$39.61
|
PP = $42.10
|
|
MB = $44.21
|
Most Recent Note - 1/23/2014 12:51:33 PM
Y - Testing support at its 50 DMA line ($40.50 now) and slumping back below its pivot point with today's loss on higher volume. More damaging losses would raise concerns and trigger a technical sell signal.
>>> FEATURED STOCK ARTICLE : Best Ever Close With Gain on Light Volume - 12/31/2013
View all notes |
Set NEW NOTE alert |
CANSLIM.net Company Profile |
SEC
News |
Chart |
Request a new note
C
A N
S L
I M
|
YY
-
NASDAQ
YY Inc Ads
INTERNET - Internet Service Providers
|
$63.77
|
-5.12
-7.43% |
$65.97
|
3,517,129
241.11% of 50 DAV
50 DAV is 1,458,700
|
$72.78
-12.38%
|
1/3/2014
|
$55.08
|
PP = $56.85
|
|
MB = $59.69
|
Most Recent Note - 1/23/2014 3:15:59 PM
G - Gapped down today, enduring more damaging distributional pressure amid widespread weakness in China-related companies. Prior highs in the $56 area define initial support to watch above its 50 DMA line.
>>> FEATURED STOCK ARTICLE : Finished Strong With High Volume After Featured in Mid-Day Report - 1/3/2014
View all notes |
Set NEW NOTE alert |
CANSLIM.net Company Profile |
SEC
News |
Chart |
Request a new note
C
A N
S L
I M
|
Symbol/Exchange
Company Name
Industry Group |
PRICE |
CHANGE
(%Change) |
Day High |
Volume
(% DAV)
(% 50 day avg vol) |
52 Wk Hi
% From Hi |
Featured
Date |
Price
Featured |
Pivot Featured |
|
Max Buy |
|
|
|
THESE ARE NOT BUY RECOMMENDATIONS!
Comments contained in the body of this report are technical
opinions only. The material herein has been obtained
from sources believed to be reliable and accurate, however,
its accuracy and completeness cannot be guaranteed.
This site is not an investment advisor, hence it does
not endorse or recommend any securities or other investments.
Any recommendation contained in this report may not
be suitable for all investors and it is not to be deemed
an offer or solicitation on our part with respect to
the purchase or sale of any securities. All trademarks,
service marks and trade names appearing in this report
are the property of their respective owners, and are
likewise used for identification purposes only.
This report is a service available
only to active Paid Premium Members.
You may opt-out of receiving report notifications
at any time. Questions or comments may be submitted
by writing to Premium Membership Services 665 S.E. 10 Street, Suite 201 Deerfield Beach, FL 33441-5634 or by calling 1-800-965-8307
or 954-785-1121.
|
|
|