You are not logged in.
This means you
CAN ONLY VIEW reports that were published prior to Monday, April 14, 2025.
You
MUST UPGRADE YOUR MEMBERSHIP if you want to see any current reports.
AFTER MARKET UPDATE - FRIDAY, JANUARY 22ND, 2010
Previous After Market Report Next After Market Report >>>
|
|
|
|
DOW |
-216.90 |
10,172.98 |
-2.09% |
|
Volume |
1,497,614,680 |
-0% |
|
Volume |
2,844,529,960 |
-3% |
|
NASDAQ |
-60.41 |
2,205.29 |
-2.67% |
|
Advancers |
557 |
18% |
|
Advancers |
741 |
26% |
|
S&P 500 |
-24.72 |
1,091.76 |
-2.21% |
|
Decliners |
2,518 |
80% |
|
Decliners |
1,992 |
70% |
|
Russell 2000 |
-11.24 |
617.12 |
-1.79% |
|
52 Wk Highs |
80 |
|
|
52 Wk Highs |
42 |
|
|
S&P 600 |
-5.66 |
329.05 |
-1.69% |
|
52 Wk Lows |
6 |
|
|
52 Wk Lows |
15 |
|
|
 |
Major Averages' Weakness Puts Market Back In A Correction
Adam Sarhan, Contributing Writer,
Stocks got smacked during this shortened holiday week as investors digested a slew of earnings and economic data. Volume was reported slightly lower than Thursday's session on the Nasdaq exchange and on the NYSE which helped the major averages avoid another distribution day. However, the fact that all of the major averages are now in negative territory for the year, negatively reversed on a weekly and monthly basis, and closed below their respective 50 DMA lines suggests the market is in a correction. Decliners trumped advancers by over a 4-to-1 ratio on the NYSE and by almost a 3-to-1 ratio on the Nasdaq exchange. There were only 4 high-ranked companies from the CANSLIM.net Leaders List that made a new 52-week high and appeared on the CANSLIM.net BreakOuts Page, sharply lower than the 15 issues that appeared on the prior session. New 52-week highs still outnumbered new 52-week lows on the NYSE and on the Nasdaq exchange.
US Markets were closed on Monday in observance of the MLK holiday. Buyers showed up on Tuesday and sent stocks soaring in anticipation of a Republican win in Massachusetts. However, volume was lower than the prior session which suggested that large institutions were not aggressively buying stocks. This notion was confirmed on Wednesday when stocks fell in heavy volume. Over the past few days, several high profile companies released lackluster Q4 results which sent stocks lower. For the week, over 60 companies in the S&P 500 reported their fourth quarter results and the fact that the major averages are lower suggests investors are not happy with the results. The latest estimates suggest that earnings rose +67% last quarter which will snap a record nine quarter losing streak. Analysts believe that first quarter earnings will rise +30% as the economy continues to improve. The benchmark S&P 500 Index's valuation rose 25 times its companies’ reported operating profits, which is the highest level since 2002. It will be very interesting to see how stocks react over the next few weeks as companies continue reporting their Q4 results.
On the economic front, China said it will begin taking aggressive measures to curb its explosive economy. On Wednesday, China said that it will restrict overall credit growth to 7.5 trillion yuan ($1.1 trillion) in 2010. China's banking regulator, Liu Mingkang, said some lenders were asked to curb their lending practices because they failed to meet regulatory requirements. On Thursday, China said that its economy surged +10.7% in the fourth quarter which topped the Street's +10.5% estimate. On Friday, investors feared that China's central bank may begin raising rates to curb its uncomfortably strong economy. The fundamental concern here is that if China's economy begins to slow than the global recovery will be adversely affected which increases the odds for a double dip recession.
Domestically, a slew of economic data was released during the shortened holiday week: a weaker than expected Producer Price Index (PPI), a mixed reading from the ailing housing market and weakness in retail sales. Producer prices slowed sharply in December which helped relieve inflation woes and ease pressure on the Fed to begin raising rates in the near future. Housing starts fell but building permits rose which helped offset the negative reading. Meanwhile, the Redbook, which measures sales at chain stores, discounters, and department stores, fell last week which suggests that retailers are having a tough start to the new year. Perhaps the most ominous data point occurred on Thursday when President Obama slapped banks with new regulations on their proprietary trading. Prop desks are some of the most profitable components of these large banks and the threat of new regulation sent a slew of financial shares tumbling.
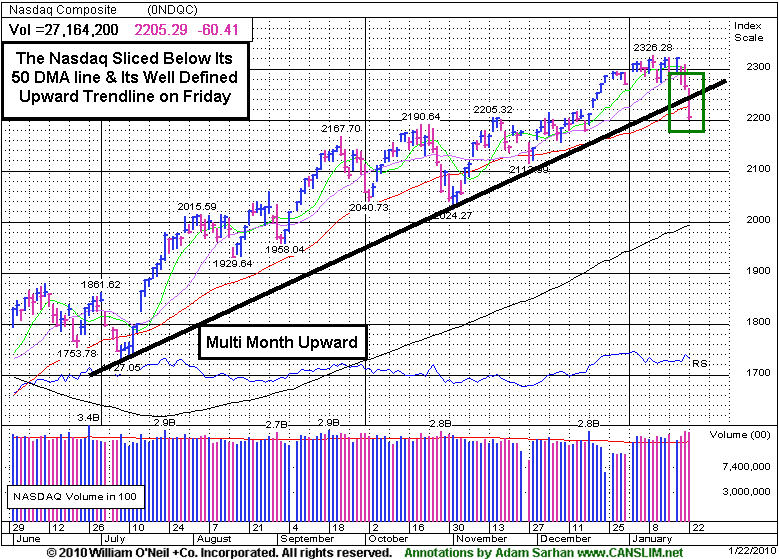
The major averages and leading stocks are now in a correction, as the major averages sliced and closed below their respective 50-day moving average (DMA) lines on Friday. So far, the market's reaction has been tepid at best to the latest round of economic and earnings data. However, the recent series of distribution days coupled with the deleterious action in the major averages suggests large institutions are aggressively selling stocks. The market just ended its 46th week since the March lows. Disciplined investors will now wait for a new follow-through day to be produced before resuming any buying efforts. Until that occurs, patience is key.
PICTURED:The Nasdaq Composite Index sliced below its well defined upward trendline and violated its 50 DMA line on Friday.
|
|
|
 |
Tech, Energy, and Financial Losses Drag Major Averages Down
Kenneth J. Gruneisen - Passed the CAN SLIM® Master's Exam
The tech sector faced pressure on Friday as the Semiconductor Index ($SOX -5.29%) was a standout decliner and the Networking Index ($NWX -3.20%) and Internet Index ($IIX -3.12%) suffered large losses while the Biotechnology Index ($BTK -1.12%) fared better. Energy shares were also among the session's laggards as the Oil Services Index ($OSX -4.01%) and Integrated Oil Index ($XOI -2.05%) sank. Financial shares slumped as the Broker/Dealer Index ($XBD -2.94%) and Bank Index ($BKX -2.65%) slumped more than -2% each, and the Retail Index ($RLX -1.87%) also was a negative influence on the major averages. The Healthcare Index ($HMO -0.86%) suffered a smaller loss, and Gold & Silver Index ($XAU -0.45%) also held its ground better after it was a standout decliner on Thursday's session.
Charts courtesy www.stockcharts.com
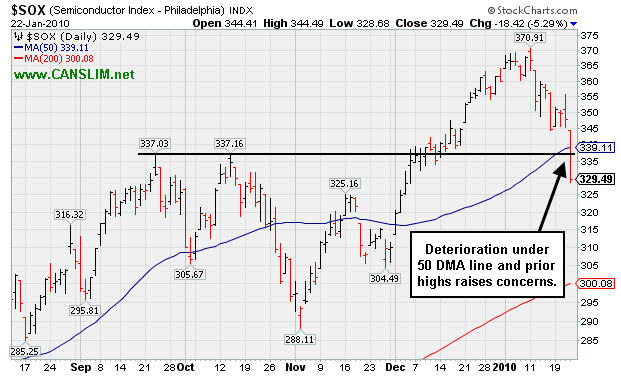
PICTURED: The Semiconductor Index ($SOX -5.29%) suffered a large loss, and its deterioration under its 50-day moving average (DMA) line and prior highs raises concerns that strength in the tech sector is quickly eroding.
| Oil Services |
$OSX |
197.04 |
-8.23 |
-4.01% |
+1.09% |
| Healthcare |
$HMO |
1,506.53 |
-13.05 |
-0.86% |
+2.28% |
| Integrated Oil |
$XOI |
1,037.78 |
-21.69 |
-2.05% |
-2.85% |
| Semiconductor |
$SOX |
329.49 |
-18.42 |
-5.29% |
-8.45% |
| Networking |
$NWX |
228.69 |
-7.55 |
-3.20% |
-1.03% |
| Internet |
$IIX |
224.09 |
-7.21 |
-3.12% |
-4.18% |
| Broker/Dealer |
$XBD |
114.74 |
-3.47 |
-2.94% |
-0.27% |
| Retail |
$RLX |
395.64 |
-7.53 |
-1.87% |
-3.77% |
| Gold & Silver |
$XAU |
158.78 |
-0.71 |
-0.45% |
-5.63% |
| Bank |
$BKX |
46.32 |
-1.26 |
-2.65% |
+8.45% |
| Biotech |
$BTK |
960.44 |
-10.83 |
-1.12% |
+1.94% |
|
|
|
 |
Breakaway Gap Prompts Return To Featured Stocks Page
Kenneth J. Gruneisen - Passed the CAN SLIM® Master's Exam
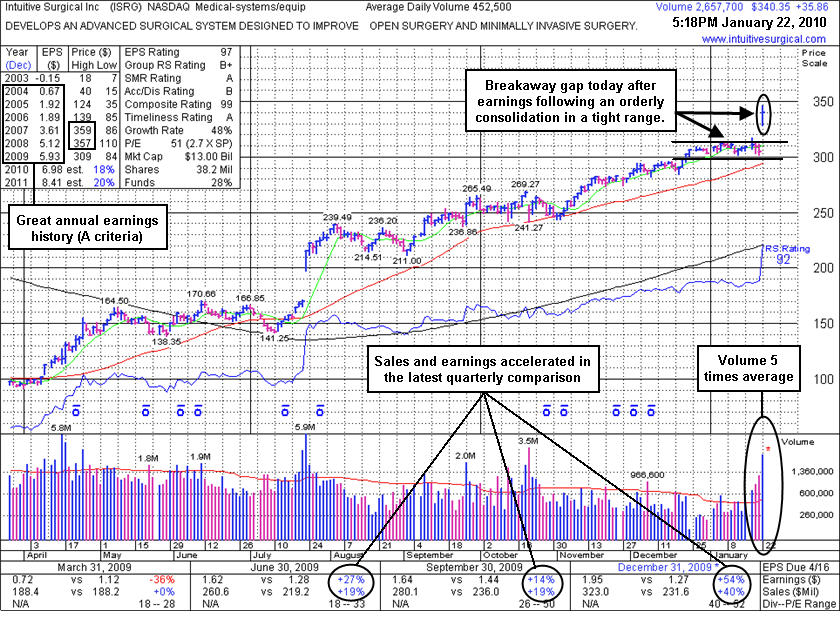
Intuitive Surgical Inc. (ISRG +$35.86 or +11.78% to $340.35) gapped up today and hit a new 52-week high which could be considered a "breakaway gap" following 4-weeks of tight consolidation. It just reported accelerating sales revenues and earnings increases for the period ended Dec 31, 2009, making its turnaround story all the more impressive. The explosive action exemplifies that stocks often have swift reactions to substantial fundamental news, so investors can expect to encounter greater volume and volatility during earnings season. ISRG has rebounded impressively from its March low ($84.86) and is quickly approaching all-time high ($359 in 2007). Its annual earnings history (the A criteria) has been very impressive, and although quarterly comparisons have not shown perfectly steady increases above the +25% guideline, the latest period ended December 31, 2009 showed an impressive acceleration in sales revenues and earnings growth.
Breakaway gaps are a rare exception in which chasing a stock as much as +10% above prior highs is permitted under the investment system's guidelines, however patience may allow investors to accumulate shares on ordinary pullbacks toward recent chart highs. This is why its color code is yellow as of the mid-day report (read here) appearance earlier today, even while it rallied above the prior chart highs by more than +5%. The heavy volume behind the considerable gain indicates institutional (the I criteria) accumulation.
Prior notes outlined its technical deterioration when ISRG was last dropped from the Featured Stocks list on 6/10/08. A proper buy signal was not triggered on or after its appearance in yellow in the 4/10/08 CANSLIM.net Mid-Day BreakOuts Report (read here), however ISRG had returned to the Featured Stock list at that time after having been a previously featured leader that traded up more than 13-fold after first featured in yellow in CANSLIM.net reports in mid-2004.
Keep in mind that distribution days have recently been hurting the market outlook (M criteria), and 3 out of 4 stocks are likely to follow the direction of the major averages. Always limit losses by selling any stock that falls moire than -7% from your purchase price, following Rule #1 of the investment system - keep your losses small!
|
|
|
Color Codes Explained :
Y - Better candidates highlighted by our
staff of experts.
G - Previously featured
in past reports as yellow but may no longer be buyable under the
guidelines.
***Last / Change / Volume quote data in this table corresponds with the timestamp on the note***
Symbol/Exchange
Company Name
Industry Group |
Last |
Chg. |
Vol
% DAV |
Date Featured |
Price Featured |
Latest Pivot Point
Featured |
Status |
| Latest Max Buy Price |
ARST
-
|
$25.52
|
+0.02
|
635,463
124% DAV
510,900
|
12/22/2009
(Date
Featured) |
$25.94
(Price
Featured) |
PP = $27.20 |
G |
| MB = $28.56 |
Most Recent Note - 1/22/2010 4:44:32 PM
G - Positively reversed today for a small gain, closing just 3 cents under its 50 DMA line. Distributional pressure last week negated its latest breakout. ARST was first featured in yellow at $19.91 in the 9/01/09 mid-day report with an annotated daily graph (read here).
>>> The latest Featured Stock Update with an annotated graph appeared on 1/21/2010. click here.
|
|
C
A
S
I |
News |
Chart |
SEC
View all notes Alert
me of new notes
Company
Profile
|
ASIA
-
|
$24.85
|
-0.48
|
1,431,983
111% DAV
1,291,600
|
12/24/2009
(Date
Featured) |
$31.05
(Price
Featured) |
PP = $32.40 |
G |
| MB = $34.02 |
Most Recent Note - 1/22/2010 4:48:14 PM
G - Loss today with average volume was its 11th loss in 13 sessions. It has failed to make a stand since noted on 1/20/10 - "violating its 50-day moving average (DMA) line and breaching recent chart lows, raising concerns and triggering technical sell signals." Traded up as much as +68.13% since first featured in the August 2009 CANSLIM.net News (read here).
>>> The latest Featured Stock Update with an annotated graph appeared on 1/12/2010. click here.
|
|
C
A
S
I |
News |
Chart |
SEC
View all notes Alert
me of new notes
Company
Profile
|
BIDU
- NASDAQ
Baidu Inc Ads
INTERNET - Internet Information Providers
|
$416.90
|
-23.07
|
2,386,426
130% DAV
1,834,400
|
1/13/2010
(Date
Featured) |
$431.25
(Price
Featured) |
PP = $426.75 |
G |
| MB = $448.09 |
Most Recent Note - 1/22/2010 4:48:48 PM
G - Gapped down today and violated its 50 DMA line while falling on higher volume, raising more serious concerns. Its color code was changed to green based on deterioration below its short-term average line. A 1/19/10 gap down for a considerable loss on above average volume pressured it under its November '09 high closes.
>>> The latest Featured Stock Update with an annotated graph appeared on 1/14/2010. click here.
|
|
C
A
S
I |
News |
Chart |
SEC
View all notes Alert
me of new notes
Company
Profile
|
CAAS
- NASDAQ
China Automotive Systems
AUTOMOTIVE - Auto Parts
|
$18.32
|
-0.09
|
2,383,975
203% DAV
1,175,000
|
11/30/2009
(Date
Featured) |
$18.84
(Price
Featured) |
PP = $17.62 |
G |
| MB = $18.50 |
Most Recent Note - 1/22/2010 4:52:32 PM
G - Loss today was its 7th loss in 8 sessions, and it encountered resistance at its 50 DMA line. This week it violated that important short-term average line while many China-based firms encountered heavy distributional pressure. CAAS was actually rather late-stage at $18.84 when first featured in the 11/30/09 mid-day report (read here).
>>> The latest Featured Stock Update with an annotated graph appeared on 1/15/2010. click here.
|
|
C
A
S
I |
News |
Chart |
SEC
View all notes Alert
me of new notes
Company
Profile
|
CACC
- NASDAQ
Credit Acceptance Corp
FINANCIAL SERVICES - Credit Services
|
$49.08
|
-0.41
|
35,982
77% DAV
46,800
|
9/29/2009
(Date
Featured) |
$33.48
(Price
Featured) |
PP = $37.10 |
G |
| MB = $38.96 |
Most Recent Note - 1/22/2010 4:54:32 PM
G - Stubbornly holding its ground near all-time highs, extended from any sound base. Its 50 DMA line is an important support level to watch now.
>>> The latest Featured Stock Update with an annotated graph appeared on 1/8/2010. click here.
|
|
C
A
S
I |
News |
Chart |
SEC
View all notes Alert
me of new notes
Company
Profile
|
CRM
- NYSE
Salesforce.com Inc
INTERNET - Internet Software & Services
|
$64.54
|
-2.34
|
2,197,172
114% DAV
1,928,600
|
12/18/2009
(Date
Featured) |
$67.32
(Price
Featured) |
PP = $67.82 |
G |
| MB = $71.21 |
Most Recent Note - 1/22/2010 4:57:50 PM
G - Considerable loss today on average volume, sinking further below its 50 DMA line and under its November '09 high close triggering technical sell signals. A damaging gap down on 1/12/10 was noted as "indicative of institutional (I criteria) distribution."
>>> The latest Featured Stock Update with an annotated graph appeared on 1/6/2010. click here.
|
|
C
A
S
I |
News |
Chart |
SEC
View all notes Alert
me of new notes
Company
Profile
|
CTRP
- NASDAQ
Ctrip.com Intl Ltd Adr
LEISURE - Resorts & Casinos
|
$31.86
|
-1.08
|
3,089,482
146% DAV
2,121,500
|
1/14/2010
(Date
Featured) |
$36.67
(Price
Featured) |
PP = $39.35 |
G |
| MB = $41.32 |
Most Recent Note - 1/22/2010
G - Down again today after a considerable loss on 1/21/10 with above average volume, violating its 50 DMA line and recent chart lows, triggering technical sell signals. The technical deterioration raised concerns and its color was changed to green. Do not be confused by the 2:1 split effective as of 1/21/10.
>>> The latest Featured Stock Update with an annotated graph appeared on 1/20/2010. click here.
|
|
C
A
S
I |
News |
Chart |
SEC
View all notes Alert
me of new notes
Company
Profile
|
GMCR
- NASDAQ
Green Mtn Coffee Roastrs
FOOD & BEVERAGE - Processed & Packaged Goods
|
$81.16
|
+1.24
|
1,734,375
105% DAV
1,654,800
|
12/28/2009
(Date
Featured) |
$77.49
(Price
Featured) |
PP = $76.50 |
G |
| MB = $80.33 |
Most Recent Note - 1/22/2010 5:14:50 PM
G - Gapped down today, then made a positive reversal. Consolidating, stubbornly holding its ground near all-time highs. Support to watch is at prior high closes in the $76-77 area.
>>> The latest Featured Stock Update with an annotated graph appeared on 1/13/2010. click here.
|
|
C
A
S
I |
News |
Chart |
SEC
View all notes Alert
me of new notes
Company
Profile
|
HEAT
-
|
$13.50
|
-0.75
|
1,639,795
131% DAV
1,250,800
|
1/6/2010
(Date
Featured) |
$17.19
(Price
Featured) |
PP = $17.27 |
G |
| MB = $18.13 |
Most Recent Note - 1/22/2010 5:17:11 PM
G - Down for 3 consecutive sessions, sinking further below its 50 DMA line and triggering a technical sell signal while sinking under prior chart lows in the $14 area.
>>> The latest Featured Stock Update with an annotated graph appeared on 1/19/2010. click here.
|
|
C
A
S
I |
News |
Chart |
SEC
View all notes Alert
me of new notes
Company
Profile
|
ISRG
- NASDAQ
Intuitive Surgical Inc
HEALTH SERVICES - Medical Appliances & Equipment
|
$340.35
|
+35.86
|
2,663,068
589% DAV
452,500
|
1/22/2010
(Date
Featured) |
$340.40
(Price
Featured) |
PP = $314.00 |
Y |
| MB = $329.70 |
Most Recent Note - 1/22/2010 5:33:12 PM
Y - It was featured in yellow in today's mid-day report (read here) after a gap up to a new 52-week high amounted to a "breakaway gap" following 4-weeks of tight consolidation. It reported accelerating sales and earnings increases for the period ended Dec 31, 2009, making its turnaround story all the more impressive. The action exemplifies that stocks often have swift reactions to fundamental news, so investors can expect to encounter greater volume and volatility during earnings season. Its annual earnings history (the A criteria) has been very impressive. ISRG has rebounded impressively from its March low ($84.86) and is quickly approaching all-time high ($359 in 2007). Additional analysis will be provided in this evening's Featured Stock Update section. Notes outlined technical deterioration before and when it was dropped from the Featured Stocks list on 6/10/08. ISRG had traded up more than 13-fold after first featured in yellow in CANSLIM.net reports on August 18, 2004.
>>> The latest Featured Stock Update with an annotated graph appeared on 1/22/2010. click here.
|
|
C
A
S
I |
News |
Chart |
SEC
View all notes Alert
me of new notes
Company
Profile
|
LFT
-
|
$35.40
|
-1.49
|
640,639
144% DAV
444,200
|
11/17/2009
(Date
Featured) |
$31.77
(Price
Featured) |
PP = $33.04 |
G |
| MB = $34.69 |
Most Recent Note - 1/22/2010 5:35:24 PM
G - Today's loss with above average volume indicated more worrisome distributional pressure as it traded further under its 50 DMA line. Widespread weakness in China-based issues has clearly been a factor in recent days.
>>> The latest Featured Stock Update with an annotated graph appeared on 1/5/2010. click here.
|
|
C
A
S
I |
News |
Chart |
SEC
View all notes Alert
me of new notes
Company
Profile
|
PEGA
- NASDAQ
Pegasystems Inc
COMPUTER SOFTWARE & SERVICES - Business Software & Services
|
$33.18
|
-0.95
|
172,866
104% DAV
166,200
|
1/4/2010
(Date
Featured) |
$34.00
(Price
Featured) |
PP = $36.19 |
Y |
| MB = $38.00 |
Most Recent Note - 1/22/2010 5:40:02 PM
Y - Larger loss today with average volume, falling near prior chart lows and its 50 DMA line in the $32-33 area which define important chart support. Prior highs in the $35-36 area have been a stubborn resistance level. Featured in the January 2010 issue of CANSLIM.net News (read here).
>>> The latest Featured Stock Update with an annotated graph appeared on 1/3/2010. click here.
|
|
C
A
S
I |
News |
Chart |
SEC
View all notes Alert
me of new notes
Company
Profile
|
VIT
-
|
$18.30
|
-1.91
|
1,226,400
223% DAV
549,500
|
12/24/2009
(Date
Featured) |
$20.07
(Price
Featured) |
PP = $21.17 |
G |
| MB = $22.23 |
Most Recent Note - 1/22/2010 5:42:11 PM
G - Considerable loss today on more than 2 times average volume, trading under recent chart lows and closing under its 50 DMA line, raising concerns and triggering a technical sell signal. Color code was changed to green based on weak action. Distributional pressure raised concerns as it abruptly reversed under its pivot point following its big 1/06/10 gain on heavy volume and 1/11/10 gain on +36% above average volume.
>>> The latest Featured Stock Update with an annotated graph appeared on 1/11/2010. click here.
|
|
C
A
S
I |
News |
Chart |
SEC
View all notes Alert
me of new notes
Company
Profile
|
|
|
|
THESE ARE NOT BUY RECOMMENDATIONS!
Comments contained in the body of this report are technical
opinions only. The material herein has been obtained
from sources believed to be reliable and accurate, however,
its accuracy and completeness cannot be guaranteed.
This site is not an investment advisor, hence it does
not endorse or recommend any securities or other investments.
Any recommendation contained in this report may not
be suitable for all investors and it is not to be deemed
an offer or solicitation on our part with respect to
the purchase or sale of any securities. All trademarks,
service marks and trade names appearing in this report
are the property of their respective owners, and are
likewise used for identification purposes only.
This report is a service available
only to active Paid Premium Members.
You may opt-out of receiving report notifications
at any time. Questions or comments may be submitted
by writing to Premium Membership Services 665 S.E. 10 Street, Suite 201 Deerfield Beach, FL 33441-5634 or by calling 1-800-965-8307
or 954-785-1121.
|
|
|


