You are not logged in.
This means you
CAN ONLY VIEW reports that were published prior to Wednesday, April 9, 2025.
You
MUST UPGRADE YOUR MEMBERSHIP if you want to see any current reports.
AFTER MARKET UPDATE - THURSDAY, JANUARY 21ST, 2010
Previous After Market Report Next After Market Report >>>
|
|
|
|
DOW |
-213.27 |
10,389.88 |
-2.01% |
|
Volume |
1,500,244,200 |
+42% |
|
Volume |
2,923,735,860 |
+22% |
|
NASDAQ |
-25.55 |
2,265.70 |
-1.12% |
|
Advancers |
651 |
21% |
|
Advancers |
701 |
25% |
|
S&P 500 |
-21.56 |
1,116.48 |
-1.89% |
|
Decliners |
2,398 |
76% |
|
Decliners |
2,019 |
71% |
|
Russell 2000 |
-11.25 |
628.36 |
-1.76% |
|
52 Wk Highs |
174 |
|
|
52 Wk Highs |
94 |
|
|
S&P 600 |
-4.27 |
334.71 |
-1.26% |
|
52 Wk Lows |
4 |
|
|
52 Wk Lows |
10 |
|
|
 |
Distributional Action Raising Concerns As Rally Comes Under Pressure
Adam Sarhan, Contributing Writer,
US stocks got smacked on Thursday after jobless claims rose and concern spread that China will take more aggressive steps to curb its economic growth. Volume was reported higher on the Nasdaq and on the NYSE which marked another damaging distribution day for the major averages. The higher volume declines suggested that large institutions were more aggressively selling stocks again, which puts the market's rally under pressure. Decliners trumped advancers by over a 3-to-1 ratio on the NYSE and by almost a 3-to-1 ratio on the Nasdaq exchange. There were 15 high-ranked companies from the CANSLIM.net Leaders List that made a new 52-week high and appeared on the CANSLIM.net BreakOuts Page, equal to the total of 15 issues that appeared on the prior session. New 52-week highs still solidly outnumbered new 52-week lows on the NYSE and on the Nasdaq exchange.
Overnight, China reported that its economy surged +10.7% in the fourth quarter which was the fastest pace since 2007. The double digit reading topped the Street's estimate for a +10.5% reading. The stronger than expected result led many to believe that China will continue taking steps to curb its red hot economy which may hinder the global economy. Elsewhere, the Labor Department reported that jobless claims jumped by +36,000 to 482,000 in the week of January 16. The stronger than expected reading reflects a backlog of applications from the 2009 holiday season. This was the highest level in two months which led many to lower their estimates for this month's non-farm payrolls report.
The tepid economic data offset better-than-expected results from Goldman Sachs (GS -4.12%), Google Inc. (GOOG +0.44%) and Starbucks Corp (SBUX +1.66%). This week, more than 60 companies in the S&P 500 are slated to report their fourth quarter results which will help investors gauge how companies fared last quarter. The latest estimates suggest that earnings rose +67% last quarter which will snap a record nine quarter losing streak. Analysts believe that first quarter earnings will rise +30% as the economy continues to improve. Last week, the benchmark S&P 500's valuation rose 25 times its companies’ reported operating profits which is the highest level since 2002!
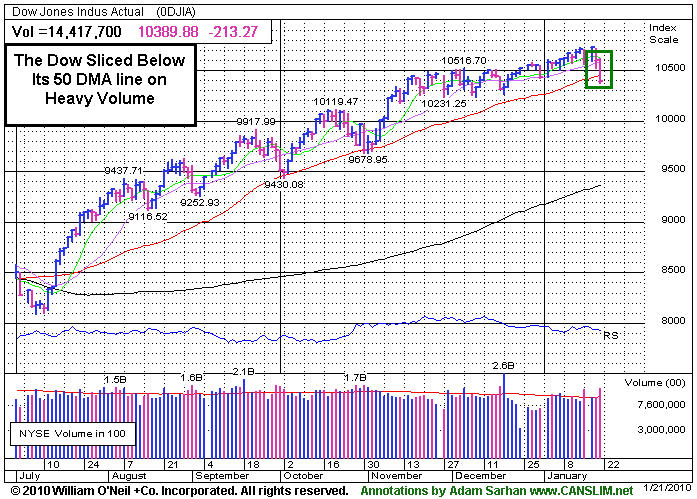
The major averages and leading stocks are pulling back to digest their recent gains as investors make their way through the latest round of economic and earnings data. So far, the market's reaction has been tepid at best, but distribution days have been adding up, and the latest damaging action puts serious pressure on the current rally. The market is in the middle of its 46th week since the March lows and the rally remains intact, albeit under pressure from our point of view. The Dow Jones Industrial Average closed below its 50-day moving average (DMA) line on heavy volume for the first time since October. The Nasdaq Composite Index and the S&P 500 Index closed above their 50 DMA lines which, in the near term, is a healthy sign.
PICTURED: The Dow Jones Industrial Average suffered a triple digit loss on heavier than average volume and closed below its 50 DMA line. Its weak action and putting the current rally under pressure.
|
|
|
 |
Financial Groups Holing Up Better While Gold Group Plunges
Kenneth J. Gruneisen - Passed the CAN SLIM® Master's Exam
The Gold & Silver Index ($XAU -4.66%) fell hard on Tuesday, offering investors no safe haven from the weakening market environment. Other defensive groups also slumped as the Healthcare Index ($HMO -2.64%), Integrated Oil Index ($XOI -2.39%), and Oil Services Index ($OSX -1.82%) lost ground. The Biotechnology Index ($BTK -2.08%) led the tech sector lower while the Networking Index ($NWX -1.02%), Semiconductor Index ($SOX -0.54%), and Internet Index ($IIX -0.27%) ended with smaller losses. A weaker Retail Index ($RLX -0.76%) also was a negative influence while the Bank Index ($BKX -0.50%) posted a modest loss and the Broker/Dealer Index ($XBD +0.29%) posted a gain.
Charts courtesy www.stockcharts.com
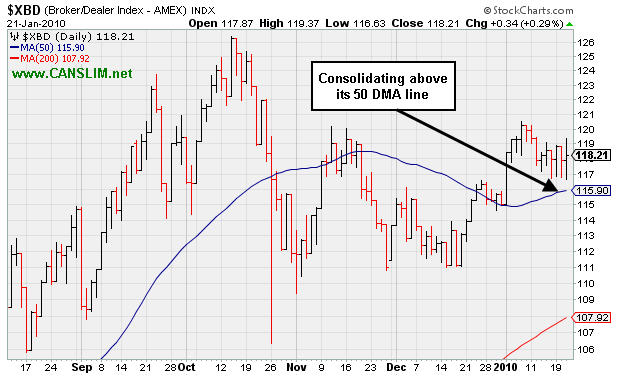
PICTURED: The Broker/Dealer Index ($XBD +0.29%) was a standout on Thursday as it posted a small gain on an otherwise widely negative session for most groups. As long this influential financial index remains above its 50-day moving average (DMA) line its outlook and the overall market outlook is more favorable. Among the group's best gainers today were Knight Capital Group Inc. (NITE +7.73%) and Raymond James Financial Inc. (RJF +6.33%),. however neither company has demonstrated a strong enough sales and earnings history to be included on the watchlist of serious followers of the investment system.
| Oil Services |
$OSX |
205.27 |
-3.81 |
-1.82% |
+5.31% |
| Healthcare |
$HMO |
1,519.58 |
-41.21 |
-2.64% |
+3.17% |
| Integrated Oil |
$XOI |
1,059.47 |
-25.95 |
-2.39% |
-0.82% |
| Semiconductor |
$SOX |
347.91 |
-1.89 |
-0.54% |
-3.33% |
| Networking |
$NWX |
236.24 |
-2.43 |
-1.02% |
+2.24% |
| Internet |
$IIX |
231.30 |
-0.63 |
-0.27% |
-1.09% |
| Broker/Dealer |
$XBD |
118.21 |
+0.34 |
+0.29% |
+2.75% |
| Retail |
$RLX |
403.17 |
-3.07 |
-0.76% |
-1.93% |
| Gold & Silver |
$XAU |
159.49 |
-7.80 |
-4.66% |
-5.21% |
| Bank |
$BKX |
47.58 |
-0.24 |
-0.50% |
+11.40% |
| Biotech |
$BTK |
971.27 |
-20.68 |
-2.08% |
+3.09% |
|
|
|
 |
Weak Action Leads To Close Under 50-Day Average
Kenneth J. Gruneisen - Passed the CAN SLIM® Master's Exam
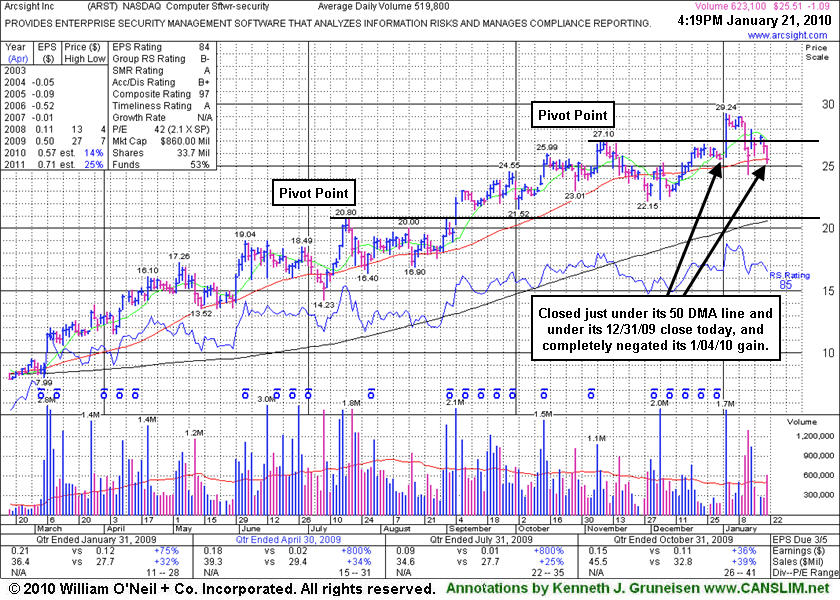
ArcSight, Inc. (ARST -$1.10 or -4.14% to $25.50) suffered a considerable loss today with above average volume. Technically, it closed just below its 50-day moving average (DMA) line (now $25.56), raising more serious concerns. Distributional pressure last week negated its latest breakout. Today's deterioration close under its 12/31/09 close could prove to be a more ominous sign. When last analyzed in this Featured Stock Update section under the headline "Breakout With Triple Average Volume Triggers Fresh Buy Signal" on January 4, 2010 it had gapped up and triggered a technical buy signal as it blasted above its latest pivot point. However, it failed to follow through with additional gains, then losses with above average volume negated its breakout and led to a close back in its prior base, raising concerns.
ARST needs more time to potentially form a new sound base, meanwhile its weak action and deteriorating market conditions (the M criteria) suggest that investors be especially cautious. The high-ranked Computer Software - Security firm has continued putting up solid sales revenues and earnings results since first featured in yellow at $19.91 in the 9/01/09 mid-day report with an annotated daily graph (read here).
|
|
|
Color Codes Explained :
Y - Better candidates highlighted by our
staff of experts.
G - Previously featured
in past reports as yellow but may no longer be buyable under the
guidelines.
***Last / Change / Volume quote data in this table corresponds with the timestamp on the note***
Symbol/Exchange
Company Name
Industry Group |
Last |
Chg. |
Vol
% DAV |
Date Featured |
Price Featured |
Latest Pivot Point
Featured |
Status |
| Latest Max Buy Price |
ARST
-
|
$25.51
|
-1.09
|
623,409
120% DAV
519,800
|
12/22/2009
(Date
Featured) |
$25.94
(Price
Featured) |
PP = $27.20 |
G |
| MB = $28.56 |
Most Recent Note - 1/21/2010 4:12:32 PM
G - Considerable loss today with above average volume, closing just below its 50 DMA line (now $25.56), raising more concerns. Distributional pressure last week negated its latest breakout. ARST was first featured in yellow at $19.91 in the 9/01/09 mid-day report with an annotated daily graph (read here).
>>> The latest Featured Stock Update with an annotated graph appeared on 1/21/2010. click here.
|
|
C
A
S
I |
News |
Chart |
SEC
View all notes Alert
me of new notes
Company
Profile
|
ASIA
-
|
$25.33
|
-1.51
|
2,025,127
159% DAV
1,274,600
|
12/24/2009
(Date
Featured) |
$31.05
(Price
Featured) |
PP = $32.40 |
G |
| MB = $34.02 |
Most Recent Note - 1/21/2010 4:14:51 PM
G - Considerable loss today with above average volume after noted on 1/20/10 when "violating its 50-day moving average (DMA) line and breaching recent chart lows, raising concerns and triggering technical sell signals." Traded up as much as +68.13% since first featured in the August 2009 CANSLIM.net News (read here).
>>> The latest Featured Stock Update with an annotated graph appeared on 1/12/2010. click here.
|
|
C
A
S
I |
News |
Chart |
SEC
View all notes Alert
me of new notes
Company
Profile
|
BIDU
- NASDAQ
Baidu Inc Ads
INTERNET - Internet Information Providers
|
$439.97
|
+0.30
|
1,159,021
62% DAV
1,863,100
|
1/13/2010
(Date
Featured) |
$431.25
(Price
Featured) |
PP = $426.75 |
Y |
| MB = $448.09 |
Most Recent Note - 1/21/2010 4:43:47 PM
Y - Holding its ground with quiet volume today. A 1/19/10 gap down for a considerable loss on above average volume pressured it under its November '09 high closes. Prior chart highs and its 50 DMA line define an important technical support level to watch.
>>> The latest Featured Stock Update with an annotated graph appeared on 1/14/2010. click here.
|
|
C
A
S
I |
News |
Chart |
SEC
View all notes Alert
me of new notes
Company
Profile
|
CAAS
- NASDAQ
China Automotive Systems
AUTOMOTIVE - Auto Parts
|
$18.41
|
-1.43
|
1,763,892
154% DAV
1,145,100
|
11/30/2009
(Date
Featured) |
$18.84
(Price
Featured) |
PP = $17.62 |
G |
| MB = $18.50 |
Most Recent Note - 1/21/2010 4:45:19 PM
G - Considerable loss today with above average volume led to a violation of its 50 DMA line, raising more serious concerns while it and many China-based firms have recently been encountering heavy distributional pressure. CAAS was actually rather late-stage at $18.84 when first featured in the 11/30/09 mid-day report (read here).
>>> The latest Featured Stock Update with an annotated graph appeared on 1/15/2010. click here.
|
|
C
A
S
I |
News |
Chart |
SEC
View all notes Alert
me of new notes
Company
Profile
|
CACC
- NASDAQ
Credit Acceptance Corp
FINANCIAL SERVICES - Credit Services
|
$49.49
|
+0.49
|
83,316
184% DAV
45,400
|
9/29/2009
(Date
Featured) |
$33.48
(Price
Featured) |
PP = $37.10 |
G |
| MB = $38.96 |
Most Recent Note - 1/21/2010 4:48:13 PM
G - Gain today with above average volume for a new all-time high. It is extended from any sound base. Its 50 DMA line is an important support level to watch now.
>>> The latest Featured Stock Update with an annotated graph appeared on 1/8/2010. click here.
|
|
C
A
S
I |
News |
Chart |
SEC
View all notes Alert
me of new notes
Company
Profile
|
CRM
- NYSE
Salesforce.com Inc
INTERNET - Internet Software & Services
|
$66.88
|
-1.67
|
2,236,318
117% DAV
1,905,500
|
12/18/2009
(Date
Featured) |
$67.32
(Price
Featured) |
PP = $67.82 |
G |
| MB = $71.21 |
Most Recent Note - 1/21/2010 4:54:20 PM
G - Loss today on near average volume, closing under its 50 DMA line and just 3 cents above its November '09 high close. A damaging technical gap down on 1/12/10 was indicative of institutional (I criteria) distribution.
>>> The latest Featured Stock Update with an annotated graph appeared on 1/6/2010. click here.
|
|
C
A
S
I |
News |
Chart |
SEC
View all notes Alert
me of new notes
Company
Profile
|
CTRP
- NASDAQ
Ctrip.com Intl Ltd Adr
LEISURE - Resorts & Casinos
|
$32.94
|
-2.41
|
2,929,038
140% DAV
2,090,700
|
1/14/2010
(Date
Featured) |
$36.37
(Price
Featured) |
PP = $39.35 |
G |
| MB = $41.32 |
Most Recent Note - 1/21/2010
G - Considerable loss today with above average volume, violating its 50 DMA line and recent chart lows, triggering technical sell signals. The technical deterioration raises concens and its color was changed to green. Do not be confused by the 2:1 split effective as of today.
>>> The latest Featured Stock Update with an annotated graph appeared on 1/20/2010. click here.
|
|
C
A
S
I |
News |
Chart |
SEC
View all notes Alert
me of new notes
Company
Profile
|
GMCR
- NASDAQ
Green Mtn Coffee Roastrs
FOOD & BEVERAGE - Processed & Packaged Goods
|
$79.92
|
-0.75
|
1,617,238
99% DAV
1,634,900
|
12/28/2009
(Date
Featured) |
$77.49
(Price
Featured) |
PP = $76.50 |
G |
| MB = $80.33 |
Most Recent Note - 1/21/2010 5:12:06 PM
G - Loss today on average volume while consolidating, stubbornly holding its ground near all-time highs. Support to watch is at prior high closes in the $76-77 area.
>>> The latest Featured Stock Update with an annotated graph appeared on 1/13/2010. click here.
|
|
C
A
S
I |
News |
Chart |
SEC
View all notes Alert
me of new notes
Company
Profile
|
HEAT
-
|
$14.25
|
-1.94
|
1,936,249
159% DAV
1,214,900
|
1/6/2010
(Date
Featured) |
$17.19
(Price
Featured) |
PP = $17.27 |
G |
| MB = $18.13 |
Most Recent Note - 1/21/2010 5:17:21 PM
G - Considerable loss today, violating its 50 DMA line and triggering a technical sell signal while closing at its lowest level since 12/04/09. Finished near prior chart lows in the $14 area that define important support.
>>> The latest Featured Stock Update with an annotated graph appeared on 1/19/2010. click here.
|
|
C
A
S
I |
News |
Chart |
SEC
View all notes Alert
me of new notes
Company
Profile
|
LFT
-
|
$36.89
|
-1.47
|
700,896
162% DAV
432,700
|
11/17/2009
(Date
Featured) |
$31.77
(Price
Featured) |
PP = $33.04 |
G |
| MB = $34.69 |
Most Recent Note - 1/21/2010 5:21:36 PM
G - Another loss today with above average volume indicated more worrisome distributional pressure, and it traded under its 50 DMA line before recovering to close near the middle of its intra-day range. Widespread weakness in China-based issues has clearly been a factor in recent days.
>>> The latest Featured Stock Update with an annotated graph appeared on 1/5/2010. click here.
|
|
C
A
S
I |
News |
Chart |
SEC
View all notes Alert
me of new notes
Company
Profile
|
PEGA
- NASDAQ
Pegasystems Inc
COMPUTER SOFTWARE & SERVICES - Business Software & Services
|
$34.13
|
-0.56
|
122,255
71% DAV
171,200
|
1/4/2010
(Date
Featured) |
$34.00
(Price
Featured) |
PP = $36.19 |
Y |
| MB = $38.00 |
Most Recent Note - 1/21/2010 5:25:26 PM
Y - Small loss today with lighter volume leaves it perched -5.4% below all-time highs with very little resistance remaining due to overhead supply. Featured in the January 2010 issue of CANSLIM.net News (read here).
>>> The latest Featured Stock Update with an annotated graph appeared on 1/3/2010. click here.
|
|
C
A
S
I |
News |
Chart |
SEC
View all notes Alert
me of new notes
Company
Profile
|
VIT
-
|
$20.21
|
+0.09
|
573,433
105% DAV
547,500
|
12/24/2009
(Date
Featured) |
$20.07
(Price
Featured) |
PP = $21.17 |
Y |
| MB = $22.23 |
Most Recent Note - 1/21/2010 5:26:47 PM
Y - Small gain today on average volume. Distributional pressure in the past week raised concerns as it abruptly reversed under its pivot point following its big 1/06/10 gain on heavy volume and 1/11/10 gain on +36% above average volume.
>>> The latest Featured Stock Update with an annotated graph appeared on 1/11/2010. click here.
|
|
C
A
S
I |
News |
Chart |
SEC
View all notes Alert
me of new notes
Company
Profile
|
|
|
|
THESE ARE NOT BUY RECOMMENDATIONS!
Comments contained in the body of this report are technical
opinions only. The material herein has been obtained
from sources believed to be reliable and accurate, however,
its accuracy and completeness cannot be guaranteed.
This site is not an investment advisor, hence it does
not endorse or recommend any securities or other investments.
Any recommendation contained in this report may not
be suitable for all investors and it is not to be deemed
an offer or solicitation on our part with respect to
the purchase or sale of any securities. All trademarks,
service marks and trade names appearing in this report
are the property of their respective owners, and are
likewise used for identification purposes only.
This report is a service available
only to active Paid Premium Members.
You may opt-out of receiving report notifications
at any time. Questions or comments may be submitted
by writing to Premium Membership Services 665 S.E. 10 Street, Suite 201 Deerfield Beach, FL 33441-5634 or by calling 1-800-965-8307
or 954-785-1121.
|
|
|


