You are not logged in.
This means you
CAN ONLY VIEW reports that were published prior to Monday, April 14, 2025.
You
MUST UPGRADE YOUR MEMBERSHIP if you want to see any current reports.
AFTER MARKET UPDATE - WEDNESDAY, JANUARY 20TH, 2010
Previous After Market Report Next After Market Report >>>
|
|
|
|
DOW |
-122.28 |
10,603.15 |
-1.14% |
|
Volume |
1,054,552,000 |
+2% |
|
Volume |
2,403,591,470 |
+14% |
|
NASDAQ |
-29.15 |
2,291.25 |
-1.26% |
|
Advancers |
786 |
25% |
|
Advancers |
754 |
27% |
|
S&P 500 |
-12.19 |
1,138.04 |
-1.06% |
|
Decliners |
2,251 |
72% |
|
Decliners |
1,975 |
70% |
|
Russell 2000 |
-9.54 |
639.61 |
-1.47% |
|
52 Wk Highs |
156 |
|
|
52 Wk Highs |
76 |
|
|
S&P 600 |
-5.01 |
338.98 |
-1.46% |
|
52 Wk Lows |
2 |
|
|
52 Wk Lows |
8 |
|
|
 |
Breadth Negative As Distributional Pressure Hits Major Averages
Adam Sarhan, Contributing Writer,
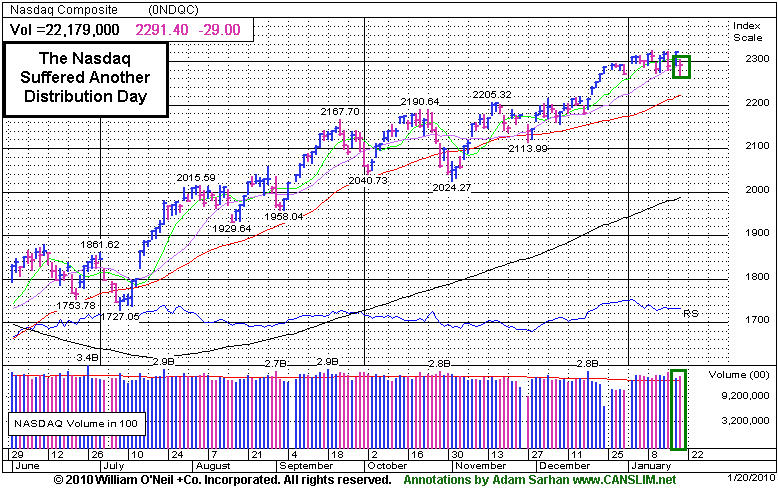
The major averages got smacked on Wednesday as investors digested the latest round of tepid earnings and economic data. Volume was reported higher on the Nasdaq and on the NYSE. The higher volume declines marked a distribution day and suggested that large institutions were more aggressively selling stocks. Decliners trumped advancers by nearly a 3-to-1 ratio on the NYSE and on the Nasdaq exchange. There were 15 high-ranked companies from the CANSLIM.net Leaders List that made a new 52-week high and appeared on the CANSLIM.net BreakOuts Page, lower than the total of 26 issues that appeared on the prior session. New 52-week highs still solidly outnumbered new 52-week lows on the NYSE and on the Nasdaq exchange.
Several high profile companies released lackluster Q4 results on Wednesday: IBM (-2.90%), Bank of America (BAC +1.04%), Morgan Stanley (MS -1.70%), and Coach Inc. (COH -5.61%) were among some of the well-known companies who disappointed the Street. IBM gapped down to its 50 DMA line after reporting a decrease in fourth-quarter business-consulting revenue, earnings rose +10% from the same period in 2008 while sales rose only +1%. Morgan Stanley opened lower after earnings missed analysts’ expectations and the company said trading revenue fell. Coach Inc. gapped down below its 50 DMA line after the company said North American sales trailed analysts’estimates. Meanwhile, Bank of America spent most of the session in the black as investors were optimistic about the company's future.
On the economic front, China said that it will restrict overall credit growth to 7.5 trillion yuan ($1.1 trillion) in 2010. China's banking regulator, Liu Mingkang, said some lenders were asked to curb their lending practices because they failed to meet regulatory requirements. Mingkang was interviewed at the Asian Financial Forum in Hong Kong and said that new loans in the first 10 days of this year were “relatively high.” The sharp anti-lending rhetoric was designed to slow China's red-hot economy. Investors overseas were concerned that if China's economy slows that the overall global economy will be adversely affected.
Domestically, a slew of economic data was released: a weaker than expected Producer Price Index (PPI), a mixed reading from the ailing housing market and weakness in retail sales. Producer prices slowed sharply in December which helped relieve inflation woes and ease pressure on the Fed to begin raising rates in the near future. Housing starts fell but building permits rose which helped offset the negative reading. Meanwhile, the Redbook, which measures sales at chain stores, discounters, and department stores, fell last week which suggests that retailers are having a tough start to the new year.
For the most part, the major averages and leading stocks are acting well as investors continue to digest the slew of economic and earnings data being released each day. Until a clear picture can be formed as to how companies fared last quarter, one could easily expect to see more of this sideways action to continue. The market just began its 46th week since the March lows and the rally remains intact as long as the major averages continue trading above their respective 50-day moving average (DMA) lines.
PICTURED: The Nasdaq Composite Index suffered a distribution day.
|
|
|
 |
Defensive Groups Among Largest Losers
Kenneth J. Gruneisen - Passed the CAN SLIM® Master's Exam
The Bank Index ($BKX +1.40%) was a standout gainer on Wednesday while most groups including the Broker/Dealer Index ($XBD -0.82%) suffered losses. Defensive groups were among those falling the hardest as the Gold & Silver Index ($XAU -3.80%), Healthcare Index ($HMO -2.08%), Oil Services Index ($OSX -2.08%), and Integrated Oil Index ($XOI -1.71%) unanimously lost ground. The Retail Index ($RLX -1.35%) and most tech indexes also ended the widely negative session in the red as there were modest losses for the Internet Index ($IIX -1.58%) and Networking Index ($NWX -1.28%), and the Biotechnology Index ($BTK -0.48%) and Semiconductor Index ($SOX -0.30%) edged lower.
Charts courtesy www.stockcharts.com
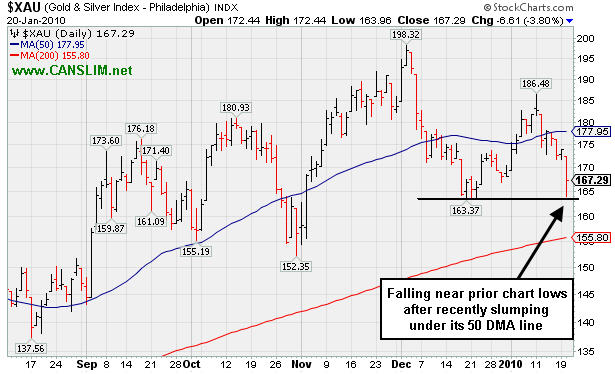
PICTURED: The Gold & Silver Index ($XAU -3.80%) is in the red for 2010. It fell near recent lows today after recently slumping under its 50-day moving average (DMA) line.
| Oil Services |
$OSX |
209.08 |
-4.44 |
-2.08% |
+7.26% |
| Healthcare |
$HMO |
1,560.79 |
-33.11 |
-2.08% |
+5.96% |
| Integrated Oil |
$XOI |
1,085.42 |
-18.85 |
-1.71% |
+1.61% |
| Semiconductor |
$SOX |
349.80 |
-1.04 |
-0.30% |
-2.81% |
| Networking |
$NWX |
238.67 |
-3.09 |
-1.28% |
+3.29% |
| Internet |
$IIX |
231.93 |
-3.73 |
-1.58% |
-0.83% |
| Broker/Dealer |
$XBD |
117.87 |
-0.98 |
-0.82% |
+2.45% |
| Retail |
$RLX |
406.24 |
-5.58 |
-1.35% |
-1.19% |
| Gold & Silver |
$XAU |
167.29 |
-6.61 |
-3.80% |
-0.57% |
| Bank |
$BKX |
47.82 |
+0.66 |
+1.40% |
+11.96% |
| Biotech |
$BTK |
991.95 |
-4.74 |
-0.48% |
+5.29% |
|
|
|
 |
Testing Prior Lows While Consolidating Under 50-Day Average
Kenneth J. Gruneisen - Passed the CAN SLIM® Master's Exam
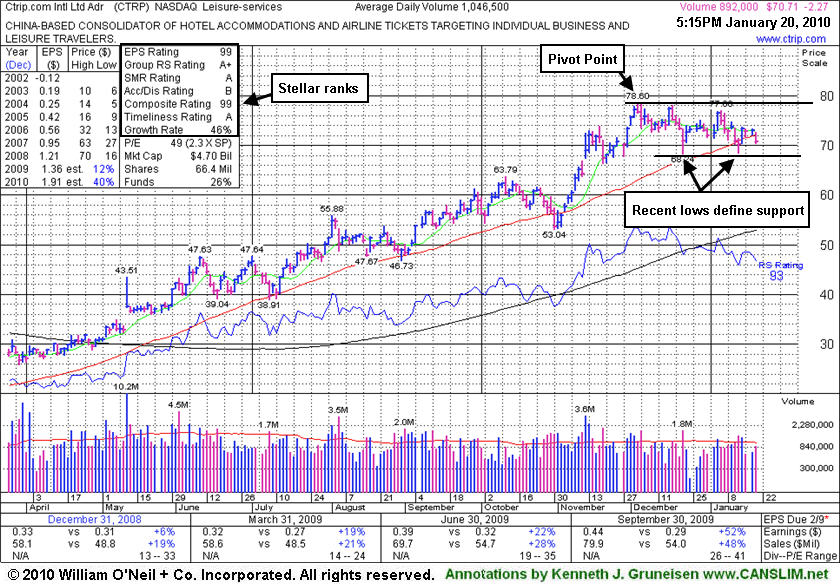
Ctrip.com International (CTRP -$2.27 or -3.11% to $70.71) slumped today and its loss on lighter than average volume led to another close under its 50-day moving average (DMA) line. Its color code was changed to yellow based on recent resilience near that important short-term average, however deterioration under its recent chart lows in the $68 area would raise more serious concerns and trigger technical sell signals. It encountered distributional pressure after it was featured n 12/01/09 in yellow in the mid-day report (read here), yet it admirably held its ground near its 50 DMA line . Fundamentally, its sales revenues and earnings increases have shown acceleration in the 3 most recent quarterly comparisons and rose solidly above the +25% guideline in the latest period ended September 30, 2009.
A follow-up study on 12/29/08 included an annotated graph under the headline "Disciplined Investors Avoided This Trip To The House Of Pain." That was well after if was dropped from the Featured Stocks list on 6/10/09 based on weak technical action when it closed at $49.84. Technically, it has rebounded very impressively from subsequent lows in the $16 area. It has maintained a strong and steady annual; earnings (A criteria) history. Fundamentals have shown greater sales revenues and earnings increases in the most current quarterly comparisons (C criteria), which is a very encouraging sign. The number of top-rated funds owning its shares increased from 52 in Mar '09 to 119 in Dec '09, which helps satisfy the I criteria.
|
|
|
Color Codes Explained :
Y - Better candidates highlighted by our
staff of experts.
G - Previously featured
in past reports as yellow but may no longer be buyable under the
guidelines.
***Last / Change / Volume quote data in this table corresponds with the timestamp on the note***
Symbol/Exchange
Company Name
Industry Group |
Last |
Chg. |
Vol
% DAV |
Date Featured |
Price Featured |
Latest Pivot Point
Featured |
Status |
| Latest Max Buy Price |
ARST
-
|
$26.60
|
-0.65
|
269,042
52% DAV
522,200
|
12/22/2009
(Date
Featured) |
$25.94
(Price
Featured) |
PP = $27.20 |
G |
| MB = $28.56 |
Most Recent Note - 1/20/2010 4:41:21 PM
G - Gapped down today for a loss on light volume, falling back toward its 50 DMA line again. Distributional pressure last week negated its latest breakout. ARST was first featured in yellow at $19.91 in the 9/01/09 mid-day report with an annotated daily graph (read here).
>>> The latest Featured Stock Update with an annotated graph appeared on 1/4/2010. click here.
|
|
C
A
S
I |
News |
Chart |
SEC
View all notes Alert
me of new notes
Company
Profile
|
ASIA
-
|
$26.84
|
-1.72
|
2,302,602
185% DAV
1,242,000
|
12/24/2009
(Date
Featured) |
$31.05
(Price
Featured) |
PP = $32.40 |
G |
| MB = $34.02 |
Most Recent Note - 1/20/2010 4:42:25 PM
G - Considerable loss today with heavy volume, violating its 50-day moving average (DMA) line and breaching recent chart lows, raising concerns and triggering technical sell signals. Traded up as much as +68.13% since first featured in the August 2009 CANSLIM.net News (read here).
>>> The latest Featured Stock Update with an annotated graph appeared on 1/12/2010. click here.
|
|
C
A
S
I |
News |
Chart |
SEC
View all notes Alert
me of new notes
Company
Profile
|
BIDU
- NASDAQ
Baidu Inc Ads
INTERNET - Internet Information Providers
|
$439.67
|
-1.17
|
1,840,614
99% DAV
1,863,600
|
1/13/2010
(Date
Featured) |
$431.25
(Price
Featured) |
PP = $426.75 |
Y |
| MB = $448.09 |
Most Recent Note - 1/20/2010 4:45:24 PM
Y - Held its ground with volume near average today after a 1/19/10 gap down for a considerable loss on above average volume pressured it under its November '08 high closes. Prior chart highs and its 50 DMA line define an important technical support level to watch.
>>> The latest Featured Stock Update with an annotated graph appeared on 1/14/2010. click here.
|
|
C
A
S
I |
News |
Chart |
SEC
View all notes Alert
me of new notes
Company
Profile
|
CAAS
- NASDAQ
China Automotive Systems
AUTOMOTIVE - Auto Parts
|
$19.84
|
-1.48
|
1,202,942
107% DAV
1,127,000
|
11/30/2009
(Date
Featured) |
$18.84
(Price
Featured) |
PP = $17.62 |
G |
| MB = $18.50 |
Most Recent Note - 1/20/2010 4:48:05 PM
G - Gapped down today, raising concerns while sinking under its December high closes again and falling near its 50 DMA line - the next important support level to watch. Recently encountering heavy distributional pressure. CAAS was actually rather late-stage at $18.84 when first featured in the 11/30/09 mid-day report (read here).
>>> The latest Featured Stock Update with an annotated graph appeared on 1/15/2010. click here.
|
|
C
A
S
I |
News |
Chart |
SEC
View all notes Alert
me of new notes
Company
Profile
|
CACC
- NASDAQ
Credit Acceptance Corp
FINANCIAL SERVICES - Credit Services
|
$49.00
|
+0.51
|
34,709
76% DAV
45,700
|
9/29/2009
(Date
Featured) |
$33.48
(Price
Featured) |
PP = $37.10 |
G |
| MB = $38.96 |
Most Recent Note - 1/20/2010 4:50:41 PM
G - Closed at the session high today with a gain on light volume. Stubbornly holding its ground near all-time highs, extended from any sound base. Its 50 DMA line is an important support level to watch now.
>>> The latest Featured Stock Update with an annotated graph appeared on 1/8/2010. click here.
|
|
C
A
S
I |
News |
Chart |
SEC
View all notes Alert
me of new notes
Company
Profile
|
CRM
- NYSE
Salesforce.com Inc
INTERNET - Internet Software & Services
|
$68.55
|
-0.95
|
1,814,841
96% DAV
1,894,000
|
12/18/2009
(Date
Featured) |
$67.32
(Price
Featured) |
PP = $67.82 |
G |
| MB = $71.21 |
Most Recent Note - 1/20/2010 4:57:13 PM
G - Gapped down today for a small loss on average volume, falling near important chart support in the $67 area previously noted at prior chart highs and its 50 DMA line. A damaging technical gap down on 1/12/10 was indicative of institutional (I criteria) distribution.
>>> The latest Featured Stock Update with an annotated graph appeared on 1/6/2010. click here.
|
|
C
A
S
I |
News |
Chart |
SEC
View all notes Alert
me of new notes
Company
Profile
|
CTRP
- NASDAQ
Ctrip.com Intl Ltd Adr
LEISURE - Resorts & Casinos
|
$70.71
|
-2.27
|
892,874
85% DAV
1,046,500
|
1/14/2010
(Date
Featured) |
$73.34
(Price
Featured) |
PP = $78.70 |
Y |
| MB = $82.64 |
Most Recent Note - 1/20/2010 5:05:27 PM
Y - Loss today on lighter than average volume led to a close under its 50 DMA line. Color code was changed to yellow based on recent resilience near that important short-term average, however deterioration under its recent chart lows in the $68 area would raise more serious concerns and trigger technical sell signals.
>>> The latest Featured Stock Update with an annotated graph appeared on 1/20/2010. click here.
|
|
C
A
S
I |
News |
Chart |
SEC
View all notes Alert
me of new notes
Company
Profile
|
GMCR
- NASDAQ
Green Mtn Coffee Roastrs
FOOD & BEVERAGE - Processed & Packaged Goods
|
$80.67
|
-2.23
|
1,038,584
64% DAV
1,632,700
|
12/28/2009
(Date
Featured) |
$77.49
(Price
Featured) |
PP = $76.50 |
G |
| MB = $80.33 |
Most Recent Note - 1/20/2010 5:07:24 PM
G - Loss today on light volume while consolidating well above support at prior high closes in the $76-77 area.
>>> The latest Featured Stock Update with an annotated graph appeared on 1/13/2010. click here.
|
|
C
A
S
I |
News |
Chart |
SEC
View all notes Alert
me of new notes
Company
Profile
|
HEAT
-
|
$16.19
|
-0.95
|
793,827
66% DAV
1,202,700
|
1/6/2010
(Date
Featured) |
$17.19
(Price
Featured) |
PP = $17.27 |
G |
| MB = $18.13 |
Most Recent Note - 1/20/2010 5:08:46 PM
G - Gapped down today for a loss on light volume while many China-based issues also faced pressure. Its latest breakout promptly failed, yet it is still holding its ground well above its 50 DMA line and recent chart lows near $14 that define the next very important support level.
>>> The latest Featured Stock Update with an annotated graph appeared on 1/19/2010. click here.
|
|
C
A
S
I |
News |
Chart |
SEC
View all notes Alert
me of new notes
Company
Profile
|
LFT
-
|
$38.36
|
-0.18
|
454,000
106% DAV
428,200
|
11/17/2009
(Date
Featured) |
$31.77
(Price
Featured) |
PP = $33.04 |
G |
| MB = $34.69 |
Most Recent Note - 1/20/2010 5:10:26 PM
G - Holding its ground this week after losses last week with above average volume indicated worrisome distributional pressure. Its 50 DMA line near $35 has been previously noted as an initial support level to watch on pullbacks. Its fundamentals remain strong.
>>> The latest Featured Stock Update with an annotated graph appeared on 1/5/2010. click here.
|
|
C
A
S
I |
News |
Chart |
SEC
View all notes Alert
me of new notes
Company
Profile
|
PEGA
- NASDAQ
Pegasystems Inc
COMPUTER SOFTWARE & SERVICES - Business Software & Services
|
$34.69
|
-0.32
|
147,127
83% DAV
177,600
|
1/4/2010
(Date
Featured) |
$34.00
(Price
Featured) |
PP = $36.19 |
Y |
| MB = $38.00 |
Most Recent Note - 1/20/2010 5:11:44 PM
Y - Small loss today with below average volume leaves it perched near all-time highs with no resistance remaining due to overhead supply. Featured in the January 2010 issue of CANSLIM.net News (read here).
>>> The latest Featured Stock Update with an annotated graph appeared on 1/3/2010. click here.
|
|
C
A
S
I |
News |
Chart |
SEC
View all notes Alert
me of new notes
Company
Profile
|
VIT
-
|
$20.12
|
-0.27
|
279,408
50% DAV
556,400
|
12/24/2009
(Date
Featured) |
$20.07
(Price
Featured) |
PP = $21.17 |
Y |
| MB = $22.23 |
Most Recent Note - 1/20/2010 5:12:55 PM
Y - Small loss today on light volume. Distributional pressure in the past week raised concerns as it abruptly reversed under its pivot point following its big 1/06/10 gain on heavy volume and 1/11/10 gain on +36% above average volume.
>>> The latest Featured Stock Update with an annotated graph appeared on 1/11/2010. click here.
|
|
C
A
S
I |
News |
Chart |
SEC
View all notes Alert
me of new notes
Company
Profile
|
|
|
|
THESE ARE NOT BUY RECOMMENDATIONS!
Comments contained in the body of this report are technical
opinions only. The material herein has been obtained
from sources believed to be reliable and accurate, however,
its accuracy and completeness cannot be guaranteed.
This site is not an investment advisor, hence it does
not endorse or recommend any securities or other investments.
Any recommendation contained in this report may not
be suitable for all investors and it is not to be deemed
an offer or solicitation on our part with respect to
the purchase or sale of any securities. All trademarks,
service marks and trade names appearing in this report
are the property of their respective owners, and are
likewise used for identification purposes only.
This report is a service available
only to active Paid Premium Members.
You may opt-out of receiving report notifications
at any time. Questions or comments may be submitted
by writing to Premium Membership Services 665 S.E. 10 Street, Suite 201 Deerfield Beach, FL 33441-5634 or by calling 1-800-965-8307
or 954-785-1121.
|
|
|


