You are not logged in.
This means you
CAN ONLY VIEW reports that were published prior to Monday, April 14, 2025.
You
MUST UPGRADE YOUR MEMBERSHIP if you want to see any current reports.
AFTER MARKET UPDATE - TUESDAY, JANUARY 17TH, 2012
Previous After Market Report Next After Market Report >>>
|
|
|
|
DOW |
+60.01 |
12,482.07 |
+0.48% |
|
Volume |
810,575,490 |
-2% |
|
Volume |
1,751,178,270 |
+8% |
|
NASDAQ |
+17.41 |
2,728.08 |
+0.64% |
|
Advancers |
1,827 |
59% |
|
Advancers |
1,366 |
52% |
|
S&P 500 |
+4.58 |
1,293.67 |
+0.36% |
|
Decliners |
1,165 |
37% |
|
Decliners |
1,169 |
44% |
|
Russell 2000 |
+1.33 |
765.53 |
+0.17% |
|
52 Wk Highs |
139 |
|
|
52 Wk Highs |
78 |
|
|
S&P 600 |
+1.24 |
428.46 |
+0.29% |
|
52 Wk Lows |
23 |
|
|
52 Wk Lows |
23 |
|
|
 |
Major Averages Rise With Expansion in Leadership
Kenneth J. Gruneisen - Passed the CAN SLIM® Master's Exam
Wall Street kicked off the shortened week in the green. Tuesday's volume totals were reported slightly lower than the prior session on the NYSE and slightly higher on the Nasdaq exchange. Breadth on the session was positive as advances led decliners by 3-2 on the NYSE but by a narrower 7-6 margin on the Nasdaq exchange. New 52-week highs again outnumbered new 52-week lows on the NYSE and on the Nasdaq exchange. There were 58 high-ranked companies from the CANSLIM.net Leaders List that made new 52-week highs and appeared on the CANSLIM.net BreakOuts Page, more than doubling the prior session total of 27 stocks. There were gains for 13 of the 19 high-ranked companies currently included on the Featured Stocks Page.

Equities gained ground as investors overlooked some negative earnings news and instead looked to a successful Spanish debt auction and encouraging economic news from the U.S. and China. Economic data helped set the tone as China reported GDP growth slowed from its previous quarters, still beating expectations, but growth at the slowest pace in 10 quarters increases pressure on Premier Wen Jiabao to ease monetary policy. In Europe, Spain experienced a successful auction of their short-term debt in which demand was strong and yields halved. This overshadowed news that the euro area's bailout fund lost its top credit rating yesterday at Standard & Poor's following downgrades of France and Austria. Despite the downgrade, European markets were higher.
In addition, a gauge of manufacturing in the New York region rose to its highest level since April 2011, expanding at the fastest pace in nine months, reflecting improving orders, sales and employment.
Losses in financials pared back earlier gains and, despite the rough to start to the earnings season for banks, most sectors traded into positive territory led by industrials and technology. The market was able to shrug off disappointing earnings result from Citigroup inc (C -8.21%) as its fourth-quarter profit dropped -11% while revenue from stock and bond trading declined. Carnival Corp (CCL -13.65%) shares sank as rescuers continued to search for survivors at the scene of the shipwrecked Costa Concordia off the coast of Italy. In other news, Sears Holdings Corp (SHLD +9.51%) surged, the most in the S&P 500, on speculation that the company may seek to go private. Conversely, R.R. Donnelley & Sons Co (RRD -15.82%) fell the most in the benchmark index, after the company said its 2011 return on sales will be lower than previously forecast.
The recent expansion in leadership (stocks making new 52-week highs) has been noted as a reassuring sign concerning the current confirmed market uptrend and the M criteria, as a healthy crop of strong leaders is necessary for any sustained market advance. Technical improvement from financial shares (noted in the "Industry Group Watch" section last Wednesday evening - read here) was another encouraging sign helping the market outlook.
The Q4 2011 CANSLIM.net Webcast is still available "ON DEMAND" to all upgraded members at no additional cost. Via the Premium Member Homepage links to all prior reports and webcasts are always available.
PICTURED: The benchmark S&P 500 Index has been rising above recent highs and finished -5.6% off its May 2, 2011 high.
|
 Kenneth J. Gruneisen started out as a licensed stockbroker in August 1987, a couple of months prior to the historic stock market crash that took the Dow Jones Industrial Average down -22.6% in a single day. He has published daily fact-based fundamental and technical analysis on high-ranked stocks online for two decades. Through FACTBASEDINVESTING.COM, Kenneth provides educational articles, news, market commentary, and other information regarding proven investment systems that work in good times and bad.
Comments contained in the body of this report are technical opinions only and are not necessarily those of Gruneisen Growth Corp. The material herein has been obtained from sources believed to be reliable and accurate, however, its accuracy and completeness cannot be guaranteed. Our firm, employees, and customers may effect transactions, including transactions contrary to any recommendation herein, or have positions in the securities mentioned herein or options with respect thereto. Any recommendation contained in this report may not be suitable for all investors and it is not to be deemed an offer or solicitation on our part with respect to the purchase or sale of any securities. |
|
 |
Healthcare Index Rallied to New 52-Week High
Kenneth J. Gruneisen - Passed the CAN SLIM® Master's Exam
Financial shares were laggards as the Broker/Dealer Index ($XBD -1.52%) and Bank Index ($BKX -1.40%) created a drag on the major averages on Tuesday. The Gold & Silver Index ($XAU -1.54%) also lost ground, however gains in other groups offset the weakness. Energy-related shares rose giving the Integrated Oil Index ($XOI +1.30%) and Oil Services Index ($OSX +0.69%) a boost. The Retail Index ($RLX +1.06%) and most tech groups were on the rise as the Semiconductor Index ($SOX +0.46%), Networking Index ($NWX +0.57%), and Internet Index ($IIX +0.95%) posted modest gains while the Biotechnology Index ($BTK -0.20%) lagged.
Charts courtesy www.stockcharts.com
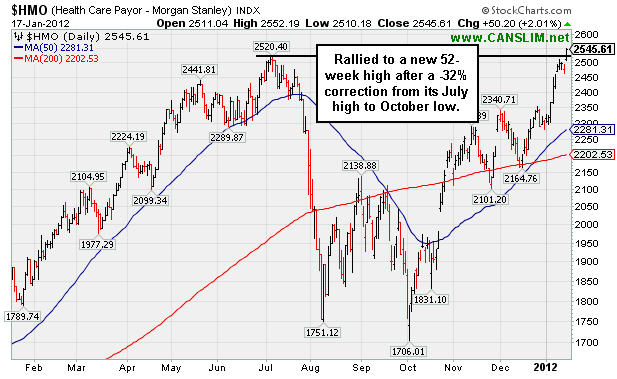
PICTURED: The Healthcare Index ($HMO +2.01%) posted a solid gain as it rallied to a new 52-week high after a -32% correction from its July high to October low.
| Oil Services |
$OSX |
224.73 |
+1.54 |
+0.69% |
+3.91% |
| Healthcare |
$HMO |
2,545.61 |
+50.20 |
+2.01% |
+11.57% |
| Integrated Oil |
$XOI |
1,251.76 |
+16.10 |
+1.30% |
+1.84% |
| Semiconductor |
$SOX |
385.22 |
+1.75 |
+0.46% |
+5.70% |
| Networking |
$NWX |
231.26 |
+1.31 |
+0.57% |
+7.48% |
| Internet |
$IIX |
291.67 |
+2.75 |
+0.95% |
+3.52% |
| Broker/Dealer |
$XBD |
87.99 |
-1.36 |
-1.52% |
+5.67% |
| Retail |
$RLX |
539.20 |
+5.64 |
+1.06% |
+3.06% |
| Gold & Silver |
$XAU |
189.94 |
-2.97 |
-1.54% |
+5.15% |
| Bank |
$BKX |
42.83 |
-0.61 |
-1.40% |
+8.76% |
| Biotech |
$BTK |
1,239.33 |
-2.45 |
-0.20% |
+13.55% |
|
|
|
 |
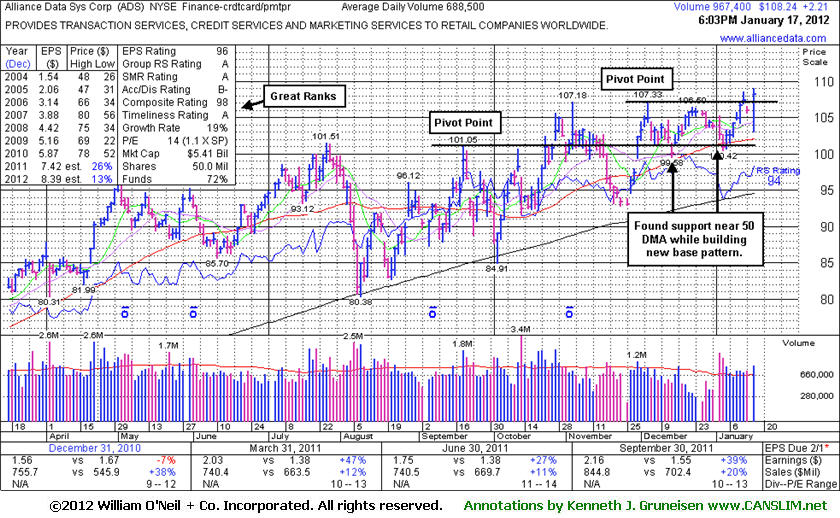
New Pivot Point Cited for Resilient Leader
Kenneth J. Gruneisen - Passed the CAN SLIM® Master's Exam
Alliance Data Systems Corporation (ADS +$2.21 or +2.08% to $108.24) hit a new all-time high today and rallied above the previously cited "max buy" level with a gain backed by +40% above average volume, near the bare minimum volume required to trigger a proper technical buy signal. Confirming gains backed by heavy volume would be a reassuring sign of serious institutional buying demand that could lead to a more meaningful advance. Its color code remains yellow and a new pivot point was cited based on its 12/05/11 high plus 10 cents after building an orderly new flat base. Its 50-day moving average (DMA) line and the 1/04/12 session low ($100.42) define near-term support where violations would raise greater concerns and trigger technical sell signals.
Its last appearance in this FSU section with an annotated graph was on 12/14/11 under the headline, "Recent Low and 200 DMA Line Define Support Below Short-Term Average." It found prompt support near its 50 DMA line even while enduring recent distributional pressure. After ADS was featured in yellow in the 10/21/11 mid-day report it initially powered to new high territory with volume-driven gains, but it stalled and then undercut its 50 DMA line after making limited progress. As always, protect your capital buy selling if any stock falls 7-8% your purchase price. If strength returns a stock can always be bought back, while holding losses beyond the guidelines leaves investors open to potentially greater financial damage from which it can be difficult to recover.
ADS has maintained a good annual earnings (A criteria) history, even through challenging economic times in recent years which created flaws in the A criteria for many growth stocks. Its past 3 quarterly comparisons (Mar, Jun, and Sep '11) showed earnings per share increases greater than the +25% minimum guideline (C criteria). Current leadership from other companies in the Finance - Credit Card/Payment Processing group (L criteria) is a favorable characteristic. Ownership by top-rated funds also rose from 616 in Dec '10 to 764 in Dec '11, a reassuring sign concerning the I criteria.
|
|
|
Color Codes Explained :
Y - Better candidates highlighted by our
staff of experts.
G - Previously featured
in past reports as yellow but may no longer be buyable under the
guidelines.
***Last / Change / Volume data in this table is the closing quote data***
Symbol/Exchange
Company Name
Industry Group |
PRICE |
CHANGE
(%Change) |
Day High |
Volume
(% DAV)
(% 50 day avg vol) |
52 Wk Hi
% From Hi |
Featured
Date |
Price
Featured |
Pivot Featured |
|
Max Buy |
ADS
-
NYSE
Alliance Data Sys Corp
COMPUTER SOFTWARE and SERVICES - Information and Delivery Service
|
$108.24
|
+2.21
2.08% |
$109.07
|
970,217
140.92% of 50 DAV
50 DAV is 688,500
|
$108.62
-0.35%
|
1/17/2012
|
$108.24
|
PP = $107.43
|
|
MB = $112.80
|
 Most Recent Note - 1/17/2012 6:30:20 PM
Y - Hit a new all-time high today and rallied above the previously cited "max buy" level with a gain backed by +40% above average volume, near the bare minimum volume required to trigger a proper technical buy signal. Color code remains yellow and a new pivot point was cited based on its 12/05/11 high plus 10 cents after building an orderly new flat base. Its 50 DMA line and the 1/04/12 session low ($100.42) define near-term support where violations would raise greater concerns and trigger technical sell signals. See the latest FSU analysis for more details and a new annotated graph.
>>> The latest Featured Stock Update with an annotated graph appeared on 1/17/2012. Click here.
View all notes |
Alert me of new notes |
CANSLIM.net Company Profile |
SEC |
Zacks Reports |
StockTalk |
News |
Chart |
Request a new note
C
A N
S L
I M


|
ALXN
-
NASDAQ
Alexion Pharmaceuticals
DRUGS - Drug Manufacturers - Other
|
$77.11
|
+2.49
3.34% |
$77.32
|
1,371,887
117.18% of 50 DAV
50 DAV is 1,170,800
|
$76.20
1.19%
|
11/30/2011
|
$68.66
|
PP = $70.52
|
|
MB = $74.05
|
Most Recent Note - 1/17/2012 4:14:50 PM
G - Hit another new all-time high with today's gain, getting more extended from its prior base. Prior resistance in the $70 area defines initial chart support above its 50 DMA line. See the latest FSU analysis for more details and a new annotated graph.
>>> The latest Featured Stock Update with an annotated graph appeared on 1/13/2012. Click here.
View all notes |
Alert me of new notes |
CANSLIM.net Company Profile |
SEC |
Zacks Reports |
StockTalk |
News |
Chart |
Request a new note
C
A N
S L
I M
|
CATM
-
NASDAQ
Cardtronics Inc
DIVERSIFIED SERVICES - Business/Management Services
|
$26.06
|
+0.35
1.36% |
$26.14
|
329,240
97.24% of 50 DAV
50 DAV is 338,600
|
$28.74
-9.32%
|
12/23/2011
|
$28.64
|
PP = $28.56
|
|
MB = $29.99
|
Most Recent Note - 1/17/2012 4:17:04 PM
G - Remains below its 50 DMA line after today's gain on near average volume. A rebound above that important short-term average would help its technical stance and help the outlook improve.
>>> The latest Featured Stock Update with an annotated graph appeared on 12/23/2011. Click here.
View all notes |
Alert me of new notes |
CANSLIM.net Company Profile |
SEC |
Zacks Reports |
StockTalk |
News |
Chart |
Request a new note
C
A N
S L
I M
|
CELG
-
NASDAQ
Celgene Corp
DRUGS - Drug Manufacturers - Major
|
$73.11
|
+0.48
0.66% |
$75.11
|
2,945,667
86.05% of 50 DAV
50 DAV is 3,423,300
|
$73.49
-0.52%
|
12/20/2011
|
$66.68
|
PP = $68.35
|
|
MB = $71.77
|
Most Recent Note - 1/17/2012 4:41:43 PM
G - Holding its ground after rallying beyond its "max buy" level with last week's streak of volume-driven gains. Prior highs in the $68 area define support to watch on pullbacks.
>>> The latest Featured Stock Update with an annotated graph appeared on 12/29/2011. Click here.
View all notes |
Alert me of new notes |
CANSLIM.net Company Profile |
SEC |
Zacks Reports |
StockTalk |
News |
Chart |
Request a new note
C
A N
S L
I M
|
FEIC
-
NASDAQ
F E I Co
ELECTRONICS - Diversified Electronics
|
$43.61
|
+0.22
0.51% |
$44.38
|
263,116
92.94% of 50 DAV
50 DAV is 283,100
|
$44.41
-1.80%
|
12/7/2011
|
$41.41
|
PP = $42.35
|
|
MB = $44.47
|
Most Recent Note - 1/17/2012 4:43:54 PM
Y - Consolidating between its pivot point and "max buy" level today. Hit new all-time highs last week and triggered a technical buy signal with +68% above average volume behind its gain on 1/11/12 while rising above its pivot point. No overhead supply remains to hinder its upward progress. The 50 DMA line defines chart support above prior lows.
>>> The latest Featured Stock Update with an annotated graph appeared on 12/21/2011. Click here.
View all notes |
Alert me of new notes |
CANSLIM.net Company Profile |
SEC |
Zacks Reports |
StockTalk |
News |
Chart |
Request a new note
C
A N
S L
I M
|
Symbol/Exchange
Company Name
Industry Group |
PRICE |
CHANGE
(%Change) |
Day High |
Volume
(% DAV)
(% 50 day avg vol) |
52 Wk Hi
% From Hi |
Featured
Date |
Price
Featured |
Pivot Featured |
|
Max Buy |
GNC
-
NYSE
G N C Holdings Inc
RETAIL - Drug Stores
|
$27.93
|
-0.22
-0.78% |
$28.52
|
567,353
51.40% of 50 DAV
50 DAV is 1,103,700
|
$29.50
-5.32%
|
10/26/2011
|
$24.60
|
PP = $24.80
|
|
MB = $26.04
|
Most Recent Note - 1/17/2012 4:45:02 PM
G - Volume totals have been cooling while holding its ground since finding prompt support near its 50 DMA line. Subsequent losses below its 50 DMA and recent chart low (1/09/12 low of $26.54) would raise more serious concerns and trigger more worrisome technical sell signals.
>>> The latest Featured Stock Update with an annotated graph appeared on 12/16/2011. Click here.
View all notes |
Alert me of new notes |
CANSLIM.net Company Profile |
SEC |
Zacks Reports |
StockTalk |
News |
Chart |
Request a new note
C
A N
S L
I M
|
HMSY
-
NASDAQ
H M S Holdings Corp
COMPUTER SOFTWARE and SERVICES - Healthcare Information Service
|
$33.37
|
+0.84
2.58% |
$33.48
|
694,424
71.55% of 50 DAV
50 DAV is 970,500
|
$32.83
1.64%
|
10/27/2011
|
$26.44
|
PP = $28.37
|
|
MB = $29.79
|
Most Recent Note - 1/17/2012 4:29:18 PM
G - Hit a new all-time high with today's gain backed by higher but still below average volume. No resistance remains to hinder its progress, but it is extended from its prior base.
>>> The latest Featured Stock Update with an annotated graph appeared on 12/28/2011. Click here.
View all notes |
Alert me of new notes |
CANSLIM.net Company Profile |
SEC |
Zacks Reports |
StockTalk |
News |
Chart |
Request a new note
C
A N
S L
I M
|
ISRG
-
NASDAQ
Intuitive Surgical Inc
HEALTH SERVICES - Medical Appliances and Equipment
|
$465.36
|
+5.92
1.29% |
$467.00
|
312,313
104.38% of 50 DAV
50 DAV is 299,200
|
$474.50
-1.93%
|
12/20/2011
|
$442.43
|
PP = $449.16
|
|
MB = $471.62
|
Most Recent Note - 1/17/2012 4:31:02 PM
Y - Posted a 4th consecutive small gain today on average volume. Previously noted, "Recent gains above its pivot point have lacked the volume needed to trigger a proper new (or add-on) technical buy signal. Important support is defined by its 50 DMA line."
>>> The latest Featured Stock Update with an annotated graph appeared on 12/13/2011. Click here.
View all notes |
Alert me of new notes |
CANSLIM.net Company Profile |
SEC |
Zacks Reports |
StockTalk |
News |
Chart |
Request a new note
C
A N
S L
I M
|
LULU
-
NASDAQ
Lululemon Athletica
MANUFACTURING - Textile Manufacturing
|
$60.68
|
-1.28
-2.07% |
$62.68
|
2,703,163
69.00% of 50 DAV
50 DAV is 3,917,400
|
$64.49
-5.91%
|
1/10/2012
|
$60.97
|
PP = $59.46
|
|
MB = $62.43
|
Most Recent Note - 1/17/2012 4:33:25 PM
Y - Pulled back today on below average volume. A considerable gap up gain on 1/10/12 helped it break out from a "double bottom" base. Prior chart highs in the low $60s have been acting as a recent resistance level.
>>> The latest Featured Stock Update with an annotated graph appeared on 1/10/2012. Click here.
View all notes |
Alert me of new notes |
CANSLIM.net Company Profile |
SEC |
Zacks Reports |
StockTalk |
News |
Chart |
Request a new note
C
A N
S L
I M
|
MA
-
NYSE
Mastercard Inc Cl A
DIVERSIFIED SERVICES - Business/Management Services
|
$345.97
|
+6.89
2.03% |
$347.00
|
1,111,743
105.76% of 50 DAV
50 DAV is 1,051,200
|
$384.99
-10.14%
|
1/3/2012
|
$367.87
|
PP = $385.09
|
|
MB = $404.34
|
Most Recent Note - 1/17/2012 4:36:57 PM
G - Posted a gain today on near average volume. It remains -10% off its 52-week high and below its 50 DMA line. It recently has sputtered near its late-November lows, leaving its 200 DMA line as the nearest support level to watch now.
>>> The latest Featured Stock Update with an annotated graph appeared on 1/3/2012. Click here.
View all notes |
Alert me of new notes |
CANSLIM.net Company Profile |
SEC |
Zacks Reports |
StockTalk |
News |
Chart |
Request a new note
C
A N
S L
I M
|
Symbol/Exchange
Company Name
Industry Group |
PRICE |
CHANGE
(%Change) |
Day High |
Volume
(% DAV)
(% 50 day avg vol) |
52 Wk Hi
% From Hi |
Featured
Date |
Price
Featured |
Pivot Featured |
|
Max Buy |
MKTX
-
NASDAQ
Marketaxess Holdings Inc
FINANCIAL SERVICES - Investment Brokerage - Nationa
|
$30.56
|
-0.08
-0.26% |
$31.27
|
136,067
69.10% of 50 DAV
50 DAV is 196,900
|
$32.23
-5.18%
|
10/28/2011
|
$29.79
|
PP = $31.05
|
|
MB = $32.60
|
Most Recent Note - 1/17/2012 4:38:32 PM
Y - Hovering near its all-time high hit last week without truly great volume conviction behind recent gains. The 50 DMA line defines initial chart support to watch.
>>> The latest Featured Stock Update with an annotated graph appeared on 12/20/2011. Click here.
View all notes |
Alert me of new notes |
CANSLIM.net Company Profile |
SEC |
Zacks Reports |
StockTalk |
News |
Chart |
Request a new note
C
A N
S L
I M
|
OSIS
-
NASDAQ
O S I Systems Inc
ELECTRONICS - Semiconductor Equipment and Mate
|
$50.50
|
+0.18
0.36% |
$50.95
|
134,258
137.98% of 50 DAV
50 DAV is 97,300
|
$51.06
-1.10%
|
11/1/2011
|
$42.07
|
PP = $45.57
|
|
MB = $47.85
|
Most Recent Note - 1/12/2012 3:45:33 PM
G - Pulling back today on light volume after a streak of 7 consecutive small gains, getting extended from its prior base. Its 50 DMA line defines important near-term support to watch.
>>> The latest Featured Stock Update with an annotated graph appeared on 12/27/2011. Click here.
View all notes |
Alert me of new notes |
CANSLIM.net Company Profile |
SEC |
Zacks Reports |
StockTalk |
News |
Chart |
Request a new note
C
A N
S L
I M
|
PRGO
-
NASDAQ
Perrigo Co
DRUGS - Drug Related Products
|
$97.89
|
+0.87
0.90% |
$98.75
|
463,690
35.80% of 50 DAV
50 DAV is 1,295,100
|
$104.70
-6.50%
|
12/9/2011
|
$99.54
|
PP = $101.56
|
|
MB = $106.64
|
Most Recent Note - 1/13/2012 4:50:18 PM
G - Quietly consolidating above support at its 50 DMA line, hovering near previously stubborn resistance in the low $100s.
>>> The latest Featured Stock Update with an annotated graph appeared on 1/9/2012. Click here.
View all notes |
Alert me of new notes |
CANSLIM.net Company Profile |
SEC |
Zacks Reports |
StockTalk |
News |
Chart |
Request a new note
C
A N
S L
I M
|
RAX
-
NYSE
Rackspace Hosting Inc
INTERNET - Internet Software and; Services
|
$42.99
|
-0.36
-0.83% |
$44.04
|
1,192,292
72.76% of 50 DAV
50 DAV is 1,638,600
|
$46.50
-7.54%
|
11/8/2011
|
$44.28
|
PP = $46.27
|
|
MB = $48.58
|
Most Recent Note - 1/13/2012 4:53:21 PM
Y - Gains without great volume conviction helped it rally back above its 50 DMA line this week. Color code is changed to yellow again as it is perched within striking distance of its pivot point. Its 200 DMA line defines the next near-term support level to watch.
>>> The latest Featured Stock Update with an annotated graph appeared on 1/5/2012. Click here.
View all notes |
Alert me of new notes |
CANSLIM.net Company Profile |
SEC |
Zacks Reports |
StockTalk |
News |
Chart |
Request a new note
C
A N
S L
I M
|
SXCI
-
NASDAQ
S X C Health Solutions
COMPUTER SOFTWARE and SERVICES - Healthcare Information Service
|
$61.26
|
-1.38
-2.20% |
$63.48
|
565,141
132.35% of 50 DAV
50 DAV is 427,000
|
$66.40
-7.74%
|
1/10/2012
|
$62.05
|
PP = $60.10
|
|
MB = $63.11
|
Most Recent Note - 1/13/2012 4:56:05 PM
Y - Color code is changed to yellow after pulling back below its "max buy" level. Its technical breakout was featured in yellow in the 1/10/12 mid-day report (read here) with pivot point cited based on its 12/02/11 high plus 10 cents. Ownership by top-rated funds has been increasing, rising from 453 in Jun '10 to 600 in Dec '11, a reassuring sign concerning the I criteria. Reported earnings +57% on +163% sales revenues for the quarter ended September 31, 2011 versus the year ago period. Strong prior quarters and good annual earnings history satisfy the C & A criteria.

There are no Featured Stock Updates™ available for this stock at this time. You may request one by clicking the Request a New Note link below
View all notes |
Alert me of new notes |
CANSLIM.net Company Profile |
SEC |
Zacks Reports |
StockTalk |
News |
Chart |
Request a new note
C
A N
S L
I M
|
Symbol/Exchange
Company Name
Industry Group |
PRICE |
CHANGE
(%Change) |
Day High |
Volume
(% DAV)
(% 50 day avg vol) |
52 Wk Hi
% From Hi |
Featured
Date |
Price
Featured |
Pivot Featured |
|
Max Buy |
TDG
-
NYSE
Transdigm Group Inc
AEROSPACE/DEFENSE - Aerospace/Defense Products and; Services
|
$97.97
|
+0.41
0.42% |
$98.94
|
176,960
52.29% of 50 DAV
50 DAV is 338,400
|
$102.73
-4.63%
|
1/10/2012
|
$98.83
|
PP = $102.83
|
|
MB = $107.97
|
Most Recent Note - 1/13/2012 4:57:58 PM
Y - No overhead supply remains to act as resistance and volume totals have been cooling while holding its ground. Volume driven gains for new highs may help it clear a base-on-base type pattern. Recent lows in the $90 area define the next nearby support level to watch above its 200 DMA line.
>>> The latest Featured Stock Update with an annotated graph appeared on 1/4/2012. Click here.
View all notes |
Alert me of new notes |
CANSLIM.net Company Profile |
SEC |
Zacks Reports |
StockTalk |
News |
Chart |
Request a new note
C
A N
S L
I M
|
TSCO
-
NASDAQ
Tractor Supply Co
SPECIALTY RETAIL - Specialty Retail, Other
|
$80.48
|
-0.08
-0.10% |
$80.56
|
905,705
132.82% of 50 DAV
50 DAV is 681,900
|
$81.13
-0.80%
|
1/12/2012
|
$79.12
|
PP = $75.58
|
|
MB = $79.36
|
Most Recent Note - 1/13/2012 12:33:56 PM
Y - At its all-time high today after a considerable "breakaway gap" on the prior session. Color code was changed to yellow with pivot point cited based on its 12/09/11 high plus 10 cents. See the latest FSU analysis for more details and a new annotated graph.
>>> The latest Featured Stock Update with an annotated graph appeared on 1/12/2012. Click here.
View all notes |
Alert me of new notes |
CANSLIM.net Company Profile |
SEC |
Zacks Reports |
StockTalk |
News |
Chart |
Request a new note
C
A N
S L
I M
|
ULTA
-
NASDAQ
Ulta Salon Cosm & Frag
SPECIALTY RETAIL - Specialty Retail, Other
|
$74.13
|
+1.00
1.37% |
$74.95
|
784,939
80.48% of 50 DAV
50 DAV is 975,300
|
$75.70
-2.07%
|
1/11/2012
|
$71.97
|
PP = $75.80
|
|
MB = $79.59
|
Most Recent Note - 1/17/2012 4:47:57 PM
Y - Posted a 6th consecutive gain on near or below average volume and finished today only $0.11 from its best ever close, still building on a riskier late-stage base. Prior lows near $64 define important chart support above its 200 DMA line.
>>> The latest Featured Stock Update with an annotated graph appeared on 1/11/2012. Click here.
View all notes |
Alert me of new notes |
CANSLIM.net Company Profile |
SEC |
Zacks Reports |
StockTalk |
News |
Chart |
Request a new note
C
A N
S L
I M
|
V
-
NYSE
Visa Inc Cl A
DIVERSIFIED SERVICES - Business/Management Services
|
$102.53
|
+1.79
1.78% |
$102.94
|
4,255,162
110.92% of 50 DAV
50 DAV is 3,836,300
|
$103.45
-0.89%
|
10/24/2011
|
$94.21
|
PP = $94.85
|
|
MB = $99.59
|
Most Recent Note - 1/17/2012 4:49:30 PM
G - Gain today has it perched near its all-time high and no overhead supply remains to act as resistance. Its 50 DMA line defines chart support to watch on pullbacks.
>>> The latest Featured Stock Update with an annotated graph appeared on 12/15/2011. Click here.
View all notes |
Alert me of new notes |
CANSLIM.net Company Profile |
SEC |
Zacks Reports |
StockTalk |
News |
Chart |
Request a new note
C
A N
S L
I M
|
|
|
|
THESE ARE NOT BUY RECOMMENDATIONS!
Comments contained in the body of this report are technical
opinions only. The material herein has been obtained
from sources believed to be reliable and accurate, however,
its accuracy and completeness cannot be guaranteed.
This site is not an investment advisor, hence it does
not endorse or recommend any securities or other investments.
Any recommendation contained in this report may not
be suitable for all investors and it is not to be deemed
an offer or solicitation on our part with respect to
the purchase or sale of any securities. All trademarks,
service marks and trade names appearing in this report
are the property of their respective owners, and are
likewise used for identification purposes only.
This report is a service available
only to active Paid Premium Members.
You may opt-out of receiving report notifications
at any time. Questions or comments may be submitted
by writing to Premium Membership Services 665 S.E. 10 Street, Suite 201 Deerfield Beach, FL 33441-5634 or by calling 1-800-965-8307
or 954-785-1121.
|
|
|

