You are not logged in.
This means you
CAN ONLY VIEW reports that were published prior to Tuesday, April 15, 2025.
You
MUST UPGRADE YOUR MEMBERSHIP if you want to see any current reports.
AFTER MARKET UPDATE - WEDNESDAY, JANUARY 18TH, 2012
Previous After Market Report Next After Market Report >>>
|
|
|
|
DOW |
+96.88 |
12,578.95 |
+0.78% |
|
Volume |
797,803,510 |
-2% |
|
Volume |
1,945,761,290 |
+11% |
|
NASDAQ |
+41.63 |
2,769.71 |
+1.53% |
|
Advancers |
2,386 |
76% |
|
Advancers |
1,946 |
74% |
|
S&P 500 |
+14.37 |
1,308.04 |
+1.11% |
|
Decliners |
654 |
21% |
|
Decliners |
605 |
23% |
|
Russell 2000 |
+13.73 |
779.26 |
+1.79% |
|
52 Wk Highs |
130 |
|
|
52 Wk Highs |
76 |
|
|
S&P 600 |
+7.03 |
435.50 |
+1.64% |
|
52 Wk Lows |
16 |
|
|
52 Wk Lows |
15 |
|
|
 |
Nasdaq Composite Index Rallied Above October High
Kenneth J. Gruneisen - Passed the CAN SLIM® Master's Exam
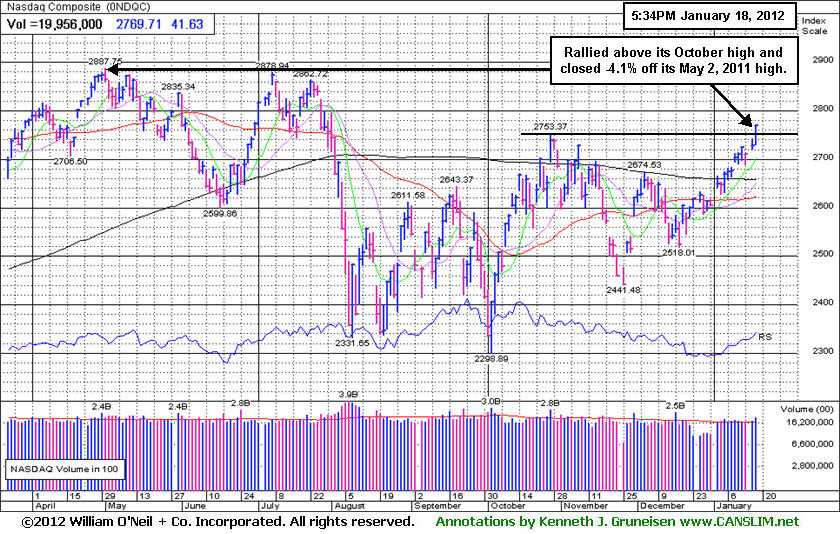
While the major averages rallied on Wednesday the volume totals were reported mixed, slightly lower than the prior session on the NYSE, yet higher on the Nasdaq exchange. Breadth on the session was solidly positive as advancers led decliners by nearly 4-1 on the NYSE and by more than 3-1 on the Nasdaq exchange. New 52-week highs totals actually contracted from the prior session totals on both exchanges, yet new highs still easily outnumbered new 52-week lows totals. There were 52 high-ranked companies from the CANSLIM.net Leaders List that made new 52-week highs and appeared on the CANSLIM.net BreakOuts Page, also down from the prior session total of 58 stocks. There were gains for 15 of the 19 high-ranked companies currently included on the Featured Stocks Page.
Stocks initially advanced off of news that the International Monetary Fund is proposing to raise its lending capacity by as much as $500 billion to help safeguard the global economy against any worsening of the euro area's debt crisis. Later in the session, a European official said that Greece's government could have an agreement on a debt swap by week's end, which gave an afternoon boost to equities.
Encouraging economic data added to the positive tone. A report showed factory production in the U.S. climbed by the most in a year, up +0.4% in December. In addition, confidence among homebuilders rose in January to the highest level in more than four years. Inflation data was also helpful as wholesale prices unexpectedly dropped in December for the second decrease in the past three months.
Financials were in the spotlight after a batch of mixed earnings results. The Goldman Sachs Group Inc (GS +6.79%) rallied as its earnings fell but they beat low estimates. Bank of New York Mellon Corp (BK -4.56%) fell after the bank's earnings dropped -26%. Meanwhile, US Bancorp (USB +1.08%) edged higher after the company said its net income jumped almost +40%.
The recent expansion in leadership (stocks making new 52-week highs) has been noted as a reassuring sign concerning the current confirmed market uptrend and the M criteria, as a healthy crop of strong leaders is necessary for any sustained market advance. Technical improvement from financial shares (noted in the "Industry Group Watch" section last Wednesday evening - read here) was another encouraging sign helping the market outlook.
The Q4 2011 CANSLIM.net Webcast is still available "ON DEMAND" to all upgraded members at no additional cost. Via the Premium Member Homepage links to all prior reports and webcasts are always available.
PICTURED: The Nasdaq Composite Index was helped by strong gains in the tech sector as it rallied above its October high and closed -4.1% off its May 2, 2011 high.
|
 Kenneth J. Gruneisen started out as a licensed stockbroker in August 1987, a couple of months prior to the historic stock market crash that took the Dow Jones Industrial Average down -22.6% in a single day. He has published daily fact-based fundamental and technical analysis on high-ranked stocks online for two decades. Through FACTBASEDINVESTING.COM, Kenneth provides educational articles, news, market commentary, and other information regarding proven investment systems that work in good times and bad.
Comments contained in the body of this report are technical opinions only and are not necessarily those of Gruneisen Growth Corp. The material herein has been obtained from sources believed to be reliable and accurate, however, its accuracy and completeness cannot be guaranteed. Our firm, employees, and customers may effect transactions, including transactions contrary to any recommendation herein, or have positions in the securities mentioned herein or options with respect thereto. Any recommendation contained in this report may not be suitable for all investors and it is not to be deemed an offer or solicitation on our part with respect to the purchase or sale of any securities. |
|
 |
Tech Sector Led Widespread Rally
Kenneth J. Gruneisen - Passed the CAN SLIM® Master's Exam
The Semiconductor Index ($SOX +5.03%) led the tech sector higher while the Networking Index ($NWX +3.50%) also posted a solid gain, followed by smaller gains from the Biotechnology Index ($BTK +1.71%) and the Internet Index ($IIX +1.65%). The Oil Services Index ($OSX +3.49%) tallied a big gain and the Integrated Oil Index ($XOI +1.67%) followed. The Retail Index ($RLX +2.36%) and financial shares also were a positive influence on the major averages as the Broker/Dealer Index ($XBD +2.52%) and Bank Index ($BKX +1.12%) traded up. The group action showed that the market has increased its appetite for risk, meanwhile defensive groups were laggards as the Healthcare Index ($HMO +0.02%) finished flat and the Gold & Silver Index ($XAU +0.66%) posted a small gain.
Charts courtesy www.stockcharts.com
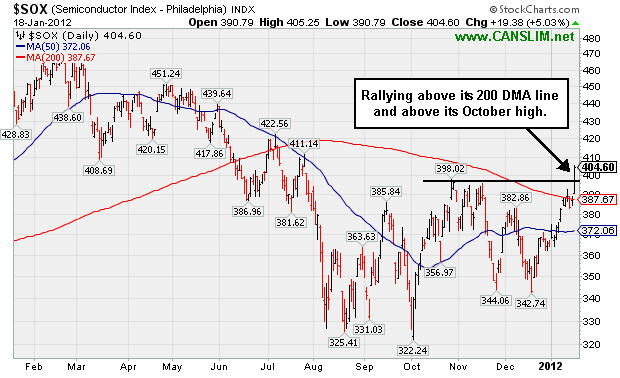
PICTURED: The Semiconductor Index ($SOX +5.03%) has seen its technical stance greatly improve since last shown in this section on January 9th approaching a downward trendline and still below its 200-day moving average (DMA) line (read here). It has rallied above the downward trendline and its 200 DMA line, and its big gain on Wednesday helped it rally above its October high. Better strength in the tech sector certainly bodes well for growth-oriented investors.
| Oil Services |
$OSX |
232.58 |
+7.85 |
+3.49% |
+7.54% |
| Healthcare |
$HMO |
2,546.05 |
+0.44 |
+0.02% |
+11.59% |
| Integrated Oil |
$XOI |
1,272.69 |
+20.93 |
+1.67% |
+3.55% |
| Semiconductor |
$SOX |
404.60 |
+19.38 |
+5.03% |
+11.02% |
| Networking |
$NWX |
239.37 |
+8.10 |
+3.50% |
+11.25% |
| Internet |
$IIX |
296.49 |
+4.82 |
+1.65% |
+5.23% |
| Broker/Dealer |
$XBD |
90.21 |
+2.22 |
+2.52% |
+8.33% |
| Retail |
$RLX |
551.91 |
+12.71 |
+2.36% |
+5.49% |
| Gold & Silver |
$XAU |
191.20 |
+1.26 |
+0.66% |
+5.85% |
| Bank |
$BKX |
43.31 |
+0.48 |
+1.12% |
+9.98% |
| Biotech |
$BTK |
1,260.53 |
+21.20 |
+1.71% |
+15.49% |
|
|
|
 |
Earnings News Often Leads to Greater Volume and Volatility
Kenneth J. Gruneisen - Passed the CAN SLIM® Master's Exam
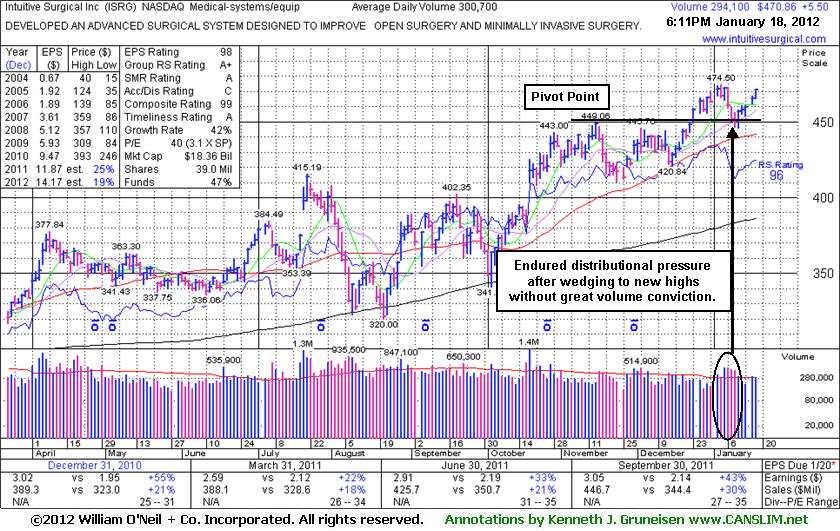
Intuitive Surgical Inc (ISRG +$5.50 or +1.18% to $470.86) posted a 5th consecutive small gain today on near average volume and finished only -$1.50 below its best-ever close. It has been repeatedly noted, "Recent gains above its pivot point have lacked the volume needed to trigger a proper new (or add-on) technical buy signal. Important support is defined by its 50 DMA line." Since its last appearance in this FSU section on 12/13/11 with an annotated graph included under the headline, "Possible Base-On Base Pattern Forming", a new pivot point was cited on 12/20.11 based on its 11/15/11 high plus 10 cents and it rose to new all-time highs, but none of its gains had sufficient volume to trigger a proper technical buy signal. It also endured some distributional pressure, yet found support above prior chart highs and stayed well above its 50-day moving average (DMA) line. Those levels define important near-term chart support to watch where subsequent violations would raise concerns and trigger technical sell signals.
The high-ranked Medical - Systems/Equipment firm is due to report earnings after Thursday's close. Wall Street expects slower growth for Q4, a +10% EPS gain to $3.32 as revenue rises +24% to $483.7 million. However, the company has beaten views for 10 straight quarters by anywhere from 2% to 34%. Its shares often are volatile after earnings reports. Additionally, the fact-based system calls for buy candidates to show increases above the +25% guideline in the 3 or 4 most current quarterly (C criteria) comparisons versus the year-ago period.
The quarter ended September 30, 2011 was noted as a comparisons showing an acceleration in sales revenues and earnings increases, sequentially, a reassuring sign. It has a great annual earnings (A criteria) history. This company's small supply (S criteria) of only 39 million shares outstanding can lead to greater volatility in the event of any abrupt institutional buying or selling. The number of top-rated funds owning its shares increased from 918 in Dec '10 to 1,077 in Dec '11.
|
|
|
Color Codes Explained :
Y - Better candidates highlighted by our
staff of experts.
G - Previously featured
in past reports as yellow but may no longer be buyable under the
guidelines.
***Last / Change / Volume data in this table is the closing quote data***
Symbol/Exchange
Company Name
Industry Group |
PRICE |
CHANGE
(%Change) |
Day High |
Volume
(% DAV)
(% 50 day avg vol) |
52 Wk Hi
% From Hi |
Featured
Date |
Price
Featured |
Pivot Featured |
|
Max Buy |
ADS
-
NYSE
Alliance Data Sys Corp
COMPUTER SOFTWARE and SERVICES - Information and Delivery Service
|
$109.47
|
+1.23
1.14% |
$109.87
|
579,155
83.56% of 50 DAV
50 DAV is 693,100
|
$109.07
0.37%
|
1/17/2012
|
$108.24
|
PP = $107.43
|
|
MB = $112.80
|
Most Recent Note - 1/17/2012 6:30:20 PM
Y - Hit a new all-time high today and rallied above the previously cited "max buy" level with a gain backed by +40% above average volume, near the bare minimum volume required to trigger a proper technical buy signal. Color code remains yellow and a new pivot point was cited based on its 12/05/11 high plus 10 cents after building an orderly new flat base. Its 50 DMA line and the 1/04/12 session low ($100.42) define near-term support where violations would raise greater concerns and trigger technical sell signals. See the latest FSU analysis for more details and a new annotated graph.
>>> The latest Featured Stock Update with an annotated graph appeared on 1/17/2012. Click here.
View all notes |
Alert me of new notes |
CANSLIM.net Company Profile |
SEC |
Zacks Reports |
StockTalk |
News |
Chart |
Request a new note
C
A N
S L
I M


|
ALXN
-
NASDAQ
Alexion Pharmaceuticals
DRUGS - Drug Manufacturers - Other
|
$76.99
|
-0.12
-0.16% |
$77.58
|
1,110,720
94.28% of 50 DAV
50 DAV is 1,178,100
|
$77.32
-0.43%
|
11/30/2011
|
$68.66
|
PP = $70.52
|
|
MB = $74.05
|
Most Recent Note - 1/17/2012 4:14:50 PM
G - Hit another new all-time high with today's gain, getting more extended from its prior base. Prior resistance in the $70 area defines initial chart support above its 50 DMA line. See the latest FSU analysis for more details and a new annotated graph.
>>> The latest Featured Stock Update with an annotated graph appeared on 1/13/2012. Click here.
View all notes |
Alert me of new notes |
CANSLIM.net Company Profile |
SEC |
Zacks Reports |
StockTalk |
News |
Chart |
Request a new note
C
A N
S L
I M
|
CATM
-
NASDAQ
Cardtronics Inc
DIVERSIFIED SERVICES - Business/Management Services
|
$26.59
|
+0.53
2.03% |
$26.69
|
245,512
72.10% of 50 DAV
50 DAV is 340,500
|
$28.74
-7.48%
|
12/23/2011
|
$28.64
|
PP = $28.56
|
|
MB = $29.99
|
Most Recent Note - 1/17/2012 4:17:04 PM
G - Remains below its 50 DMA line after today's gain on near average volume. A rebound above that important short-term average would help its technical stance and help the outlook improve.
>>> The latest Featured Stock Update with an annotated graph appeared on 12/23/2011. Click here.
View all notes |
Alert me of new notes |
CANSLIM.net Company Profile |
SEC |
Zacks Reports |
StockTalk |
News |
Chart |
Request a new note
C
A N
S L
I M
|
CELG
-
NASDAQ
Celgene Corp
DRUGS - Drug Manufacturers - Major
|
$72.74
|
-0.37
-0.51% |
$73.18
|
3,546,493
103.75% of 50 DAV
50 DAV is 3,418,200
|
$75.11
-3.16%
|
12/20/2011
|
$66.68
|
PP = $68.35
|
|
MB = $71.77
|
Most Recent Note - 1/17/2012 4:41:43 PM
G - Holding its ground after rallying beyond its "max buy" level with last week's streak of volume-driven gains. Prior highs in the $68 area define support to watch on pullbacks.
>>> The latest Featured Stock Update with an annotated graph appeared on 12/29/2011. Click here.
View all notes |
Alert me of new notes |
CANSLIM.net Company Profile |
SEC |
Zacks Reports |
StockTalk |
News |
Chart |
Request a new note
C
A N
S L
I M
|
FEIC
-
NASDAQ
F E I Co
ELECTRONICS - Diversified Electronics
|
$44.59
|
+0.98
2.25% |
$44.76
|
400,514
143.04% of 50 DAV
50 DAV is 280,000
|
$44.41
0.41%
|
12/7/2011
|
$41.41
|
PP = $42.35
|
|
MB = $44.47
|
 Most Recent Note - 1/18/2012 6:38:02 PM
G - Gain today backed by +43% above average volume lifted it above its "max buy" level and its color code is changed to green while getting extended from its prior base. No overhead supply remains to hinder its upward progress. The 50 DMA line defines chart support above prior lows.
>>> The latest Featured Stock Update with an annotated graph appeared on 12/21/2011. Click here.
View all notes |
Alert me of new notes |
CANSLIM.net Company Profile |
SEC |
Zacks Reports |
StockTalk |
News |
Chart |
Request a new note
C
A N
S L
I M
|
Symbol/Exchange
Company Name
Industry Group |
PRICE |
CHANGE
(%Change) |
Day High |
Volume
(% DAV)
(% 50 day avg vol) |
52 Wk Hi
% From Hi |
Featured
Date |
Price
Featured |
Pivot Featured |
|
Max Buy |
GNC
-
NYSE
G N C Holdings Inc
RETAIL - Drug Stores
|
$28.46
|
+0.53
1.90% |
$28.66
|
896,468
85.09% of 50 DAV
50 DAV is 1,053,500
|
$29.50
-3.53%
|
10/26/2011
|
$24.60
|
PP = $24.80
|
|
MB = $26.04
|
Most Recent Note - 1/17/2012 4:45:02 PM
G - Volume totals have been cooling while holding its ground since finding prompt support near its 50 DMA line. Subsequent losses below its 50 DMA and recent chart low (1/09/12 low of $26.54) would raise more serious concerns and trigger more worrisome technical sell signals.
>>> The latest Featured Stock Update with an annotated graph appeared on 12/16/2011. Click here.
View all notes |
Alert me of new notes |
CANSLIM.net Company Profile |
SEC |
Zacks Reports |
StockTalk |
News |
Chart |
Request a new note
C
A N
S L
I M
|
HMSY
-
NASDAQ
H M S Holdings Corp
COMPUTER SOFTWARE and SERVICES - Healthcare Information Service
|
$34.03
|
+0.66
1.98% |
$34.06
|
926,977
95.65% of 50 DAV
50 DAV is 969,100
|
$33.48
1.64%
|
10/27/2011
|
$26.44
|
PP = $28.37
|
|
MB = $29.79
|
Most Recent Note - 1/17/2012 4:29:18 PM
G - Hit a new all-time high with today's gain backed by higher but still below average volume. No resistance remains to hinder its progress, but it is extended from its prior base.
>>> The latest Featured Stock Update with an annotated graph appeared on 12/28/2011. Click here.
View all notes |
Alert me of new notes |
CANSLIM.net Company Profile |
SEC |
Zacks Reports |
StockTalk |
News |
Chart |
Request a new note
C
A N
S L
I M
|
ISRG
-
NASDAQ
Intuitive Surgical Inc
HEALTH SERVICES - Medical Appliances and Equipment
|
$470.86
|
+5.50
1.18% |
$471.20
|
294,789
98.03% of 50 DAV
50 DAV is 300,700
|
$474.50
-0.77%
|
12/20/2011
|
$442.43
|
PP = $449.16
|
|
MB = $471.62
|
Most Recent Note - 1/18/2012 6:33:26 PM
Y - Posted a 5th consecutive small gain today on average volume. Due to report earnings after Thursday's close. See the latest FSU analysis for more details and a new annotated graph.
>>> The latest Featured Stock Update with an annotated graph appeared on 1/18/2012. Click here.
View all notes |
Alert me of new notes |
CANSLIM.net Company Profile |
SEC |
Zacks Reports |
StockTalk |
News |
Chart |
Request a new note
C
A N
S L
I M
|
LULU
-
NASDAQ
Lululemon Athletica
MANUFACTURING - Textile Manufacturing
|
$60.51
|
-0.17
-0.28% |
$60.98
|
2,305,530
58.66% of 50 DAV
50 DAV is 3,930,100
|
$64.49
-6.17%
|
1/10/2012
|
$60.97
|
PP = $59.46
|
|
MB = $62.43
|
Most Recent Note - 1/17/2012 4:33:25 PM
Y - Pulled back today on below average volume. A considerable gap up gain on 1/10/12 helped it break out from a "double bottom" base. Prior chart highs in the low $60s have been acting as a recent resistance level.
>>> The latest Featured Stock Update with an annotated graph appeared on 1/10/2012. Click here.
View all notes |
Alert me of new notes |
CANSLIM.net Company Profile |
SEC |
Zacks Reports |
StockTalk |
News |
Chart |
Request a new note
C
A N
S L
I M
|
MA
-
NYSE
Mastercard Inc Cl A
DIVERSIFIED SERVICES - Business/Management Services
|
$352.38
|
+6.41
1.85% |
$354.51
|
1,243,257
122.86% of 50 DAV
50 DAV is 1,011,900
|
$384.99
-8.47%
|
1/3/2012
|
$367.87
|
PP = $385.09
|
|
MB = $404.34
|
Most Recent Note - 1/17/2012 4:36:57 PM
G - Posted a gain today on near average volume. It remains -10% off its 52-week high and below its 50 DMA line. It recently has sputtered near its late-November lows, leaving its 200 DMA line as the nearest support level to watch now.
>>> The latest Featured Stock Update with an annotated graph appeared on 1/3/2012. Click here.
View all notes |
Alert me of new notes |
CANSLIM.net Company Profile |
SEC |
Zacks Reports |
StockTalk |
News |
Chart |
Request a new note
C
A N
S L
I M
|
Symbol/Exchange
Company Name
Industry Group |
PRICE |
CHANGE
(%Change) |
Day High |
Volume
(% DAV)
(% 50 day avg vol) |
52 Wk Hi
% From Hi |
Featured
Date |
Price
Featured |
Pivot Featured |
|
Max Buy |
MKTX
-
NASDAQ
Marketaxess Holdings Inc
FINANCIAL SERVICES - Investment Brokerage - Nationa
|
$31.45
|
+0.89
2.91% |
$31.58
|
91,607
48.60% of 50 DAV
50 DAV is 188,500
|
$32.23
-2.42%
|
10/28/2011
|
$29.79
|
PP = $31.05
|
|
MB = $32.60
|
Most Recent Note - 1/18/2012 6:35:17 PM
Y - Still hovering near its all-time high without truly great volume conviction behind recent gains. The 50 DMA line defines initial chart support to watch.
>>> The latest Featured Stock Update with an annotated graph appeared on 12/20/2011. Click here.
View all notes |
Alert me of new notes |
CANSLIM.net Company Profile |
SEC |
Zacks Reports |
StockTalk |
News |
Chart |
Request a new note
C
A N
S L
I M
|
OSIS
-
NASDAQ
O S I Systems Inc
ELECTRONICS - Semiconductor Equipment and Mate
|
$54.17
|
+3.67
7.27% |
$54.26
|
107,543
111.33% of 50 DAV
50 DAV is 96,600
|
$51.06
6.09%
|
11/1/2011
|
$42.07
|
PP = $45.57
|
|
MB = $47.85
|
Most Recent Note - 1/18/2012 1:13:43 PM
G - Gapped up today, rallying for a considerable gain and new all-time highs, getting more extended from its prior base. Reported news of a six-year agreement for $400 million to provide turnkey screening services to Mexico's tax collection authority. Due to report earnings before the open on Tuesday, January 24th. Its 50 DMA line defines important support to watch.
>>> The latest Featured Stock Update with an annotated graph appeared on 12/27/2011. Click here.
View all notes |
Alert me of new notes |
CANSLIM.net Company Profile |
SEC |
Zacks Reports |
StockTalk |
News |
Chart |
Request a new note
C
A N
S L
I M
|
PRGO
-
NASDAQ
Perrigo Co
DRUGS - Drug Related Products
|
$99.85
|
+1.96
2.00% |
$99.85
|
712,338
55.37% of 50 DAV
50 DAV is 1,286,400
|
$104.70
-4.63%
|
12/9/2011
|
$99.54
|
PP = $101.56
|
|
MB = $106.64
|
Most Recent Note - 1/13/2012 4:50:18 PM
G - Quietly consolidating above support at its 50 DMA line, hovering near previously stubborn resistance in the low $100s.
>>> The latest Featured Stock Update with an annotated graph appeared on 1/9/2012. Click here.
View all notes |
Alert me of new notes |
CANSLIM.net Company Profile |
SEC |
Zacks Reports |
StockTalk |
News |
Chart |
Request a new note
C
A N
S L
I M
|
RAX
-
NYSE
Rackspace Hosting Inc
INTERNET - Internet Software and; Services
|
$43.28
|
+0.29
0.67% |
$43.62
|
1,053,388
64.21% of 50 DAV
50 DAV is 1,640,600
|
$46.50
-6.91%
|
11/8/2011
|
$44.28
|
PP = $46.27
|
|
MB = $48.58
|
Most Recent Note - 1/13/2012 4:53:21 PM
Y - Gains without great volume conviction helped it rally back above its 50 DMA line this week. Color code is changed to yellow again as it is perched within striking distance of its pivot point. Its 200 DMA line defines the next near-term support level to watch.
>>> The latest Featured Stock Update with an annotated graph appeared on 1/5/2012. Click here.
View all notes |
Alert me of new notes |
CANSLIM.net Company Profile |
SEC |
Zacks Reports |
StockTalk |
News |
Chart |
Request a new note
C
A N
S L
I M
|
SXCI
-
NASDAQ
S X C Health Solutions
COMPUTER SOFTWARE and SERVICES - Healthcare Information Service
|
$63.15
|
+1.89
3.09% |
$63.79
|
532,615
127.09% of 50 DAV
50 DAV is 419,100
|
$66.40
-4.89%
|
1/10/2012
|
$62.05
|
PP = $60.10
|
|
MB = $63.11
|
Most Recent Note - 1/18/2012 6:31:47 PM
G - Color code is changed to green after rallying back above its "max buy" level. Ownership by top-rated funds has been increasing, rising from 453 in Jun '10 to 602 in Dec '11, a reassuring sign concerning the I criteria. Strong prior quarters and good annual earnings history satisfy the C & A criteria.
There are no Featured Stock Updates™ available for this stock at this time. You may request one by clicking the Request a New Note link below
View all notes |
Alert me of new notes |
CANSLIM.net Company Profile |
SEC |
Zacks Reports |
StockTalk |
News |
Chart |
Request a new note
C
A N
S L
I M
|
Symbol/Exchange
Company Name
Industry Group |
PRICE |
CHANGE
(%Change) |
Day High |
Volume
(% DAV)
(% 50 day avg vol) |
52 Wk Hi
% From Hi |
Featured
Date |
Price
Featured |
Pivot Featured |
|
Max Buy |
TDG
-
NYSE
Transdigm Group Inc
AEROSPACE/DEFENSE - Aerospace/Defense Products and; Services
|
$96.60
|
-1.37
-1.40% |
$98.15
|
267,041
79.01% of 50 DAV
50 DAV is 338,000
|
$102.73
-5.97%
|
1/10/2012
|
$98.83
|
PP = $102.83
|
|
MB = $107.97
|
Most Recent Note - 1/13/2012 4:57:58 PM
Y - No overhead supply remains to act as resistance and volume totals have been cooling while holding its ground. Volume driven gains for new highs may help it clear a base-on-base type pattern. Recent lows in the $90 area define the next nearby support level to watch above its 200 DMA line.
>>> The latest Featured Stock Update with an annotated graph appeared on 1/4/2012. Click here.
View all notes |
Alert me of new notes |
CANSLIM.net Company Profile |
SEC |
Zacks Reports |
StockTalk |
News |
Chart |
Request a new note
C
A N
S L
I M
|
TSCO
-
NASDAQ
Tractor Supply Co
SPECIALTY RETAIL - Specialty Retail, Other
|
$81.29
|
+0.81
1.01% |
$81.32
|
632,133
91.88% of 50 DAV
50 DAV is 688,000
|
$81.13
0.20%
|
1/12/2012
|
$79.12
|
PP = $75.58
|
|
MB = $79.36
|
Most Recent Note - 1/13/2012 12:33:56 PM
Y - At its all-time high today after a considerable "breakaway gap" on the prior session. Color code was changed to yellow with pivot point cited based on its 12/09/11 high plus 10 cents. See the latest FSU analysis for more details and a new annotated graph.
>>> The latest Featured Stock Update with an annotated graph appeared on 1/12/2012. Click here.
View all notes |
Alert me of new notes |
CANSLIM.net Company Profile |
SEC |
Zacks Reports |
StockTalk |
News |
Chart |
Request a new note
C
A N
S L
I M
|
ULTA
-
NASDAQ
Ulta Salon Cosm & Frag
SPECIALTY RETAIL - Specialty Retail, Other
|
$75.75
|
+1.62
2.19% |
$75.83
|
816,286
84.21% of 50 DAV
50 DAV is 969,400
|
$75.70
0.07%
|
1/11/2012
|
$71.97
|
PP = $75.80
|
|
MB = $79.59
|
Most Recent Note - 1/18/2012 6:41:01 PM
Y - Posted a 7th consecutive gain on near or below average volume and hit a new all-time high today, wedging up from a riskier late-stage base without sufficient volume to trigger a proper technical buy signal. Prior lows near $64 define important chart support above its 200 DMA line.
>>> The latest Featured Stock Update with an annotated graph appeared on 1/11/2012. Click here.
View all notes |
Alert me of new notes |
CANSLIM.net Company Profile |
SEC |
Zacks Reports |
StockTalk |
News |
Chart |
Request a new note
C
A N
S L
I M
|
V
-
NYSE
Visa Inc Cl A
DIVERSIFIED SERVICES - Business/Management Services
|
$103.78
|
+1.25
1.22% |
$103.88
|
2,938,046
77.35% of 50 DAV
50 DAV is 3,798,500
|
$103.45
0.32%
|
10/24/2011
|
$94.21
|
PP = $94.85
|
|
MB = $99.59
|
Most Recent Note - 1/17/2012 4:49:30 PM
G - Gain today has it perched near its all-time high and no overhead supply remains to act as resistance. Its 50 DMA line defines chart support to watch on pullbacks.
>>> The latest Featured Stock Update with an annotated graph appeared on 12/15/2011. Click here.
View all notes |
Alert me of new notes |
CANSLIM.net Company Profile |
SEC |
Zacks Reports |
StockTalk |
News |
Chart |
Request a new note
C
A N
S L
I M
|
|
|
|
THESE ARE NOT BUY RECOMMENDATIONS!
Comments contained in the body of this report are technical
opinions only. The material herein has been obtained
from sources believed to be reliable and accurate, however,
its accuracy and completeness cannot be guaranteed.
This site is not an investment advisor, hence it does
not endorse or recommend any securities or other investments.
Any recommendation contained in this report may not
be suitable for all investors and it is not to be deemed
an offer or solicitation on our part with respect to
the purchase or sale of any securities. All trademarks,
service marks and trade names appearing in this report
are the property of their respective owners, and are
likewise used for identification purposes only.
This report is a service available
only to active Paid Premium Members.
You may opt-out of receiving report notifications
at any time. Questions or comments may be submitted
by writing to Premium Membership Services 665 S.E. 10 Street, Suite 201 Deerfield Beach, FL 33441-5634 or by calling 1-800-965-8307
or 954-785-1121.
|
|
|

