***Last / Change / Volume data in this table is the closing quote data***
Symbol/Exchange
Company Name
Industry Group |
PRICE |
CHANGE
(%Change) |
Day High |
Volume
(% DAV)
(% 50 day avg vol) |
52 Wk Hi
% From Hi |
Featured
Date |
Price
Featured |
Pivot Featured |
|
Max Buy |
ADS
-
NYSE
Alliance Data Sys Corp
COMPUTER SOFTWARE and SERVICES - Information and Delivery Service
|
$106.03
|
-1.36
-1.27% |
$106.53
|
800,178
115.83% of 50 DAV
50 DAV is 690,800
|
$108.62
-2.38%
|
10/21/2011
|
$97.94
|
PP = $101.15
|
|
MB = $106.21
|
 Most Recent Note - 1/13/2012 4:40:57 PM
Y - Pulled back today after quietly wedging to a new all-time high on the prior session without great volume conviction. Its 50 DMA line and the 1/04/12 session low ($100.42) define near-term support where violations would raise greater concerns and trigger technical sell signals.
>>> The latest Featured Stock Update with an annotated graph appeared on 12/14/2011. Click here.
View all notes |
Alert me of new notes |
CANSLIM.net Company Profile |
SEC |
Zacks Reports |
StockTalk |
News |
Chart |
Request a new note
C
A N
S L
I M


|
ALXN
-
NASDAQ
Alexion Pharmaceuticals
DRUGS - Drug Manufacturers - Other
|
$74.62
|
+0.30
0.40% |
$75.06
|
864,033
72.99% of 50 DAV
50 DAV is 1,183,700
|
$76.20
-2.07%
|
11/30/2011
|
$68.66
|
PP = $70.52
|
|
MB = $74.05
|
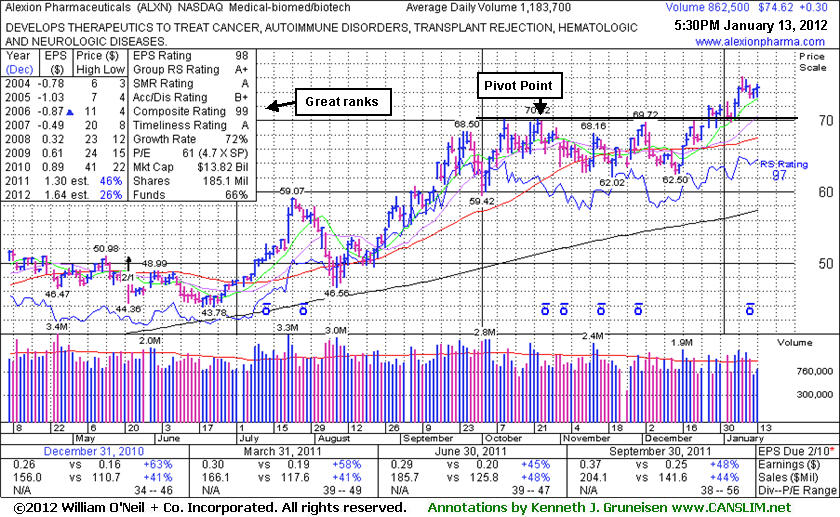
Most Recent Note - 1/13/2012 6:07:58 PM
G - Stubbornly holding its ground after rallying with volume-driven gains and getting extended from its prior base. Prior resistance in the $70 area defines initial chart support above its 50 DMA line. See the latest FSU analysis for more details and a new annotated graph.
>>> The latest Featured Stock Update with an annotated graph appeared on 1/13/2012. Click here.
View all notes |
Alert me of new notes |
CANSLIM.net Company Profile |
SEC |
Zacks Reports |
StockTalk |
News |
Chart |
Request a new note
C
A N
S L
I M
|
CATM
-
NASDAQ
Cardtronics Inc
DIVERSIFIED SERVICES - Business/Management Services
|
$25.71
|
-0.57
-2.17% |
$26.22
|
273,560
80.84% of 50 DAV
50 DAV is 338,400
|
$28.74
-10.54%
|
12/23/2011
|
$28.64
|
PP = $28.56
|
|
MB = $29.99
|
Most Recent Note - 1/13/2012 4:43:07 PM
G - Color code is changed to green again after slumping below its 50 DMA line today, raising concerns. Previously noted, "The gain on 12/23/11 was backed by +77% above average volume and it touched a new 52-week high, but it did not close above the new pivot point cited based on its 11/08/11 high plus 10 cents."
>>> The latest Featured Stock Update with an annotated graph appeared on 12/23/2011. Click here.
View all notes |
Alert me of new notes |
CANSLIM.net Company Profile |
SEC |
Zacks Reports |
StockTalk |
News |
Chart |
Request a new note
C
A N
S L
I M
|
CELG
-
NASDAQ
Celgene Corp
DRUGS - Drug Manufacturers - Major
|
$72.63
|
-0.57
-0.78% |
$72.90
|
2,848,579
82.85% of 50 DAV
50 DAV is 3,438,400
|
$73.49
-1.17%
|
12/20/2011
|
$66.68
|
PP = $68.35
|
|
MB = $71.77
|
Most Recent Note - 1/11/2012 5:03:48 PM
G - Color code is changed to green after rallying beyond its "max buy" level for another new 52-week high today. Its 1/10/12 gain and strong close was backed by +59% above average volume as it rallied above its pivot point triggering a technical buy signal.
>>> The latest Featured Stock Update with an annotated graph appeared on 12/29/2011. Click here.
View all notes |
Alert me of new notes |
CANSLIM.net Company Profile |
SEC |
Zacks Reports |
StockTalk |
News |
Chart |
Request a new note
C
A N
S L
I M
|
FEIC
-
NASDAQ
F E I Co
ELECTRONICS - Diversified Electronics
|
$43.39
|
-1.00
-2.25% |
$44.22
|
212,830
72.27% of 50 DAV
50 DAV is 294,500
|
$44.41
-2.30%
|
12/7/2011
|
$41.41
|
PP = $42.35
|
|
MB = $44.47
|
Most Recent Note - 1/13/2012 4:44:50 PM
Y - Pulled back on light volume today from the new all-time highs hit this week. Triggered a technical buy signal with +68% above average volume behind its gain on 1/11/12 while rising above its pivot point. No overhead supply remains to hinder its upward progress. The 50 DMA line defines chart support above prior lows.
>>> The latest Featured Stock Update with an annotated graph appeared on 12/21/2011. Click here.
View all notes |
Alert me of new notes |
CANSLIM.net Company Profile |
SEC |
Zacks Reports |
StockTalk |
News |
Chart |
Request a new note
C
A N
S L
I M
|
Symbol/Exchange
Company Name
Industry Group |
PRICE |
CHANGE
(%Change) |
Day High |
Volume
(% DAV)
(% 50 day avg vol) |
52 Wk Hi
% From Hi |
Featured
Date |
Price
Featured |
Pivot Featured |
|
Max Buy |
GNC
-
NYSE
G N C Holdings Inc
RETAIL - Drug Stores
|
$28.15
|
-0.17
-0.60% |
$28.35
|
377,309
33.84% of 50 DAV
50 DAV is 1,115,100
|
$29.50
-4.58%
|
10/26/2011
|
$24.60
|
PP = $24.80
|
|
MB = $26.04
|
Most Recent Note - 1/12/2012 3:42:19 PM
G - Holding its ground since finding prompt support near its 50 DMA line. Subsequent losses below its 50 DMA and recent chart low (1/09/12 low of $26.54) would raise more serious concerns and trigger more worrisome technical sell signals.
>>> The latest Featured Stock Update with an annotated graph appeared on 12/16/2011. Click here.
View all notes |
Alert me of new notes |
CANSLIM.net Company Profile |
SEC |
Zacks Reports |
StockTalk |
News |
Chart |
Request a new note
C
A N
S L
I M
|
HMSY
-
NASDAQ
H M S Holdings Corp
COMPUTER SOFTWARE and SERVICES - Healthcare Information Service
|
$32.53
|
+0.23
0.71% |
$32.59
|
370,959
37.83% of 50 DAV
50 DAV is 980,500
|
$32.83
-0.91%
|
10/27/2011
|
$26.44
|
PP = $28.37
|
|
MB = $29.79
|
Most Recent Note - 1/11/2012 4:58:14 PM
G - No resistance remains to hinder its progress, but it is slightly extended from its prior base. Holding its ground near its all-time high with volume totals cooling in recent weeks.
>>> The latest Featured Stock Update with an annotated graph appeared on 12/28/2011. Click here.
View all notes |
Alert me of new notes |
CANSLIM.net Company Profile |
SEC |
Zacks Reports |
StockTalk |
News |
Chart |
Request a new note
C
A N
S L
I M
|
ISRG
-
NASDAQ
Intuitive Surgical Inc
HEALTH SERVICES - Medical Appliances and Equipment
|
$459.44
|
+1.31
0.29% |
$460.99
|
203,369
67.03% of 50 DAV
50 DAV is 303,400
|
$474.50
-3.17%
|
12/20/2011
|
$442.43
|
PP = $449.16
|
|
MB = $471.62
|
Most Recent Note - 1/11/2012 4:59:33 PM
Y - Gain today on average volume halted a streak of 3 consecutive losses. Recently enduring mild distributional pressure while churning near its all-time high, and previously noted, "Recent gains above its pivot point have lacked the volume needed to trigger a proper new (or add-on) technical buy signal. Important support is defined by its 50 DMA line."
>>> The latest Featured Stock Update with an annotated graph appeared on 12/13/2011. Click here.
View all notes |
Alert me of new notes |
CANSLIM.net Company Profile |
SEC |
Zacks Reports |
StockTalk |
News |
Chart |
Request a new note
C
A N
S L
I M
|
LULU
-
NASDAQ
Lululemon Athletica
MANUFACTURING - Textile Manufacturing
|
$61.96
|
+0.72
1.18% |
$62.12
|
2,814,509
71.42% of 50 DAV
50 DAV is 3,940,600
|
$64.49
-3.92%
|
1/10/2012
|
$60.97
|
PP = $59.46
|
|
MB = $62.43
|
Most Recent Note - 1/11/2012 12:32:55 PM
Y - Holding its ground today following a considerable gap up gain on 1/10/12 when noted rising from a "double bottom" base. Prior chart highs in the low $60s may now act as a resistance level. See the latest FSU analysis for more details and a new annotated graph.
>>> The latest Featured Stock Update with an annotated graph appeared on 1/10/2012. Click here.
View all notes |
Alert me of new notes |
CANSLIM.net Company Profile |
SEC |
Zacks Reports |
StockTalk |
News |
Chart |
Request a new note
C
A N
S L
I M
|
MA
-
NYSE
Mastercard Inc Cl A
DIVERSIFIED SERVICES - Business/Management Services
|
$339.08
|
-4.22
-1.23% |
$345.97
|
1,254,485
119.30% of 50 DAV
50 DAV is 1,051,500
|
$384.99
-11.92%
|
1/3/2012
|
$367.87
|
PP = $385.09
|
|
MB = $404.34
|
Most Recent Note - 1/11/2012 2:26:21 PM
G - Slumping further below its 50 DMA line and under late-November lows raising greater concerns. Its 200 DMA line defines the next nearest support level as technical damage mounts.
>>> The latest Featured Stock Update with an annotated graph appeared on 1/3/2012. Click here.
View all notes |
Alert me of new notes |
CANSLIM.net Company Profile |
SEC |
Zacks Reports |
StockTalk |
News |
Chart |
Request a new note
C
A N
S L
I M
|
Symbol/Exchange
Company Name
Industry Group |
PRICE |
CHANGE
(%Change) |
Day High |
Volume
(% DAV)
(% 50 day avg vol) |
52 Wk Hi
% From Hi |
Featured
Date |
Price
Featured |
Pivot Featured |
|
Max Buy |
MKTX
-
NASDAQ
Marketaxess Holdings Inc
FINANCIAL SERVICES - Investment Brokerage - Nationa
|
$30.64
|
-0.23
-0.75% |
$30.94
|
100,607
50.30% of 50 DAV
50 DAV is 200,000
|
$32.23
-4.93%
|
10/28/2011
|
$29.79
|
PP = $31.05
|
|
MB = $32.60
|
Most Recent Note - 1/11/2012 2:44:38 PM
Y - Pulling back today following 2 prior gains into new all-time high territory without truly great volume conviction. The 50 DMA line defines initial chart support to watch.
>>> The latest Featured Stock Update with an annotated graph appeared on 12/20/2011. Click here.
View all notes |
Alert me of new notes |
CANSLIM.net Company Profile |
SEC |
Zacks Reports |
StockTalk |
News |
Chart |
Request a new note
C
A N
S L
I M
|
OSIS
-
NASDAQ
O S I Systems Inc
ELECTRONICS - Semiconductor Equipment and Mate
|
$50.32
|
+0.06
0.12% |
$50.40
|
76,119
75.51% of 50 DAV
50 DAV is 100,800
|
$51.06
-1.45%
|
11/1/2011
|
$42.07
|
PP = $45.57
|
|
MB = $47.85
|
Most Recent Note - 1/12/2012 3:45:33 PM
G - Pulling back today on light volume after a streak of 7 consecutive small gains, getting extended from its prior base. Its 50 DMA line defines important near-term support to watch.
>>> The latest Featured Stock Update with an annotated graph appeared on 12/27/2011. Click here.
View all notes |
Alert me of new notes |
CANSLIM.net Company Profile |
SEC |
Zacks Reports |
StockTalk |
News |
Chart |
Request a new note
C
A N
S L
I M
|
PRGO
-
NASDAQ
Perrigo Co
DRUGS - Drug Related Products
|
$97.02
|
-0.47
-0.48% |
$97.58
|
596,080
45.62% of 50 DAV
50 DAV is 1,306,500
|
$104.70
-7.34%
|
12/9/2011
|
$99.54
|
PP = $101.56
|
|
MB = $106.64
|
Most Recent Note - 1/13/2012 4:50:18 PM
G - Quietly consolidating above support at its 50 DMA line, hovering near previously stubborn resistance in the low $100s.
>>> The latest Featured Stock Update with an annotated graph appeared on 1/9/2012. Click here.
View all notes |
Alert me of new notes |
CANSLIM.net Company Profile |
SEC |
Zacks Reports |
StockTalk |
News |
Chart |
Request a new note
C
A N
S L
I M
|
RAX
-
NYSE
Rackspace Hosting Inc
INTERNET - Internet Software and; Services
|
$43.35
|
+0.16
0.37% |
$43.73
|
1,105,021
67.13% of 50 DAV
50 DAV is 1,646,200
|
$46.50
-6.76%
|
11/8/2011
|
$44.28
|
PP = $46.27
|
|
MB = $48.58
|
Most Recent Note - 1/13/2012 4:53:21 PM
Y - Gains without great volume conviction helped it rally back above its 50 DMA line this week. Color code is changed to yellow again as it is perched within striking distance of its pivot point. Its 200 DMA line defines the next near-term support level to watch.
>>> The latest Featured Stock Update with an annotated graph appeared on 1/5/2012. Click here.
View all notes |
Alert me of new notes |
CANSLIM.net Company Profile |
SEC |
Zacks Reports |
StockTalk |
News |
Chart |
Request a new note
C
A N
S L
I M
|
SXCI
-
NASDAQ
S X C Health Solutions
COMPUTER SOFTWARE and SERVICES - Healthcare Information Service
|
$62.64
|
-0.26
-0.41% |
$62.87
|
580,597
133.99% of 50 DAV
50 DAV is 433,300
|
$66.40
-5.66%
|
1/10/2012
|
$62.05
|
PP = $60.10
|
|
MB = $63.11
|
Most Recent Note - 1/13/2012 4:56:05 PM
Y - Color code is changed to yellow after pulling back below its "max buy" level. Its technical breakout was featured in yellow in the 1/10/12 mid-day report (read here) with pivot point cited based on its 12/02/11 high plus 10 cents. Ownership by top-rated funds has been increasing, rising from 453 in Jun '10 to 600 in Dec '11, a reassuring sign concerning the I criteria. Reported earnings +57% on +163% sales revenues for the quarter ended September 31, 2011 versus the year ago period. Strong prior quarters and good annual earnings history satisfy the C & A criteria.

There are no Featured Stock Updates™ available for this stock at this time. You may request one by clicking the Request a New Note link below
View all notes |
Alert me of new notes |
CANSLIM.net Company Profile |
SEC |
Zacks Reports |
StockTalk |
News |
Chart |
Request a new note
C
A N
S L
I M
|
Symbol/Exchange
Company Name
Industry Group |
PRICE |
CHANGE
(%Change) |
Day High |
Volume
(% DAV)
(% 50 day avg vol) |
52 Wk Hi
% From Hi |
Featured
Date |
Price
Featured |
Pivot Featured |
|
Max Buy |
TDG
-
NYSE
Transdigm Group Inc
AEROSPACE/DEFENSE - Aerospace/Defense Products and; Services
|
$97.56
|
-0.47
-0.48% |
$98.04
|
138,342
40.56% of 50 DAV
50 DAV is 341,100
|
$102.73
-5.03%
|
1/10/2012
|
$98.83
|
PP = $102.83
|
|
MB = $107.97
|
Most Recent Note - 1/13/2012 4:57:58 PM
Y - No overhead supply remains to act as resistance and volume totals have been cooling while holding its ground. Volume driven gains for new highs may help it clear a base-on-base type pattern. Recent lows in the $90 area define the next nearby support level to watch above its 200 DMA line.
>>> The latest Featured Stock Update with an annotated graph appeared on 1/4/2012. Click here.
View all notes |
Alert me of new notes |
CANSLIM.net Company Profile |
SEC |
Zacks Reports |
StockTalk |
News |
Chart |
Request a new note
C
A N
S L
I M
|
TSCO
-
NASDAQ
Tractor Supply Co
SPECIALTY RETAIL - Specialty Retail, Other
|
$80.56
|
+0.36
0.45% |
$81.13
|
1,245,410
180.57% of 50 DAV
50 DAV is 689,700
|
$80.56
0.00%
|
1/12/2012
|
$79.12
|
PP = $75.58
|
|
MB = $79.36
|
Most Recent Note - 1/13/2012 12:33:56 PM
Y - At its all-time high today after a considerable "breakaway gap" on the prior session. Color code was changed to yellow with pivot point cited based on its 12/09/11 high plus 10 cents. See the latest FSU analysis for more details and a new annotated graph.
>>> The latest Featured Stock Update with an annotated graph appeared on 1/12/2012. Click here.
View all notes |
Alert me of new notes |
CANSLIM.net Company Profile |
SEC |
Zacks Reports |
StockTalk |
News |
Chart |
Request a new note
C
A N
S L
I M
|
ULTA
-
NASDAQ
Ulta Salon Cosm & Frag
SPECIALTY RETAIL - Specialty Retail, Other
|
$73.13
|
+1.20
1.67% |
$73.67
|
1,051,151
105.85% of 50 DAV
50 DAV is 993,100
|
$75.70
-3.39%
|
1/11/2012
|
$71.97
|
PP = $75.80
|
|
MB = $79.59
|
Most Recent Note - 1/13/2012 5:03:20 PM
Y - Finished today only $1.11 from its best ever close, still building on a riskier late-stage base. Prior lows near $64 define important chart support above its 200 DMA line. See the latest FSU analysis for more details and a new annotated graph.
>>> The latest Featured Stock Update with an annotated graph appeared on 1/11/2012. Click here.
View all notes |
Alert me of new notes |
CANSLIM.net Company Profile |
SEC |
Zacks Reports |
StockTalk |
News |
Chart |
Request a new note
C
A N
S L
I M
|
V
-
NYSE
Visa Inc Cl A
DIVERSIFIED SERVICES - Business/Management Services
|
$100.74
|
-0.60
-0.59% |
$101.79
|
4,156,749
106.43% of 50 DAV
50 DAV is 3,905,800
|
$103.45
-2.62%
|
10/24/2011
|
$94.21
|
PP = $94.85
|
|
MB = $99.59
|
Most Recent Note - 1/12/2012 3:36:24 PM
G - Gain today halted a streak of 4consecutive losses. Its 50 DMA line defines chart support to watch on pullbacks.
>>> The latest Featured Stock Update with an annotated graph appeared on 12/15/2011. Click here.
View all notes |
Alert me of new notes |
CANSLIM.net Company Profile |
SEC |
Zacks Reports |
StockTalk |
News |
Chart |
Request a new note
C
A N
S L
I M
|