You are not logged in.
This means you
CAN ONLY VIEW reports that were published prior to Monday, February 26, 2024.
You
MUST UPGRADE YOUR MEMBERSHIP if you want to see any current reports.
AFTER MARKET UPDATE - TUESDAY, JANUARY 7TH, 2020
Previous After Market Report Next After Market Report >>>
|
|
|
|
DOW |
-119.70 |
28,583.68 |
-0.42% |
|
Volume |
792,166,860 |
-19% |
|
Volume |
2,343,362,880 |
-16% |
|
NASDAQ |
-2.88 |
9,068.58 |
-0.03% |
|
Advancers |
1,256 |
44% |
|
Advancers |
1,448 |
46% |
|
S&P 500 |
-9.10 |
3,237.18 |
-0.28% |
|
Decliners |
1,624 |
56% |
|
Decliners |
1,700 |
54% |
|
Russell 2000 |
-4.95 |
1,658.31 |
-0.30% |
|
52 Wk Highs |
131 |
|
|
52 Wk Highs |
144 |
|
|
S&P 600 |
-5.67 |
1,014.09 |
-0.56% |
|
52 Wk Lows |
11 |
|
|
52 Wk Lows |
20 |
|
|
 |
Major Indices Fell With Lighter Volume Totals
Kenneth J. Gruneisen - Passed the CAN SLIM® Master's Exam
The Dow fell 119 points, while the S&P 500 dipped 0.3%. The Nasdaq Composite was down less than 0.1%. Decliners led advancers by a 4-3 margin on the NYSE and 8-7 on the Nasdaq exchange. The reported volume was lighter than the prior session totals on the NYSE and on the Nasdaq exchange, a sign that institutional investors were not heavy sellers. There were 53 high-ranked companies from the Leaders List that hit a new 52-week high and were listed on the BreakOuts Page, versus the total of 43 on the prior session. New 52-week highs totals easily outnumbered new 52-week lows totals on the NYSE and on the Nasdaq exchange. The major indices (M criteria) are in a "confirmed uptrend" after enduring distributional pressure in recent weeks. The Featured Stocks Page provides the most timely analysis on high-ranked leaders. Charts used courtesy of www.stockcharts.com
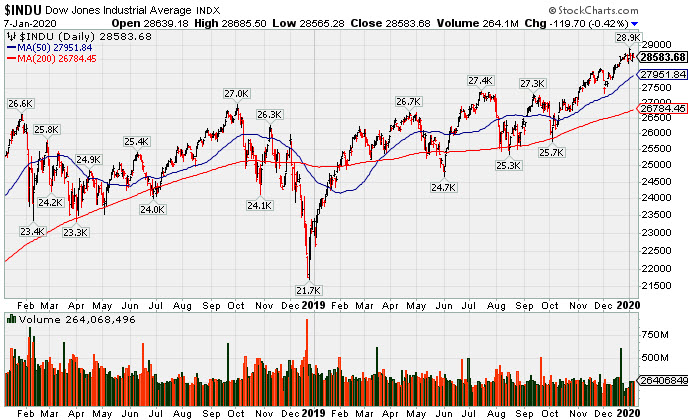
PICTURED: The Dow Jones Industrial Average remains perched near its record high.
Stocks finished lower on Tuesday, as investors continued to weigh escalating geopolitical tensions in the Middle East. Risk sentiment has been pressured in the aftermath of the U.S. killing a key Iranian military leader last week. Tehran subsequently ramped up retaliatory rhetoric, while Washington issued a warning of its own. Treasuries declined despite the geopolitical concerns, with the yield on the 10-year note up two basis points to 1.82%. In commodities, WTI crude slid 0.9% to $62.70/barrel. COMEX gold rose 0.3% to $1,573.50/ounce.
All 11 S&P 500 sectors closed in negative territory, with Real Estate, Consumer Staples, and Financials all losing more than 0.6%. Chipmakers outperformed, with the Philadelphia Semiconductor Index climbing 1.8%. Microchip Technology (MCHP +6.71%) rose after increasing its most recent quarterly guidance, suggesting the December quarter represented the bottom of the current semi-cycle. Meanwhile, Micron Technology (MU +8.78%) and Western Digital Corp. (WDC +6.77%) both rose following analyst upgrades.
In other corporate news, Apache Corp. (APA +26.78%) posted its largest jump in almost 50 years after the oil and gas company reported a “significant oil discovery” off the coast of South America. Elsewhere, Goldman Sachs (GS +0.66%) inched higher after announcing a reorganization to its reporting structure in order to increase transparency.
On the data front, an update from the Institute for Supply Management (ISM) showed the services sector expanded at a faster-than-anticipated pace in December. Separately, the U.S. trade deficit narrowed to a three-year low in November.
|
 Kenneth J. Gruneisen started out as a licensed stockbroker in August 1987, a couple of months prior to the historic stock market crash that took the Dow Jones Industrial Average down -22.6% in a single day. He has published daily fact-based fundamental and technical analysis on high-ranked stocks online for two decades. Through FACTBASEDINVESTING.COM, Kenneth provides educational articles, news, market commentary, and other information regarding proven investment systems that work in good times and bad.
Comments contained in the body of this report are technical opinions only and are not necessarily those of Gruneisen Growth Corp. The material herein has been obtained from sources believed to be reliable and accurate, however, its accuracy and completeness cannot be guaranteed. Our firm, employees, and customers may effect transactions, including transactions contrary to any recommendation herein, or have positions in the securities mentioned herein or options with respect thereto. Any recommendation contained in this report may not be suitable for all investors and it is not to be deemed an offer or solicitation on our part with respect to the purchase or sale of any securities. |
|
 |
Semiconductor, Biotech, Broker/Dealer, and Gold & Silver Indexes Rose
Kenneth J. Gruneisen - Passed the CAN SLIM® Master's Exam
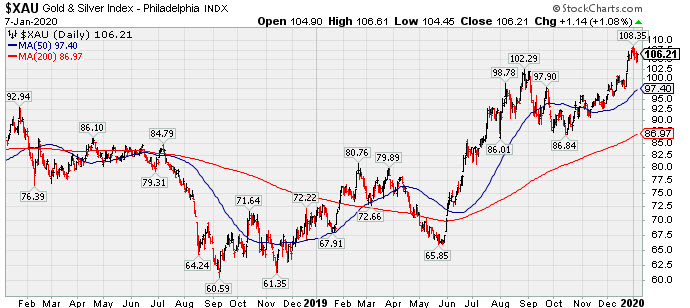
The Gold & Silver Index ($XAU +1.08%) rose while the Integrated Oil Index ($XOI +0.02%) finished flat and the Oil Services Index ($OSX -1.75%) fell. The Retail Index ($RLX -0.04%) finished flat, meanwhile financial shares were mixed as the Broker/Dealer Index ($XBD +0.34%) edged higher but the Bank Index ($BKX -0.68%) suffered a loss. The tech sector had a mostly positive bias as the Semiconductor Index ($SOX +1.78%) led the way higher and the Biotech Index ($BTK +0.34%) edged higher but the Networking Index ($NWX -0.19%) fell slightly.
PICTURED: The 2-year graph of the Gold & Silver Index ($XAU +1.08%) shows it perched near a multi-year high.
| Oil Services |
$OSX |
79.57 |
-1.42 |
-1.75% |
+1.63% |
| Integrated Oil |
$XOI |
1,293.41 |
+0.26 |
+0.02% |
+1.80% |
| Semiconductor |
$SOX |
1,867.28 |
+32.60 |
+1.78% |
+0.95% |
| Networking |
$NWX |
582.73 |
-1.12 |
-0.19% |
-0.12% |
| Broker/Dealer |
$XBD |
291.20 |
+0.99 |
+0.34% |
+0.28% |
| Retail |
$RLX |
2,478.14 |
-1.06 |
-0.04% |
+1.18% |
| Gold & Silver |
$XAU |
106.21 |
+1.14 |
+1.08% |
-0.66% |
| Bank |
$BKX |
111.11 |
-0.76 |
-0.68% |
-1.98% |
| Biotech |
$BTK |
5,051.59 |
+17.07 |
+0.34% |
-0.31% |
|
|
|
 |
Perched at All-Time HIgh Following Recent Volume-Driven Gain
Kenneth J. Gruneisen - Passed the CAN SLIM® Master's Exam
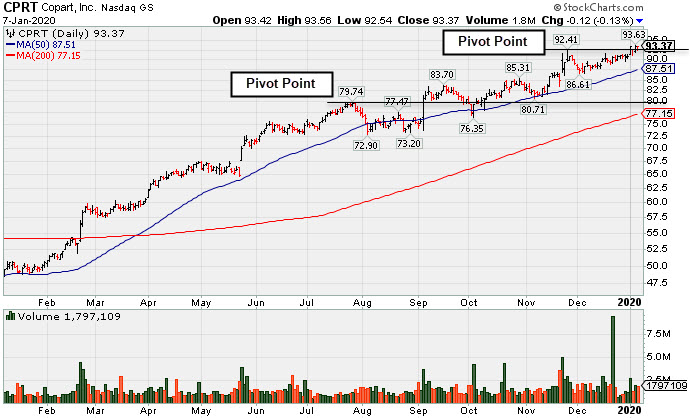
Copart Inc (CPRT -$0.12 or -0.13% to $93.37) is quietly perched near its all-time high. Its gain on 1/02/20 was backed by +45% above average volume as it rose above the new pivot point cited based on its 11/25/19 high plus 10 cents triggering a proper new (or add-on) technical buy signal. Its 50-day moving average (DMA) line ($87.51) defines near-term support.
Fundamentals remain strong. Bullish action came after it reported earnings +38% on +20% sales revenues for the Oct '19 quarter, continuing its strong earnings track record. The past 3 quarterly earnings increases were above the +25% minimum guideline (C criteria) and its sales revenues growth rate has accelerated. Annual earnings (A criteria) history has been strong and steady since a downturn in FY '13.
CPRT was last shown in this FSU session on 12/12/19 with an annotated graph under the headline, "Extended From Prior Base and Hovering Near Record High". A volume-driven gain above the pivot point on 9/05/19 clinched a technical buy signal when CPRT was highlighted in yellow with pivot point cited based on its 7/26/19 high plus 10 cents (read here).
The number of top-rated funds owning its shares rose from 1,120 in Sep '18 to 1,452 in Sep '19, a reassuring sign concerning the I criteria. It has a Timeliness Rating of A and Sponsorship Rating of B. Its current Up/Down Volume Ratio of 1.8 is an unbiased indication its shares have been under accumulation over the past 50 days.
|
|
|
Color Codes Explained :
Y - Better candidates highlighted by our
staff of experts.
G - Previously featured
in past reports as yellow but may no longer be buyable under the
guidelines.
***Last / Change / Volume data in this table is the closing quote data***
Symbol/Exchange
Company Name
Industry Group |
PRICE |
CHANGE
(%Change) |
Day High |
Volume
(% DAV)
(% 50 day avg vol) |
52 Wk Hi
% From Hi |
Featured
Date |
Price
Featured |
Pivot Featured |
|
Max Buy |
 MLR
-
NYSE
MLR
-
NYSE
Miller Industries Inc
AUTOMOTIVE - Auto Parts
|
$36.36
|
-0.07
-0.19% |
$36.66
|
28,926
65.74% of 50 DAV
50 DAV is 44,000
|
$38.18
-4.77%
|
9/24/2019
|
$34.00
|
PP = $35.36
|
|
MB = $37.13
|
Most Recent Note - 1/2/2020 4:44:22 PM
G - Still quietly hovering near its 52-week high and just above its "max buy" level. Its 50 DMA line ($36.15) and prior highs in the $35 area define near-term support to watch. Resilient after reporting Sep '19 earnings which were below the fundamental guidelines of the fact-based investment system.
>>> FEATURED STOCK ARTICLE : Towing/Recovery Equipment Firm Remains Perched Near Record High - 12/27/2019 |
View all notes |
Set NEW NOTE alert |
Company Profile |
SEC
News |
Chart |
Request a new note
C
A
S
I |
CCBG
-
NASDAQ
Capital City Bk Gp
BANKING - Regional - Mid-Atlantic Banks
|
$29.47
|
-0.23
-0.77% |
$29.65
|
32,436
70.51% of 50 DAV
50 DAV is 46,000
|
$30.95
-4.78%
|
12/16/2019
|
$30.07
|
PP = $30.95
|
|
MB = $32.50
|
Most Recent Note - 1/2/2020 3:59:16 PM
Y - Hovering within close striking distance of its 52-week high, recently meeting resistance. Subsequent gains and a strong close above the new pivot point cited based on its 11/06/19 high plus 10 cents may trigger a new (or add-on) technical buy signal. Found support at its 50 DMA line ($29.47) during its orderly consolidation.
>>> FEATURED STOCK ARTICLE : Perched Near 52-Week High After Forming an Orderly Base - 1/2/2020 |
View all notes |
Set NEW NOTE alert |
Company Profile |
SEC
News |
Chart |
Request a new note
C
A
S
I |
FTNT
-
NASDAQ
Fortinet Inc
Computer Sftwr-Security
|
$111.89
|
-0.11
-0.10% |
$112.51
|
755,621
54.91% of 50 DAV
50 DAV is 1,376,000
|
$112.36
-0.42%
|
12/9/2019
|
$103.85
|
PP = $106.10
|
|
MB = $111.41
|
Most Recent Note - 1/6/2020 5:56:39 PM
G - Hit a new 52-week high with today's 3rd consecutive gain marked by average volume. Color code is changed to green after wedging above its "max buy" level. Its 50 DMA line ($100.73) and prior low ($99.78 on 12/03/19) define important near-term support to watch.
>>> FEATURED STOCK ARTICLE : Endured Distributional Pressure While Perched at High - 12/23/2019 |
View all notes |
Set NEW NOTE alert |
Company Profile |
SEC
News |
Chart |
Request a new note
C
A
S
I |
SPSC
-
NASDAQ
S P S Commerce Inc
COMPUTER SOFTWARE and SERVICES - Application Software
|
$55.79
|
-0.12
-0.21% |
$56.28
|
92,040
45.79% of 50 DAV
50 DAV is 201,000
|
$59.14
-5.66%
|
11/29/2019
|
$56.59
|
PP = $59.24
|
|
MB = $62.20
|
Most Recent Note - 1/2/2020 4:09:53 PM
Y - Still perched -5.3% off its all-time high. Subsequent gains above its pivot point backed by at least +40% above average volume are needed to trigger a new technical buy signal. Fundamentals remain strong, however, its Relative Strength Rating has slumped to 78, below the 80+ minimum guideline for buy candidates..
>>> FEATURED STOCK ARTICLE : Perched Within Close Striking Distance of 52-Week High - 12/20/2019 |
View all notes |
Set NEW NOTE alert |
Company Profile |
SEC
News |
Chart |
Request a new note
C
A
S
I |
AUDC
-
NASDAQ
Audiocodes Ltd
ELECTRONICS - Scientific and Technical Instrum
|
$24.95
|
+0.69
2.84% |
$24.99
|
177,543
63.86% of 50 DAV
50 DAV is 278,000
|
$26.68
-6.48%
|
9/13/2019
|
$19.68
|
PP = $19.84
|
|
MB = $20.83
|
Most Recent Note - 1/6/2020 5:50:56 PM
G - Suffered a large loss today with above average volume indicative of distributional pressure. Extended from the previously noted base. Its 50 DMA line ($23.33) defines support above with prior highs in the $22 area. Fundamentals remain strong. See the latest FSU analysis for more details and a new annotated graph.
>>> FEATURED STOCK ARTICLE : Large Loss With Higher Volume Indicates Distributional Pressure - 1/6/2020 |
View all notes |
Set NEW NOTE alert |
Company Profile |
SEC
News |
Chart |
Request a new note
C
A
S
I |
Symbol/Exchange
Company Name
Industry Group |
PRICE |
CHANGE
(%Change) |
Day High |
Volume
(% DAV)
(% 50 day avg vol) |
52 Wk Hi
% From Hi |
Featured
Date |
Price
Featured |
Pivot Featured |
|
Max Buy |
CHDN
-
NASDAQ
Churchill Downs Inc
LEISURE - Gaming Activities
|
$134.18
|
-0.23
-0.17% |
$135.11
|
136,688
53.39% of 50 DAV
50 DAV is 256,000
|
$138.17
-2.89%
|
10/8/2019
|
$129.77
|
PP = $132.83
|
|
MB = $139.47
|
Most Recent Note - 1/6/2020 5:53:44 PM
G - Pulled back for a 4th consecutive loss today with lighter volume while still hovering near its 52-week high. Its 50 DMA line ($130.98) defines near-term support above the prior low ($121.81 on 11/07/19) The Jun and Sep '19 quarterly earnings versus the year ago periods were both below the +25% minimum guideline (C criteria) and raised fundamental concerns.
>>> FEATURED STOCK ARTICLE : Touched a New HIgh With Gains Backed by Light Volume - 12/30/2019 |
View all notes |
Set NEW NOTE alert |
Company Profile |
SEC
News |
Chart |
Request a new note
C
A
S
I |
LULU
-
NASDAQ
Lululemon Athletica
MANUFACTURING - Textile Manufacturing
|
$233.70
|
-1.73
-0.73% |
$236.85
|
1,367,722
67.58% of 50 DAV
50 DAV is 2,024,000
|
$235.53
-0.78%
|
9/6/2019
|
$201.25
|
PP = $194.35
|
|
MB = $204.07
|
Most Recent Note - 1/6/2020 5:59:08 PM
G - Inched to a new high with today's gain backed by light volume, getting more extended from any sound base. Its 50 DMA line ($219.30) and prior low ($218.18 on 12/12/19) define important near-term support to watch. Recently reported earnings +28% on +23% sales revenues for the Oct '19 quarter.
>>> FEATURED STOCK ARTICLE : Retreated From High After Another Strong Earnings Report - 12/17/2019 |
View all notes |
Set NEW NOTE alert |
Company Profile |
SEC
News |
Chart |
Request a new note
C
A
S
I |
CPRT
-
NASDAQ
Copart Inc
SPECIALTY RETAIL - Auto Dealerships
|
$93.37
|
-0.12
-0.13% |
$93.56
|
1,792,909
98.24% of 50 DAV
50 DAV is 1,825,000
|
$93.63
-0.28%
|
1/2/2020
|
$92.80
|
PP = $92.51
|
|
MB = $97.14
|
 Most Recent Note - 1/7/2020 5:52:57 PM
Y - Posted a gain on for a new all-time high on 1/02/20 with +45% above average volume to trigger a proper new (or add-on) technical buy signal, clearing the pivot point cited based on its 11/25/19 high plus 10 cents. Its 50 DMA line ($87.51) defines near-term support. Fundamentals remain strong. See the latest FSU analysis for more details and a new annotated graph.
>>> FEATURED STOCK ARTICLE : Perched at All-Time HIgh Following Recent Volume-Driven Gain - 1/7/2020 |
View all notes |
Set NEW NOTE alert |
Company Profile |
SEC
News |
Chart |
Request a new note
C
A
S
I |
NMIH
-
NASDAQ
N M I Holdings Inc Cl A
Finance-MrtgandRel Svc
|
$31.78
|
-0.43
-1.33% |
$32.42
|
431,326
84.24% of 50 DAV
50 DAV is 512,000
|
$35.79
-11.20%
|
11/8/2019
|
$32.89
|
PP = $31.44
|
|
MB = $33.01
|
Most Recent Note - 1/2/2020 12:22:27 PM
G - Violating its 50 DMA line ($32.46) with today's loss on higher volume raising concerns. Only a prompt rebound would help its outlook improve. Prior highs in the $30-31 area define the next important near-term support. Fundamentals remain strong.
>>> FEATURED STOCK ARTICLE : Hit New High But Encountered Distributional Pressure - 12/19/2019 |
View all notes |
Set NEW NOTE alert |
Company Profile |
SEC
News |
Chart |
Request a new note
C
A
S
I |
SPLK
-
NASDAQ
Splunk Inc
Computer Sftwr-Database
|
$153.41
|
-1.05
-0.68% |
$155.72
|
1,928,834
97.96% of 50 DAV
50 DAV is 1,969,000
|
$154.62
-0.78%
|
11/25/2019
|
$147.79
|
PP = $142.16
|
|
MB = $149.27
|
Most Recent Note - 1/6/2020 6:03:28 PM
G - Color code is changed to green after rallying back above its "max buy" level and hitting a new all-time high with light volume behind today's 4th consecutive gain. Prior highs in the $142-143 area define initial support to watch on pullbacks.
>>> FEATURED STOCK ARTICLE : Consolidating Above Prior Highs Following Impressive Rally - 12/16/2019 |
View all notes |
Set NEW NOTE alert |
Company Profile |
SEC
News |
Chart |
Request a new note
C
A
S
I |
Symbol/Exchange
Company Name
Industry Group |
PRICE |
CHANGE
(%Change) |
Day High |
Volume
(% DAV)
(% 50 day avg vol) |
52 Wk Hi
% From Hi |
Featured
Date |
Price
Featured |
Pivot Featured |
|
Max Buy |
PAYC
-
NYSE
Paycom Software Inc
COMPUTER SOFTWARE and SERVICES - Application Software
|
$279.49
|
+1.40
0.50% |
$282.60
|
447,380
82.39% of 50 DAV
50 DAV is 543,000
|
$279.95
-0.16%
|
11/20/2019
|
$252.97
|
PP = $259.81
|
|
MB = $272.80
|
Most Recent Note - 1/6/2020 6:01:52 PM
G - Posted a 4th consecutive gain with light volume. Color code is changed to green after rising above its "max buy" level. Fundamentals remain strong.
>>> FEATURED STOCK ARTICLE : Perched Near High and Near the Max Buy Level - 1/3/2020 |
View all notes |
Set NEW NOTE alert |
Company Profile |
SEC
News |
Chart |
Request a new note
C
A
S
I |
BLD
-
NYSE
Topbuild Corp
Bldg-Constr Prds/Misc
|
$104.72
|
+0.21
0.20% |
$106.25
|
198,551
67.08% of 50 DAV
50 DAV is 296,000
|
$113.74
-7.93%
|
12/9/2019
|
$109.71
|
PP = $113.84
|
|
MB = $119.53
|
Most Recent Note - 1/6/2020 5:52:03 PM
G - Still quietly lingering below its 50 DMA line. A rebound above its 50 DMA line ($106.11) is needed for its outlook to improve.
>>> FEATURED STOCK ARTICLE : Recent Slump Below 50-Day Moving Average Did Technical Damage - 12/24/2019 |
View all notes |
Set NEW NOTE alert |
Company Profile |
SEC
News |
Chart |
Request a new note
C
A
S
I |
GLOB
-
NYSE
Globant SA
Computer-Tech Services
|
$109.18
|
+1.54
1.43% |
$109.99
|
179,545
66.75% of 50 DAV
50 DAV is 269,000
|
$112.33
-2.80%
|
11/14/2019
|
$106.87
|
PP = $112.43
|
|
MB = $118.05
|
Most Recent Note - 1/2/2020 4:06:28 PM
Y - Color code is changed to yellow while perched only -4.1% off its 52-week high. Subsequent gains above the pivot point backed by at least +40% above average volume are needed to trigger a technical buy signal. Its 50 DMA line ($100.65) defines important near-term support to watch on pullbacks. Fundamentals remain strong.
>>> FEATURED STOCK ARTICLE : Rebound Has Globant Perched Within Striking Distance of High - 12/26/2019 |
View all notes |
Set NEW NOTE alert |
Company Profile |
SEC
News |
Chart |
Request a new note
C
A
S
I |
|
|
|
THESE ARE NOT BUY RECOMMENDATIONS!
Comments contained in the body of this report are technical
opinions only. The material herein has been obtained
from sources believed to be reliable and accurate, however,
its accuracy and completeness cannot be guaranteed.
This site is not an investment advisor, hence it does
not endorse or recommend any securities or other investments.
Any recommendation contained in this report may not
be suitable for all investors and it is not to be deemed
an offer or solicitation on our part with respect to
the purchase or sale of any securities. All trademarks,
service marks and trade names appearing in this report
are the property of their respective owners, and are
likewise used for identification purposes only.
This report is a service available
only to active Paid Premium Members.
You may opt-out of receiving report notifications
at any time. Questions or comments may be submitted
by writing to Premium Membership Services 665 S.E. 10 Street, Suite 201 Deerfield Beach, FL 33441-5634 or by calling 1-800-965-8307
or 954-785-1121.
|
|
|