You are not logged in.
This means you
CAN ONLY VIEW reports that were published prior to Monday, April 14, 2025.
You
MUST UPGRADE YOUR MEMBERSHIP if you want to see any current reports.
AFTER MARKET UPDATE - THURSDAY, JANUARY 5TH, 2012
Previous After Market Report Next After Market Report >>>
|
|
|
|
DOW |
-2.72 |
12,415.70 |
-0.02% |
|
Volume |
828,793,780 |
+9% |
|
Volume |
1,795,424,320 |
+10% |
|
NASDAQ |
+21.50 |
2,669.86 |
+0.81% |
|
Advancers |
1,836 |
59% |
|
Advancers |
1,536 |
58% |
|
S&P 500 |
+3.76 |
1,281.06 |
+0.29% |
|
Decliners |
1,189 |
38% |
|
Decliners |
977 |
37% |
|
Russell 2000 |
+5.01 |
752.29 |
+0.67% |
|
52 Wk Highs |
98 |
|
|
52 Wk Highs |
42 |
|
|
S&P 600 |
+3.03 |
421.51 |
+0.72% |
|
52 Wk Lows |
11 |
|
|
52 Wk Lows |
25 |
|
|
 |
Major Averages Overcame Early Weakness
Kenneth J. Gruneisen - Passed the CAN SLIM® Master's Exam
On Thursday stocks erased early losses and the major indices ended the session mostly higher as financial and technology shares gained. The volume totals were reported higher on the NYSE and on the Nasdaq exchange, hinting that institutional investors were accumulating shares. Breadth was positive as advancers led decliners by a 3-2 margin on the NYSE and on the Nasdaq exchange. New 52-week highs outnumbered new 52-week lows on the NYSE and on the Nasdaq exchange. There were 35 high-ranked companies from the CANSLIM.net Leaders List that made new 52-week highs and appeared on the CANSLIM.net BreakOuts Page, up from the prior session total of 21 stocks. There were gains for 11 of the 17 high-ranked companies currently included on the Featured Stocks Page.
Equities were under pressure after disappointing profit forecasts from U.S. retailers and concerns over Europe's debt crisis. This offset improving jobs data as private payrolls topped estimates by increasing 325,000 last month and applications for jobless benefits decreased 15,000 last week to 372,000. This positive data was overshadowed as retailers reported largely weaker than expected December same-store-sales results. Meanwhile in Europe, France saw its borrowing costs rise in its first debt auction of the year. UniCredit SpA retreated for a second day after Italy's biggest bank announced plans to hold a rights offer to boost capital. Also, Greece's Prime Minister said that if deeper cuts in incomes are not enacted an economic collapse could come as soon as March.
J.C. Penney Co Inc (JCP -2.69%) and Target Corp (TGT -2.98%) lost ground after both cut their fourth-quarter earnings forecasts. Despite these events, stocks pared losses as banks helped the market recover. Citigroup Inc (C +1.21%) , JP Morgan Chase & Co (JPM +2.09%), and SunTrust Banks Inc (STI +5.36%) rallied after Deutsche Bank AG (DB -6.21%) named all companies as "top picks."
The action in leading stocks listed on the the Featured Stocks Page has brought more breakdowns than breakouts in recent weeks, raising questions about the health of the current market uptrend. Keep an eye on the number of high-ranked leaders hitting the BreakOuts Page in the days ahead to help yourself determine whether leadership is expanding again or contracting.
The market (M criteria) is currently in a confirmed uptrend, which means that disciplined investors' odds are considered favorable for accumulating shares of sound buy candidates in the days ahead. If that stance changes (M criteria) it will be noted in this daily commentary which all members should read regularly. We appreciate any feedback members may wish to send via the inquiry form here.
The Q4 2011 CANSLIM.net Webcast aired on Wednesday, December 28th at 8PM EST and is now available "ON DEMAND" to all upgraded members at no additional cost. Via the Premium Member Homepage links to all prior reports and webcasts are always available.
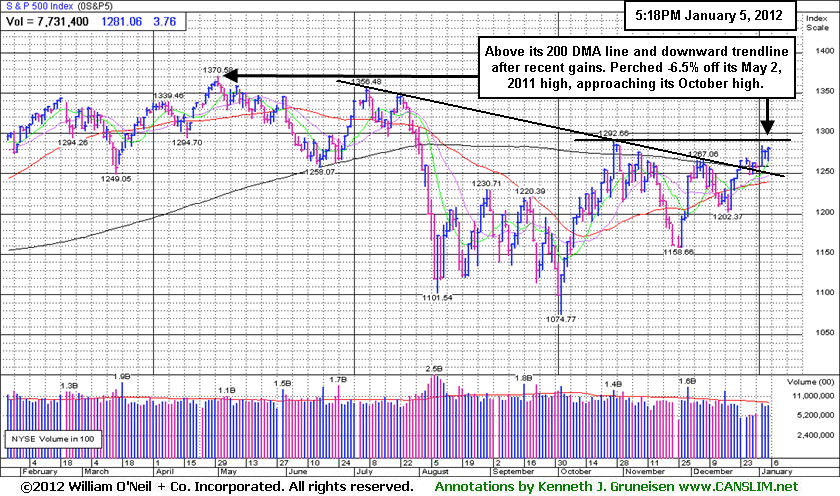
PICTURED: The S&P 500 Index is above its 200-day moving average (DMA) line and above a downward trendline after recent gains. It finished perched -6.5% off its May 2, 2011 high.
|
 Kenneth J. Gruneisen started out as a licensed stockbroker in August 1987, a couple of months prior to the historic stock market crash that took the Dow Jones Industrial Average down -22.6% in a single day. He has published daily fact-based fundamental and technical analysis on high-ranked stocks online for two decades. Through FACTBASEDINVESTING.COM, Kenneth provides educational articles, news, market commentary, and other information regarding proven investment systems that work in good times and bad.
Comments contained in the body of this report are technical opinions only and are not necessarily those of Gruneisen Growth Corp. The material herein has been obtained from sources believed to be reliable and accurate, however, its accuracy and completeness cannot be guaranteed. Our firm, employees, and customers may effect transactions, including transactions contrary to any recommendation herein, or have positions in the securities mentioned herein or options with respect thereto. Any recommendation contained in this report may not be suitable for all investors and it is not to be deemed an offer or solicitation on our part with respect to the purchase or sale of any securities. |
|
 |
Medical Related Shares Led Gainers
Kenneth J. Gruneisen - Passed the CAN SLIM® Master's Exam
The Biotechnology Index ($BTK +3.36%) was a standout gainer and the Healthcare Index ($HMO +1.89%) also posted a healthy gain on a good day for medical-related shares. Financial shares showed resilience after early weakness and the Bank Index ($BKX +2.21%) and Broker/Dealer Index ($XBD +1.23%) helped to underpin the major averages' gains on Thursday. The Retail Index ($RLX +0.38%) and the tech sector showed a positive bias as the Semiconductor Index ($SOX +1.49%), Networking Index ($NWX +0.45%), and Internet Index ($IIX +0.57%) posted small gains. Meanwhile commodity-linked groups were laggards as the Integrated Oil Index ($XOI -0.86%) and Oil Services Index ($OSX -0.78%) lost ground and the Gold & Silver Index ($XAU -0.17%) edged lower.
Charts courtesy www.stockcharts.com
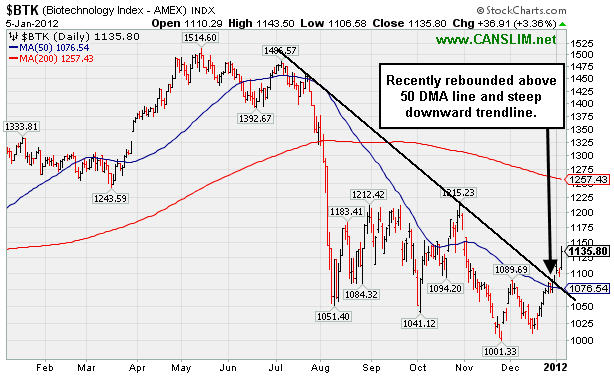
PICTURED: The Biotechnology Index ($BTK +3.36%) recently rebounded above its 50 DMA line and steep downward trendline.
| Oil Services |
$OSX |
222.69 |
-1.74 |
-0.78% |
-9.15% |
| Healthcare |
$HMO |
2,366.41 |
+43.86 |
+1.89% |
+39.86% |
| Integrated Oil |
$XOI |
1,253.94 |
-10.85 |
-0.86% |
+3.36% |
| Semiconductor |
$SOX |
374.17 |
+5.51 |
+1.49% |
-9.14% |
| Networking |
$NWX |
216.59 |
+0.97 |
+0.45% |
-22.80% |
| Internet |
$IIX |
288.03 |
+1.62 |
+0.57% |
-6.40% |
| Broker/Dealer |
$XBD |
86.83 |
+1.06 |
+1.23% |
-28.54% |
| Retail |
$RLX |
531.06 |
+1.99 |
+0.38% |
+4.46% |
| Gold & Silver |
$XAU |
189.02 |
-0.32 |
-0.17% |
-16.58% |
| Bank |
$BKX |
41.71 |
+0.90 |
+2.21% |
-20.11% |
| Biotech |
$BTK |
1,135.80 |
+36.91 |
+3.36% |
-12.47% |
|
|
|
 |
Sell Signal Triggered by Violation of 50-Day Average on Higher Volume
Kenneth J. Gruneisen - Passed the CAN SLIM® Master's Exam
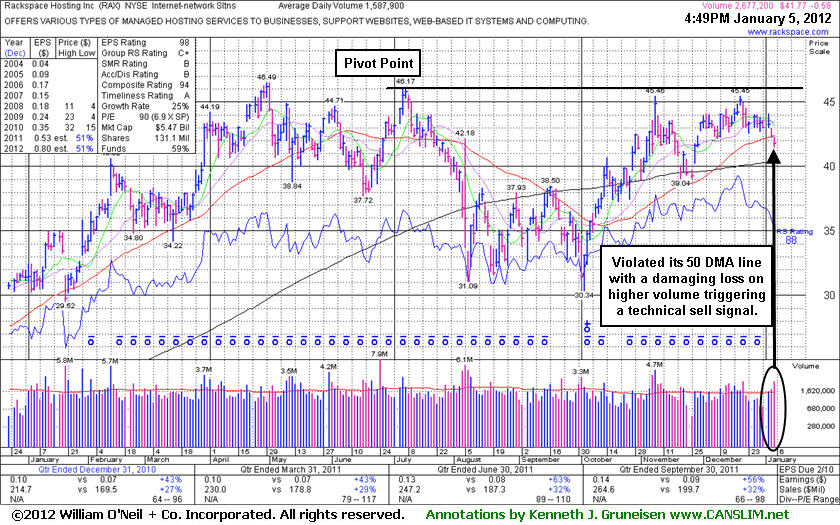
Rackspace Hosting Inc (RAX -$0.58 or -1.37% to $41.77) was down today with higher volume while violating its 50-day moving average (DMA) line, triggering a technical sell signal and sinking to 5-week lows. Recently its color code was changed to green based on weak action that was noted as - "Indicative of distributional pressure after not making headway above its pivot point."
Following its last appearance in this FSU section was on 12/07/11 with an annotated weekly graph under the headline, "Little Resistance Remains But Proof of Fresh Demand is Needed", it wedged higher without especially great volume conviction and it challenged previously stubborn resistance. However, it failed to attract heavy buying demand while perched within close striking distance of its 52-week and all-time high. Obviously, a volume-driven gain did not trigger a technical buy signal. Cautionary comments had warned members - "Disciplined investors should watch for it to first prove that there is truly strong buying demand lurking from institutional investors, otherwise a sustained and meaningful advance is considered unlikely."
The past 7 quarterly earnings comparisons through September '11 have shown better than +25% increases. Its annual earnings history (A criteria) since trading began in 2008 has been good. Increasing institutional ownership (I criteria) is a reassuring sign, as the number of top-rated funds owning its shares rose from 408 in Dec '10 to 479 in Sep '11.
A prompt repair of its 50 DMA violation would help its outlook, meanwhile the path of least resistance could lead it toward its 200 DMA line and prior chart lows which define the next near-term support areas to watch.
|
|
|
Color Codes Explained :
Y - Better candidates highlighted by our
staff of experts.
G - Previously featured
in past reports as yellow but may no longer be buyable under the
guidelines.
***Last / Change / Volume data in this table is the closing quote data***
Symbol/Exchange
Company Name
Industry Group |
PRICE |
CHANGE
(%Change) |
Day High |
Volume
(% DAV)
(% 50 day avg vol) |
52 Wk Hi
% From Hi |
Featured
Date |
Price
Featured |
Pivot Featured |
|
Max Buy |
ADS
-
NYSE
Alliance Data Sys Corp
COMPUTER SOFTWARE and SERVICES - Information and Delivery Service
|
$102.54
|
+1.60
1.59% |
$103.33
|
961,206
129.77% of 50 DAV
50 DAV is 740,700
|
$107.33
-4.46%
|
10/21/2011
|
$97.94
|
PP = $101.15
|
|
MB = $106.21
|
 Most Recent Note - 1/5/2012 2:25:56 PM
Y - Up today, finding prompt support near its 50 DMA line after enduring distributional pressure this week. It remains perched within close striking distance of its all-time high. However, a subsequent violation of the 1/04/12 session low ($100.42) would raise greater concerns and trigger a technical sell signal.
>>> The latest Featured Stock Update with an annotated graph appeared on 12/14/2011. Click here.
View all notes |
Alert me of new notes |
CANSLIM.net Company Profile |
SEC |
Zacks Reports |
StockTalk |
News |
Chart |
Request a new note
C
A N
S L
I M


|
ALXN
-
NASDAQ
Alexion Pharmaceuticals
DRUGS - Drug Manufacturers - Other
|
$72.41
|
+2.12
3.02% |
$73.05
|
1,462,991
125.66% of 50 DAV
50 DAV is 1,164,200
|
$72.67
-0.36%
|
11/30/2011
|
$68.66
|
PP = $70.52
|
|
MB = $74.05
|
Most Recent Note - 1/5/2012 12:22:50 PM
Y - Rising near its all-time high today with volume running at a slightly above average pace. A strong gain above its pivot point with at least +40% above average volume may clinch a new technical buy signal. Its 50 DMA line defines near-term support above prior lows in the $62 area.
>>> The latest Featured Stock Update with an annotated graph appeared on 12/12/2011. Click here.
View all notes |
Alert me of new notes |
CANSLIM.net Company Profile |
SEC |
Zacks Reports |
StockTalk |
News |
Chart |
Request a new note
C
A N
S L
I M
|
CATM
-
NASDAQ
Cardtronics Inc
DIVERSIFIED SERVICES - Business/Management Services
|
$26.83
|
+0.00
0.00% |
$27.20
|
267,910
77.68% of 50 DAV
50 DAV is 344,900
|
$28.74
-6.65%
|
12/23/2011
|
$28.64
|
PP = $28.56
|
|
MB = $29.99
|
Most Recent Note - 1/4/2012 8:15:08 PM
Y - Consolidating just above its 50 DMA line that defines important chart support to watch. As previously noted, "The gain on 12/23/11 was backed by +77% above average volume and it touched a new 52-week high, but it did not close above the new pivot point cited based on its 11/08/11 high plus 10 cents."
>>> The latest Featured Stock Update with an annotated graph appeared on 12/23/2011. Click here.
View all notes |
Alert me of new notes |
CANSLIM.net Company Profile |
SEC |
Zacks Reports |
StockTalk |
News |
Chart |
Request a new note
C
A N
S L
I M
|
CELG
-
NASDAQ
Celgene Corp
DRUGS - Drug Manufacturers - Major
|
$68.51
|
+0.59
0.87% |
$69.26
|
3,335,713
100.69% of 50 DAV
50 DAV is 3,312,800
|
$68.97
-0.66%
|
12/20/2011
|
$66.68
|
PP = $68.35
|
|
MB = $71.77
|
Most Recent Note - 1/5/2012 4:32:21 PM
Y - Touched a new 52-week high today and finished at its second-best close with a gain on average volume. Subsequent volume-driven gains above the pivot point may trigger a new (or add-on) technical buy signal.
>>> The latest Featured Stock Update with an annotated graph appeared on 12/29/2011. Click here.
View all notes |
Alert me of new notes |
CANSLIM.net Company Profile |
SEC |
Zacks Reports |
StockTalk |
News |
Chart |
Request a new note
C
A N
S L
I M
|
FEIC
-
NASDAQ
F E I Co
ELECTRONICS - Diversified Electronics
|
$41.53
|
+0.70
1.71% |
$41.63
|
343,215
98.54% of 50 DAV
50 DAV is 348,300
|
$43.00
-3.42%
|
12/7/2011
|
$41.41
|
PP = $42.35
|
|
MB = $44.47
|
Most Recent Note - 1/5/2012 4:34:53 PM
Y - Overcame early weakness today and managed a "positive reversal" for a gain on average volume. Still hovering near its all-time high, meanwhile, its nearby 50 DMA line defines chart support above prior lows in the $36 area. Disciplined investors would still be watching for a volume-driven gain above the pivot point to trigger a proper technical buy signal.
>>> The latest Featured Stock Update with an annotated graph appeared on 12/21/2011. Click here.
View all notes |
Alert me of new notes |
CANSLIM.net Company Profile |
SEC |
Zacks Reports |
StockTalk |
News |
Chart |
Request a new note
C
A N
S L
I M
|
Symbol/Exchange
Company Name
Industry Group |
PRICE |
CHANGE
(%Change) |
Day High |
Volume
(% DAV)
(% 50 day avg vol) |
52 Wk Hi
% From Hi |
Featured
Date |
Price
Featured |
Pivot Featured |
|
Max Buy |
GNC
-
NYSE
G N C Holdings Inc
RETAIL - Drug Stores
|
$28.50
|
-0.23
-0.80% |
$28.69
|
819,651
52.13% of 50 DAV
50 DAV is 1,572,400
|
$29.50
-3.39%
|
10/26/2011
|
$24.60
|
PP = $24.80
|
|
MB = $26.04
|
Most Recent Note - 1/3/2012 6:28:26 PM
G - Encountered mild distributional pressure today while perched near its all-time high. It is extended from its prior base pattern. Prior chart highs and its 50 DMA line coincide in the $25-26 area defining important support to watch on pullbacks.
>>> The latest Featured Stock Update with an annotated graph appeared on 12/16/2011. Click here.
View all notes |
Alert me of new notes |
CANSLIM.net Company Profile |
SEC |
Zacks Reports |
StockTalk |
News |
Chart |
Request a new note
C
A N
S L
I M
|
HMSY
-
NASDAQ
H M S Holdings Corp
COMPUTER SOFTWARE and SERVICES - Healthcare Information Service
|
$31.11
|
+0.02
0.06% |
$31.27
|
536,860
49.79% of 50 DAV
50 DAV is 1,078,300
|
$32.83
-5.24%
|
10/27/2011
|
$26.44
|
PP = $28.37
|
|
MB = $29.79
|
Most Recent Note - 1/3/2012 6:26:05 PM
G - Touched another new all-time high today and then reversed into the red for a small loss on light volume. No resistance remains, but it is extended from its prior base.
>>> The latest Featured Stock Update with an annotated graph appeared on 12/28/2011. Click here.
View all notes |
Alert me of new notes |
CANSLIM.net Company Profile |
SEC |
Zacks Reports |
StockTalk |
News |
Chart |
Request a new note
C
A N
S L
I M
|
ISRG
-
NASDAQ
Intuitive Surgical Inc
HEALTH SERVICES - Medical Appliances and Equipment
|
$472.36
|
+5.42
1.16% |
$472.63
|
523,206
172.56% of 50 DAV
50 DAV is 303,200
|
$474.50
-0.45%
|
12/20/2011
|
$442.43
|
PP = $449.16
|
|
MB = $471.62
|
Most Recent Note - 1/5/2012 12:52:42 PM
Y - Perched near its all-time high, holding its ground stubbornly. Previously noted, "Recent gains above its pivot point have lacked the volume needed to trigger a proper new (or add-on) technical buy signal. Important support is defined by its 50 DMA line."
>>> The latest Featured Stock Update with an annotated graph appeared on 12/13/2011. Click here.
View all notes |
Alert me of new notes |
CANSLIM.net Company Profile |
SEC |
Zacks Reports |
StockTalk |
News |
Chart |
Request a new note
C
A N
S L
I M
|
MA
-
NYSE
Mastercard Inc Cl A
DIVERSIFIED SERVICES - Business/Management Services
|
$352.41
|
-3.69
-1.04% |
$355.63
|
1,474,375
146.24% of 50 DAV
50 DAV is 1,008,200
|
$384.99
-8.46%
|
1/3/2012
|
$367.87
|
PP = $385.09
|
|
MB = $404.34
|
Most Recent Note - 1/4/2012 1:00:49 PM
G - Violated its 50 DMA line today while another damaging loss is raising concerns, and its color code is changed to green while now encountering distributional pressure after building a riskier late-stage base. Only a prompt rebound above its short-term average would help its outlook. The 1/03/12 mid-day report (read here) cited a new pivot point based on its 52-week high plus 10 cents. Quarterly and annual earnings history makes it a good match with the C and A criteria. See the latest FSU analysis for an annotated weekly graph.
>>> The latest Featured Stock Update with an annotated graph appeared on 1/3/2012. Click here.
View all notes |
Alert me of new notes |
CANSLIM.net Company Profile |
SEC |
Zacks Reports |
StockTalk |
News |
Chart |
Request a new note
C
A N
S L
I M
|
MG
-
NYSE
Mistras Group Inc
DIVERSIFIED SERVICES - Bulding and Faci;ity Management Services
|
$23.87
|
-0.29
-1.20% |
$24.23
|
194,529
144.31% of 50 DAV
50 DAV is 134,800
|
$26.24
-9.03%
|
10/28/2011
|
$22.49
|
PP = $23.61
|
|
MB = $24.79
|
Most Recent Note - 1/3/2012 6:19:42 PM
G - Touched a new high today, but ended with a loss and closed near the session low after a negative reversal. The distributional session led to a dip below its "max buy" level. Prior highs in the $23 area define chart support along with its 50 DMA line.
>>> The latest Featured Stock Update with an annotated graph appeared on 12/8/2011. Click here.
View all notes |
Alert me of new notes |
CANSLIM.net Company Profile |
SEC |
Zacks Reports |
StockTalk |
News |
Chart |
Request a new note
C
A N
S L
I M
|
Symbol/Exchange
Company Name
Industry Group |
PRICE |
CHANGE
(%Change) |
Day High |
Volume
(% DAV)
(% 50 day avg vol) |
52 Wk Hi
% From Hi |
Featured
Date |
Price
Featured |
Pivot Featured |
|
Max Buy |
MKTX
-
NASDAQ
Marketaxess Holdings Inc
FINANCIAL SERVICES - Investment Brokerage - Nationa
|
$31.10
|
+1.09
3.63% |
$31.12
|
220,955
105.27% of 50 DAV
50 DAV is 209,900
|
$31.59
-1.55%
|
10/28/2011
|
$29.79
|
PP = $31.05
|
|
MB = $32.60
|
Most Recent Note - 1/5/2012 4:38:35 PM
Y - Finished near the session high with a solid gain today on average volume. Perched within close striking distance of its previously cited pivot point and near all-time highs. The 50 DMA line defines initial chart support to watch.
>>> The latest Featured Stock Update with an annotated graph appeared on 12/20/2011. Click here.
View all notes |
Alert me of new notes |
CANSLIM.net Company Profile |
SEC |
Zacks Reports |
StockTalk |
News |
Chart |
Request a new note
C
A N
S L
I M
|
OSIS
-
NASDAQ
O S I Systems Inc
ELECTRONICS - Semiconductor Equipment and Mate
|
$49.87
|
+0.12
0.24% |
$50.40
|
61,195
55.78% of 50 DAV
50 DAV is 109,700
|
$50.50
-1.25%
|
11/1/2011
|
$42.07
|
PP = $45.57
|
|
MB = $47.85
|
Most Recent Note - 1/5/2012 4:41:31 PM
G - Wedged higher with today's 3rd consecutive small gain on below average volume for a best-ever close. Extended from its prior base. Its 50 DMA line and recent chart lows near $45 define important near-term support to watch.
>>> The latest Featured Stock Update with an annotated graph appeared on 12/27/2011. Click here.
View all notes |
Alert me of new notes |
CANSLIM.net Company Profile |
SEC |
Zacks Reports |
StockTalk |
News |
Chart |
Request a new note
C
A N
S L
I M
|
PRGO
-
NASDAQ
Perrigo Co
DRUGS - Drug Related Products
|
$96.15
|
+1.06
1.11% |
$96.44
|
995,030
72.54% of 50 DAV
50 DAV is 1,371,700
|
$104.70
-8.17%
|
12/9/2011
|
$99.54
|
PP = $101.56
|
|
MB = $106.64
|
Most Recent Note - 1/4/2012 8:03:11 PM
G - Down again today on below average volume, closing just below its 50 DMA line, raising concerns. Its color code is changed to green based on its deterioration, meanwhile a prompt rebound is needed for its outlook to improve.
>>> The latest Featured Stock Update with an annotated graph appeared on 12/9/2011. Click here.
View all notes |
Alert me of new notes |
CANSLIM.net Company Profile |
SEC |
Zacks Reports |
StockTalk |
News |
Chart |
Request a new note
C
A N
S L
I M
|
RAX
-
NYSE
Rackspace Hosting Inc
INTERNET - Internet Software and; Services
|
$41.77
|
-0.58
-1.37% |
$42.30
|
2,677,552
168.62% of 50 DAV
50 DAV is 1,587,900
|
$46.50
-10.16%
|
11/8/2011
|
$44.28
|
PP = $46.27
|
|
MB = $48.58
|
Most Recent Note - 1/5/2012 5:53:30 PM
G - Down today with higher volume while violating its 50 DMA line, triggering a technical sell signal and sinking to 5-week lows. Color code was changed to green based on weak action that is indicative of distributional pressure after not making headway above its pivot point. See the latest FSU analysis for more details and a new annotated graph.
>>> The latest Featured Stock Update with an annotated graph appeared on 1/5/2012. Click here.
View all notes |
Alert me of new notes |
CANSLIM.net Company Profile |
SEC |
Zacks Reports |
StockTalk |
News |
Chart |
Request a new note
C
A N
S L
I M
|
TDG
-
NYSE
Transdigm Group Inc
AEROSPACE/DEFENSE - Aerospace/Defense Products and; Services
|
$95.19
|
+2.06
2.21% |
$95.49
|
417,248
116.68% of 50 DAV
50 DAV is 357,600
|
$102.73
-7.34%
|
11/9/2011
|
$98.45
|
PP = $95.14
|
|
MB = $99.90
|
Most Recent Note - 1/5/2012 4:47:05 PM
G - Promptly rebounded above its 50 DMA line today with a solid gain on higher volume, and its finish near the session high was an encouraging sign of support. Its prior loss on more than 2 times average volume triggered a technical sell signal. Recent lows in the $90 area define the next nearby support level to watch. See latest FSU analysis for more details and a new annotated graph.
>>> The latest Featured Stock Update with an annotated graph appeared on 1/4/2012. Click here.
View all notes |
Alert me of new notes |
CANSLIM.net Company Profile |
SEC |
Zacks Reports |
StockTalk |
News |
Chart |
Request a new note
C
A N
S L
I M
|
Symbol/Exchange
Company Name
Industry Group |
PRICE |
CHANGE
(%Change) |
Day High |
Volume
(% DAV)
(% 50 day avg vol) |
52 Wk Hi
% From Hi |
Featured
Date |
Price
Featured |
Pivot Featured |
|
Max Buy |
V
-
NYSE
Visa Inc Cl A
DIVERSIFIED SERVICES - Business/Management Services
|
$101.91
|
+0.76
0.75% |
$102.21
|
3,023,116
73.56% of 50 DAV
50 DAV is 4,109,700
|
$103.45
-1.49%
|
10/24/2011
|
$94.21
|
PP = $94.85
|
|
MB = $99.59
|
Most Recent Note - 1/5/2012 4:29:22 PM
G - Overcame early weakness and managed a positive reversal today for a small gain on below average volume. It is extended from its prior base and trading above its "max buy" level. Prior highs in the $95 area and its 50 DMA line define chart support to watch on pullbacks.
>>> The latest Featured Stock Update with an annotated graph appeared on 12/15/2011. Click here.
View all notes |
Alert me of new notes |
CANSLIM.net Company Profile |
SEC |
Zacks Reports |
StockTalk |
News |
Chart |
Request a new note
C
A N
S L
I M
|
|
|
|
THESE ARE NOT BUY RECOMMENDATIONS!
Comments contained in the body of this report are technical
opinions only. The material herein has been obtained
from sources believed to be reliable and accurate, however,
its accuracy and completeness cannot be guaranteed.
This site is not an investment advisor, hence it does
not endorse or recommend any securities or other investments.
Any recommendation contained in this report may not
be suitable for all investors and it is not to be deemed
an offer or solicitation on our part with respect to
the purchase or sale of any securities. All trademarks,
service marks and trade names appearing in this report
are the property of their respective owners, and are
likewise used for identification purposes only.
This report is a service available
only to active Paid Premium Members.
You may opt-out of receiving report notifications
at any time. Questions or comments may be submitted
by writing to Premium Membership Services 665 S.E. 10 Street, Suite 201 Deerfield Beach, FL 33441-5634 or by calling 1-800-965-8307
or 954-785-1121.
|
|
|

