You are not logged in.
This means you
CAN ONLY VIEW reports that were published prior to Wednesday, March 5, 2025.
You
MUST UPGRADE YOUR MEMBERSHIP if you want to see any current reports.
AFTER MARKET UPDATE - WEDNESDAY, JANUARY 4TH, 2012
Previous After Market Report Next After Market Report >>>
|
|
|
|
DOW |
+21.04 |
12,418.42 |
+0.17% |
|
Volume |
759,444,750 |
-11% |
|
Volume |
1,633,035,420 |
+2% |
|
NASDAQ |
-0.36 |
2,648.36 |
-0.01% |
|
Advancers |
1,475 |
47% |
|
Advancers |
969 |
37% |
|
S&P 500 |
+0.24 |
1,277.30 |
+0.02% |
|
Decliners |
1,552 |
50% |
|
Decliners |
1,537 |
59% |
|
Russell 2000 |
-5.00 |
747.28 |
-0.66% |
|
52 Wk Highs |
80 |
|
|
52 Wk Highs |
23 |
|
|
S&P 600 |
-3.07 |
418.48 |
-0.73% |
|
52 Wk Lows |
11 |
|
|
52 Wk Lows |
23 |
|
|
 |
Major Averages Ended Mixed While Leading Stocks Struggled
Kenneth J. Gruneisen - Passed the CAN SLIM® Master's Exam
The major averages finished mixed on Wednesday and the volume totals were also mixed, lighter on the NYSE, but slightly higher on the Nasdaq exchange. Breadth was negative as decliners led advancers narrowly on the NYSE, yet decliners led advancers by a 3-2 margin on the Nasdaq exchange. New 52-week highs solidly outnumbered new 52-week lows on the NYSE, but new highs and lows were evenly matched on the Nasdaq exchange. There were 21 high-ranked companies from the CANSLIM.net Leaders List that made new 52-week highs and appeared on the CANSLIM.net BreakOuts Page, down from the prior session total of 79 stocks. There were gains for only 3 of the 17 high-ranked companies currently included on the Featured Stocks Page, a disconcertingly uglier picture than the broader market's advance/decline numbers painted.
The major averages finished little changed as encouraging retail and auto sales countered concerns European banks may need additional capital. November factory orders rose +1.8%, below the +2.0% consensus estimate.
Retailers advanced after a trade group increased its estimate for December sales. Shares of Coach Inc (COH +2.58%) and Lowe's Companies Inc (LOW +3.72%) rose. The financial indexes recovered from their session lows while Bank of America Corp (BAC +0.17%) erased a -3.1% decline to close up 1 cent to $5.81, and JPM Morgan Chase & Co (JPM +0.63%) erased a -1.2% drop to close higher. Ford Motor Co (F +1.53%) rose after December sales topped analyst projections. Yahoo! Inc (YHOO -3.10%) fell after naming PayPal's Scott Thomson as its new CEO.
The better performance by blue chips indicates a cautious tone in recent weeks, as strength shown by the Dow Industrials contrasts with questionable strength from the Nasdaq Composite Index (which was shown in the prior market commentary - read here). The action in leading stocks listed on the the Featured Stocks Page has also brought more breakdowns than breakouts in recent weeks. Keep an eye on the number of high-ranked leaders hitting the BreakOuts Page in the days ahead to help yourself determine whether leadership is expanding again or contracting.
The market (M criteria) is currently in a confirmed uptrend, which means that disciplined investors' odds are considered favorable for accumulating shares of sound buy candidates in the days ahead. If that stance changes (M criteria) it will be noted in this daily commentary which all members should read regularly. We appreciate any feedback members may wish to send via the inquiry form here.
The Q4 2011 CANSLIM.net Webcast aired on Wednesday, December 28th at 8PM EST and is now available "ON DEMAND" to all upgraded members at no additional cost. Via the Premium Member Homepage links to all prior reports and webcasts are always available.
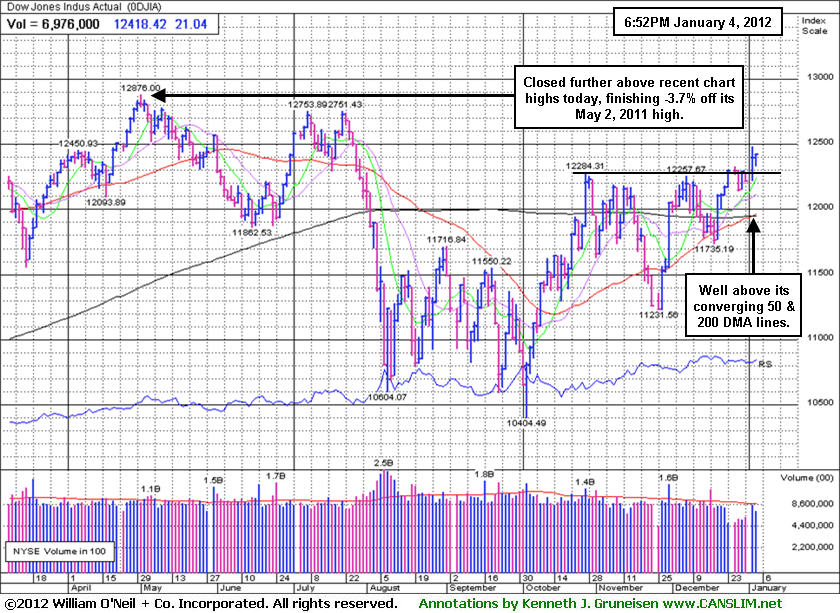
PICTURED: The Dow Jones Industrial Average is well above its converging 50-day and 200-day moving average (DMA) lines. It rose further above its recent chart highs and finished -3.7% off its May 2, 2011 high.
|
 Kenneth J. Gruneisen started out as a licensed stockbroker in August 1987, a couple of months prior to the historic stock market crash that took the Dow Jones Industrial Average down -22.6% in a single day. He has published daily fact-based fundamental and technical analysis on high-ranked stocks online for two decades. Through FACTBASEDINVESTING.COM, Kenneth provides educational articles, news, market commentary, and other information regarding proven investment systems that work in good times and bad.
Comments contained in the body of this report are technical opinions only and are not necessarily those of Gruneisen Growth Corp. The material herein has been obtained from sources believed to be reliable and accurate, however, its accuracy and completeness cannot be guaranteed. Our firm, employees, and customers may effect transactions, including transactions contrary to any recommendation herein, or have positions in the securities mentioned herein or options with respect thereto. Any recommendation contained in this report may not be suitable for all investors and it is not to be deemed an offer or solicitation on our part with respect to the purchase or sale of any securities. |
|
 |
Networking Index Led Tech Sector Lower
Kenneth J. Gruneisen - Passed the CAN SLIM® Master's Exam
Small gains for the Healthcare Index ($HMO +0.43%) and Retail Index ($RLX +0.45%) were the bright spot on Wednesday's session. Financial shares were mixed as the Broker/Dealer Index ($XBD -0.60%) fell and the Bank Index ($BKX +0.34%) rose modestly. The tech sector ended mostly lower, led downward by the Networking Index ($NWX -2.67%) and smaller losses for the Internet Index ($IIX -0.60%) and Biotechnology Index ($BTK -0.49%), meanwhile the Semiconductor Index ($SOX +0.02%) finished flat. Commodity linked groups were quiet as the Gold & Silver Index ($XAU +0.03%) and Oil Services Index ($OSX -0.10%) showed little change and the Integrated Oil Index ($XOI +0.32%) inched higher.
Charts courtesy www.stockcharts.com
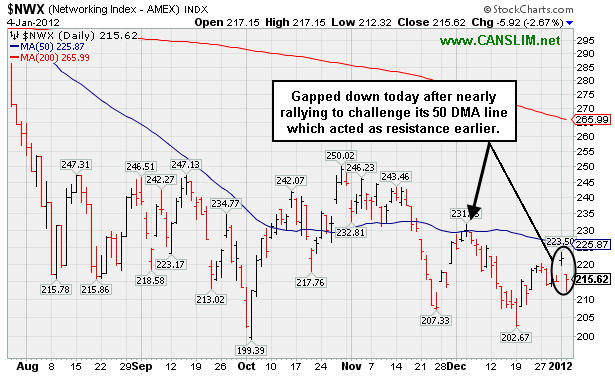
PICTURED: The Networking Index ($NWX -2.67%) gapped down today after rallying to nearly challenge its 50-day moving average (DMA) line which acted as resistance earlier.
|
|
|
 |
Damaging 50-Day Moving Average Violation Raised Concerns
Kenneth J. Gruneisen - Passed the CAN SLIM® Master's Exam
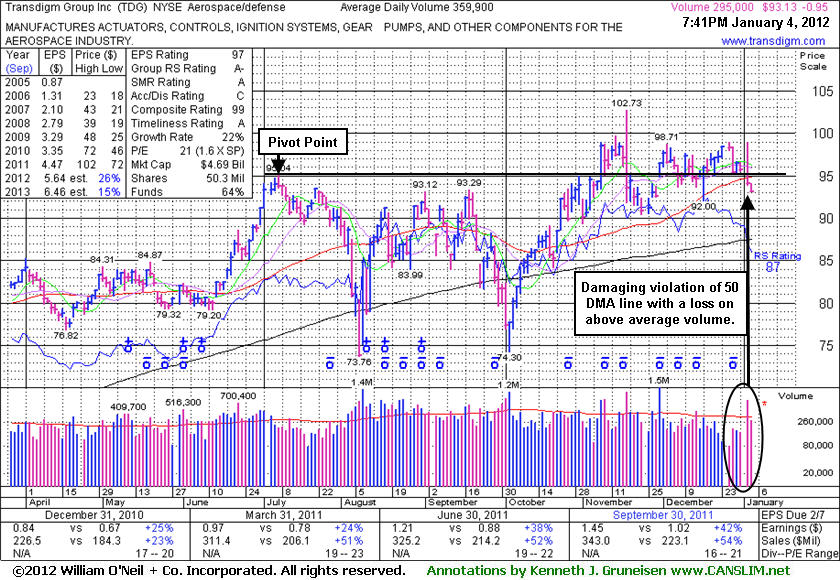
Transdigm Group Inc (TDG -$0.95 or -1.01% to $93.13) slumped even lower today on lighter volume, rather than promptly repairing a damaging 50-day moving average (DMA) line violation. It was noted on the prior session as it erased early gains and violated its 50-day moving average (DMA) line, closing near the session low and raising concerns. Its loss on more than 2 times average volume triggered a technical sell signal, and its color code was changed to green after the worrisome sign of distributional pressure.
It would take a rebound above it 50 DMA line to help its outlook improve, and subsequent gains to new high closes would give it the look of an action-worthy buy candidate. Meanwhile, the path of least resistance may lead it to a deeper consolidation. Prior lows in the $90 define a support area that comes into play before its longer-term 200 DMA line. Its current Up/Down Volume Ratio of 1.2 still hints at near-term accumulation, however that is down from 1.5 while its Accumulation/Distribution rank also slipped to C from a B- when it made its last appearance in this FSU section on 12/06/11 with an annotated graph under the headline, "Little Resistance Remains Due To Overhead Supply."
The number of top-rated funds owning its shares rose from 351 in Dec '10 to 400 in Sep '11, a somewhat reassuring trend concerning the I criteria. as well. Its small supply of only 43.3 millions shares (S criteria) in the public float can also make is a big mover in the event of institutional accumulation or distribution. It reported earnings +42% on +54% sales revenues for the quarter ended September 30, 2011 versus the year ago period. Prior earnings comparisons near or above the +25% guideline and its strong annual earnings history satisfy the C and A criteria. In recent years it had rebounded and rallied to new highs following a deep consolidation after it was dropped from the Featured Stocks list 1/17/08.
|
|
|
Color Codes Explained :
Y - Better candidates highlighted by our
staff of experts.
G - Previously featured
in past reports as yellow but may no longer be buyable under the
guidelines.
***Last / Change / Volume data in this table is the closing quote data***
Symbol/Exchange
Company Name
Industry Group |
PRICE |
CHANGE
(%Change) |
Day High |
Volume
(% DAV)
(% 50 day avg vol) |
52 Wk Hi
% From Hi |
Featured
Date |
Price
Featured |
Pivot Featured |
|
Max Buy |
ADS
-
NYSE
Alliance Data Sys Corp
COMPUTER SOFTWARE and SERVICES - Information and Delivery Service
|
$100.94
|
-1.82
-1.77% |
$102.72
|
1,366,232
182.31% of 50 DAV
50 DAV is 749,400
|
$107.33
-5.95%
|
10/21/2011
|
$97.94
|
PP = $101.15
|
|
MB = $106.21
|
Most Recent Note - 1/3/2012 11:57:42 AM
Y - Churning above average volume today without making meaningful price progress while still perched within close striking distance of its all-time high. Its 50 DMA line defines important near-term chart support.
>>> The latest Featured Stock Update with an annotated graph appeared on 12/14/2011. Click here.
View all notes |
Alert me of new notes |
CANSLIM.net Company Profile |
SEC |
Zacks Reports |
StockTalk |
News |
Chart |
Request a new note
C
A N
S L
I M


|
ALXN
-
NASDAQ
Alexion Pharmaceuticals
DRUGS - Drug Manufacturers - Other
|
$70.29
|
-0.28
-0.40% |
$71.05
|
751,123
63.35% of 50 DAV
50 DAV is 1,185,600
|
$72.67
-3.28%
|
11/30/2011
|
$68.66
|
PP = $70.52
|
|
MB = $74.05
|
 Most Recent Note - 1/4/2012 8:12:51 PM
Y - Quietly hovering near its all-time high, still stubbornly holding its ground, however a strong gain with at least +40% above average volume did not recently clinch a new technical buy signal. Its 50 DMA line defines near-term support above prior lows in the $62 area.
>>> The latest Featured Stock Update with an annotated graph appeared on 12/12/2011. Click here.
View all notes |
Alert me of new notes |
CANSLIM.net Company Profile |
SEC |
Zacks Reports |
StockTalk |
News |
Chart |
Request a new note
C
A N
S L
I M
|
CATM
-
NASDAQ
Cardtronics Inc
DIVERSIFIED SERVICES - Business/Management Services
|
$26.83
|
-0.41
-1.51% |
$27.36
|
311,981
90.51% of 50 DAV
50 DAV is 344,700
|
$28.74
-6.65%
|
12/23/2011
|
$28.64
|
PP = $28.56
|
|
MB = $29.99
|
Most Recent Note - 1/4/2012 8:15:08 PM
Y - Consolidating just above its 50 DMA line that defines important chart support to watch. As previously noted, "The gain on 12/23/11 was backed by +77% above average volume and it touched a new 52-week high, but it did not close above the new pivot point cited based on its 11/08/11 high plus 10 cents."
>>> The latest Featured Stock Update with an annotated graph appeared on 12/23/2011. Click here.
View all notes |
Alert me of new notes |
CANSLIM.net Company Profile |
SEC |
Zacks Reports |
StockTalk |
News |
Chart |
Request a new note
C
A N
S L
I M
|
CELG
-
NASDAQ
Celgene Corp
DRUGS - Drug Manufacturers - Major
|
$67.92
|
-0.74
-1.08% |
$68.93
|
2,678,303
80.63% of 50 DAV
50 DAV is 3,321,900
|
$68.97
-1.52%
|
12/20/2011
|
$66.68
|
PP = $68.35
|
|
MB = $71.77
|
Most Recent Note - 12/29/2011 6:10:32 PM
Y - Perched within close striking distance of its 52-week high. Subsequent volume-driven gains above the pivot point may trigger a new (or add-on) technical buy signal. See the latest FSU analysis for more details and a new annotated graph.
>>> The latest Featured Stock Update with an annotated graph appeared on 12/29/2011. Click here.
View all notes |
Alert me of new notes |
CANSLIM.net Company Profile |
SEC |
Zacks Reports |
StockTalk |
News |
Chart |
Request a new note
C
A N
S L
I M
|
FEIC
-
NASDAQ
F E I Co
ELECTRONICS - Diversified Electronics
|
$40.83
|
-0.58
-1.40% |
$42.49
|
406,139
116.91% of 50 DAV
50 DAV is 347,400
|
$43.00
-5.05%
|
12/7/2011
|
$41.41
|
PP = $42.35
|
|
MB = $44.47
|
Most Recent Note - 12/30/2011 6:16:04 PM
Y - Pulled back with light volume today while hovering near its all-time high. Its 50 DMA line and prior lows in the $36 area define chart support. Disciplined investors would still be watching for a volume-driven gain above the pivot point to trigger a proper technical buy signal.
>>> The latest Featured Stock Update with an annotated graph appeared on 12/21/2011. Click here.
View all notes |
Alert me of new notes |
CANSLIM.net Company Profile |
SEC |
Zacks Reports |
StockTalk |
News |
Chart |
Request a new note
C
A N
S L
I M
|
Symbol/Exchange
Company Name
Industry Group |
PRICE |
CHANGE
(%Change) |
Day High |
Volume
(% DAV)
(% 50 day avg vol) |
52 Wk Hi
% From Hi |
Featured
Date |
Price
Featured |
Pivot Featured |
|
Max Buy |
GNC
-
NYSE
G N C Holdings Inc
RETAIL - Drug Stores
|
$28.73
|
+0.32
1.13% |
$29.19
|
705,126
43.64% of 50 DAV
50 DAV is 1,615,600
|
$29.50
-2.61%
|
10/26/2011
|
$24.60
|
PP = $24.80
|
|
MB = $26.04
|
Most Recent Note - 1/3/2012 6:28:26 PM
G - Encountered mild distributional pressure today while perched near its all-time high. It is extended from its prior base pattern. Prior chart highs and its 50 DMA line coincide in the $25-26 area defining important support to watch on pullbacks.
>>> The latest Featured Stock Update with an annotated graph appeared on 12/16/2011. Click here.
View all notes |
Alert me of new notes |
CANSLIM.net Company Profile |
SEC |
Zacks Reports |
StockTalk |
News |
Chart |
Request a new note
C
A N
S L
I M
|
HMSY
-
NASDAQ
H M S Holdings Corp
COMPUTER SOFTWARE and SERVICES - Healthcare Information Service
|
$31.09
|
-0.17
-0.54% |
$31.47
|
570,420
52.98% of 50 DAV
50 DAV is 1,076,700
|
$32.83
-5.30%
|
10/27/2011
|
$26.44
|
PP = $28.37
|
|
MB = $29.79
|
Most Recent Note - 1/3/2012 6:26:05 PM
G - Touched another new all-time high today and then reversed into the red for a small loss on light volume. No resistance remains, but it is extended from its prior base.
>>> The latest Featured Stock Update with an annotated graph appeared on 12/28/2011. Click here.
View all notes |
Alert me of new notes |
CANSLIM.net Company Profile |
SEC |
Zacks Reports |
StockTalk |
News |
Chart |
Request a new note
C
A N
S L
I M
|
ISRG
-
NASDAQ
Intuitive Surgical Inc
HEALTH SERVICES - Medical Appliances and Equipment
|
$466.94
|
-4.77
-1.01% |
$474.50
|
290,671
94.31% of 50 DAV
50 DAV is 308,200
|
$473.93
-1.47%
|
12/20/2011
|
$442.43
|
PP = $449.16
|
|
MB = $471.62
|
Most Recent Note - 12/29/2011 5:42:08 PM
Y - Up today without great volume conviction, yet rising even further into new all-time high territory. Recent gains above its pivot point have lacked the volume needed to trigger a proper new (or add-on) technical buy signal. Important support is defined by its 50 DMA line.
>>> The latest Featured Stock Update with an annotated graph appeared on 12/13/2011. Click here.
View all notes |
Alert me of new notes |
CANSLIM.net Company Profile |
SEC |
Zacks Reports |
StockTalk |
News |
Chart |
Request a new note
C
A N
S L
I M
|
MA
-
NYSE
Mastercard Inc Cl A
DIVERSIFIED SERVICES - Business/Management Services
|
$356.25
|
-12.12
-3.29% |
$366.74
|
2,285,425
232.61% of 50 DAV
50 DAV is 982,500
|
$384.99
-7.47%
|
1/3/2012
|
$367.87
|
PP = $385.09
|
|
MB = $404.34
|
Most Recent Note - 1/4/2012 1:00:49 PM
G - Violated its 50 DMA line today while another damaging loss is raising concerns, and its color code is changed to green while now encountering distributional pressure after building a riskier late-stage base. Only a prompt rebound above its short-term average would help its outlook. The 1/03/12 mid-day report (read here) cited a new pivot point based on its 52-week high plus 10 cents. Quarterly and annual earnings history makes it a good match with the C and A criteria. See the latest FSU analysis for an annotated weekly graph.
>>> The latest Featured Stock Update with an annotated graph appeared on 1/3/2012. Click here.
View all notes |
Alert me of new notes |
CANSLIM.net Company Profile |
SEC |
Zacks Reports |
StockTalk |
News |
Chart |
Request a new note
C
A N
S L
I M
|
MG
-
NYSE
Mistras Group Inc
DIVERSIFIED SERVICES - Bulding and Faci;ity Management Services
|
$24.16
|
-0.32
-1.31% |
$24.66
|
211,000
153.68% of 50 DAV
50 DAV is 137,300
|
$26.24
-7.93%
|
10/28/2011
|
$22.49
|
PP = $23.61
|
|
MB = $24.79
|
Most Recent Note - 1/3/2012 6:19:42 PM
G - Touched a new high today, but ended with a loss and closed near the session low after a negative reversal. The distributional session led to a dip below its "max buy" level. Prior highs in the $23 area define chart support along with its 50 DMA line.
>>> The latest Featured Stock Update with an annotated graph appeared on 12/8/2011. Click here.
View all notes |
Alert me of new notes |
CANSLIM.net Company Profile |
SEC |
Zacks Reports |
StockTalk |
News |
Chart |
Request a new note
C
A N
S L
I M
|
Symbol/Exchange
Company Name
Industry Group |
PRICE |
CHANGE
(%Change) |
Day High |
Volume
(% DAV)
(% 50 day avg vol) |
52 Wk Hi
% From Hi |
Featured
Date |
Price
Featured |
Pivot Featured |
|
Max Buy |
MKTX
-
NASDAQ
Marketaxess Holdings Inc
FINANCIAL SERVICES - Investment Brokerage - Nationa
|
$30.01
|
+0.75
2.56% |
$30.02
|
246,654
118.93% of 50 DAV
50 DAV is 207,400
|
$31.59
-5.00%
|
10/28/2011
|
$29.79
|
PP = $31.05
|
|
MB = $32.60
|
Most Recent Note - 1/4/2012 8:07:05 PM
Y - Gain today repaired the bulk of the prior session's loss as a negative reversal indicated distributional pressure. The 50 DMA line defines initial chart support to watch.
>>> The latest Featured Stock Update with an annotated graph appeared on 12/20/2011. Click here.
View all notes |
Alert me of new notes |
CANSLIM.net Company Profile |
SEC |
Zacks Reports |
StockTalk |
News |
Chart |
Request a new note
C
A N
S L
I M
|
OSIS
-
NASDAQ
O S I Systems Inc
ELECTRONICS - Semiconductor Equipment and Mate
|
$49.75
|
+0.29
0.59% |
$50.03
|
110,474
100.16% of 50 DAV
50 DAV is 110,300
|
$50.50
-1.49%
|
11/1/2011
|
$42.07
|
PP = $45.57
|
|
MB = $47.85
|
Most Recent Note - 1/4/2012 8:08:51 PM
G - Up today for a best-ever close, getting more extended from its prior base. Its 50 DMA line and recent chart lows near $45 define important near-term support to watch.
>>> The latest Featured Stock Update with an annotated graph appeared on 12/27/2011. Click here.
View all notes |
Alert me of new notes |
CANSLIM.net Company Profile |
SEC |
Zacks Reports |
StockTalk |
News |
Chart |
Request a new note
C
A N
S L
I M
|
PRGO
-
NASDAQ
Perrigo Co
DRUGS - Drug Related Products
|
$95.09
|
-3.46
-3.51% |
$97.48
|
1,132,393
83.47% of 50 DAV
50 DAV is 1,356,700
|
$104.70
-9.18%
|
12/9/2011
|
$99.54
|
PP = $101.56
|
|
MB = $106.64
|
Most Recent Note - 1/4/2012 8:03:11 PM
G - Down again today on below average volume, closing just below its 50 DMA line, raising concerns. Its color code is changed to green based on its deterioration, meanwhile a prompt rebound is needed for its outlook to improve.
>>> The latest Featured Stock Update with an annotated graph appeared on 12/9/2011. Click here.
View all notes |
Alert me of new notes |
CANSLIM.net Company Profile |
SEC |
Zacks Reports |
StockTalk |
News |
Chart |
Request a new note
C
A N
S L
I M
|
RAX
-
NYSE
Rackspace Hosting Inc
INTERNET - Internet Software and; Services
|
$42.35
|
-0.92
-2.13% |
$43.02
|
1,832,895
116.76% of 50 DAV
50 DAV is 1,569,800
|
$46.50
-8.91%
|
11/8/2011
|
$44.28
|
PP = $46.27
|
|
MB = $48.58
|
Most Recent Note - 1/4/2012 3:51:04 PM
G - Gapped down today, sinking near its 50 DMA line now with a loss on higher volume than the prior session while hitting 4-week lows. Color code is changed to green based on weak action that is indicative of distributional pressure after not making headway above its pivot point.
>>> The latest Featured Stock Update with an annotated graph appeared on 12/7/2011. Click here.
View all notes |
Alert me of new notes |
CANSLIM.net Company Profile |
SEC |
Zacks Reports |
StockTalk |
News |
Chart |
Request a new note
C
A N
S L
I M
|
SWI
-
NYSE
Solarwinds Inc
COMPUTER SOFTWARE and SERVICES - Application Software
|
$28.03
|
-0.48
-1.68% |
$28.37
|
1,218,139
95.64% of 50 DAV
50 DAV is 1,273,700
|
$33.68
-16.78%
|
10/27/2011
|
$27.78
|
PP = $25.62
|
|
MB = $26.90
|
Most Recent Note - 1/4/2012 3:57:47 PM
Rebounding into the upper half of its intra-day range now, but it is down with higher volume than the prior session total. It is still below its 50 DMA line, and based on weakness and distributional action it is -16% off its 52-week high. It will be dropped from the Featured Stocks list tonight. Prior highs in the $25-26 area and its 200 DMA line define the next important area of chart support.
>>> The latest Featured Stock Update with an annotated graph appeared on 12/19/2011. Click here.
View all notes |
Alert me of new notes |
CANSLIM.net Company Profile |
SEC |
Zacks Reports |
StockTalk |
News |
Chart |
Request a new note
C
A N
S L
I M
|
Symbol/Exchange
Company Name
Industry Group |
PRICE |
CHANGE
(%Change) |
Day High |
Volume
(% DAV)
(% 50 day avg vol) |
52 Wk Hi
% From Hi |
Featured
Date |
Price
Featured |
Pivot Featured |
|
Max Buy |
TDG
-
NYSE
Transdigm Group Inc
AEROSPACE/DEFENSE - Aerospace/Defense Products and; Services
|
$93.13
|
-0.95
-1.01% |
$94.11
|
295,006
81.97% of 50 DAV
50 DAV is 359,900
|
$102.73
-9.34%
|
11/9/2011
|
$98.45
|
PP = $95.14
|
|
MB = $99.90
|
Most Recent Note - 1/4/2012 7:59:58 PM
G - Down further today on lighter volume after its prior loss on more than 2 times average volume triggered a technical sell signal. See latest FSU analysis for more details and a new annotated graph.
>>> The latest Featured Stock Update with an annotated graph appeared on 1/4/2012. Click here.
View all notes |
Alert me of new notes |
CANSLIM.net Company Profile |
SEC |
Zacks Reports |
StockTalk |
News |
Chart |
Request a new note
C
A N
S L
I M
|
V
-
NYSE
Visa Inc Cl A
DIVERSIFIED SERVICES - Business/Management Services
|
$101.15
|
-1.84
-1.79% |
$102.46
|
4,131,763
100.83% of 50 DAV
50 DAV is 4,097,700
|
$103.45
-2.22%
|
10/24/2011
|
$94.21
|
PP = $94.85
|
|
MB = $99.59
|
Most Recent Note - 12/29/2011 5:40:35 PM
G - Up today with below average volume, rising to a best-ever close. It is extended from its prior base and trading above its "max buy" level. Prior highs in the $95 area and its 50 DMA line define chart support to watch on pullbacks.
>>> The latest Featured Stock Update with an annotated graph appeared on 12/15/2011. Click here.
View all notes |
Alert me of new notes |
CANSLIM.net Company Profile |
SEC |
Zacks Reports |
StockTalk |
News |
Chart |
Request a new note
C
A N
S L
I M
|
|
|
|
THESE ARE NOT BUY RECOMMENDATIONS!
Comments contained in the body of this report are technical
opinions only. The material herein has been obtained
from sources believed to be reliable and accurate, however,
its accuracy and completeness cannot be guaranteed.
This site is not an investment advisor, hence it does
not endorse or recommend any securities or other investments.
Any recommendation contained in this report may not
be suitable for all investors and it is not to be deemed
an offer or solicitation on our part with respect to
the purchase or sale of any securities. All trademarks,
service marks and trade names appearing in this report
are the property of their respective owners, and are
likewise used for identification purposes only.
This report is a service available
only to active Paid Premium Members.
You may opt-out of receiving report notifications
at any time. Questions or comments may be submitted
by writing to Premium Membership Services 665 S.E. 10 Street, Suite 201 Deerfield Beach, FL 33441-5634 or by calling 1-800-965-8307
or 954-785-1121.
|
|
|

