Symbol/Exchange
Company Name
Industry Group |
PRICE |
CHANGE
(%Change) |
Day High |
Volume
(% DAV)
(% 50 day avg vol) |
52 Wk Hi
% From Hi |
Featured
Date |
Price
Featured |
Pivot Featured |
|
Max Buy |
ABV
-
NYSE
Comp De Bebidas Adr
FOOD and BEVERAGE - Beverages - Brewers
|
$30.58
|
-0.63
-2.02% |
$31.22
|
3,156,530
118.98% of 50 DAV
50 DAV is 2,653,100
|
$32.00
-4.44%
|
12/10/2010
|
$139.87
|
PP = $145.46
|
|
MB = $152.73
|
 Most Recent Note - 1/5/2011 6:03:27 PM
G - Pulling back from its all-time high. Prior highs in the $29 area define important chart support to watch above its 50 DMA line. Do not be confused by the 5:1 split impacting its share price as of 12/28/10. (Previous data concerning Featured Price and Pivot Point will soon be adjusted).
>>> The latest Featured Stock Update with an annotated graph appeared on 12/3/2010. Click here.
View all notes |
Alert me of new notes |
CANSLIM.net Company Profile |
SEC |
Zacks Reports |
StockTalk |
News |
Chart |
Request a new note
C
A N
S L
I M


|
ARUN
-
NASDAQ
Aruba Networks Inc
COMPUTER HARDWARE - Networking andamp; Communication Dev
|
$23.48
|
+0.56
2.43% |
$23.60
|
2,745,426
115.04% of 50 DAV
50 DAV is 2,386,600
|
$24.28
-3.29%
|
1/3/2011
|
$22.55
|
PP = $24.38
|
|
MB = $25.60
|
Most Recent Note - 1/5/2011 6:05:09 PM
Y - Rallied further above its 50 DMA line with today's 3rd consecutive gain. Color code was changed to yellow with new pivot point cited based on its 52-week high plus 10 cents. Time is needed for it to prove a new (or add-on) technical buy signal from a sound new base, meanwhile recent lows in the $20.00 area define an important chart support level to watch.
>>> The latest Featured Stock Update with an annotated graph appeared on 12/14/2010. Click here.
View all notes |
Alert me of new notes |
CANSLIM.net Company Profile |
SEC |
Zacks Reports |
StockTalk |
News |
Chart |
Request a new note
C
A N
S L
I M
|
CACC
-
NASDAQ
Credit Acceptance Corp
FINANCIAL SERVICES - Credit Services
|
$63.11
|
+1.46
2.37% |
$63.11
|
22,551
98.48% of 50 DAV
50 DAV is 22,900
|
$64.09
-1.53%
|
11/22/2010
|
$59.97
|
PP = $62.00
|
|
MB = $65.10
|
Most Recent Note - 1/5/2011 6:06:52 PM
Y - Hovering just -1.5% off its 52-week high. Its waning Relative Strength rank (76) is a concern, yet it remains below the long ago cited "max buy" level and it faces no resistance due to overhead supply.
>>> The latest Featured Stock Update with an annotated graph appeared on 12/20/2010. Click here.
View all notes |
Alert me of new notes |
CANSLIM.net Company Profile |
SEC |
Zacks Reports |
StockTalk |
News |
Chart |
Request a new note
C
A N
S L
I M
|
CIS
-
NYSE
Camelot Info Systems Ads
COMPUTER SOFTWARE andamp; SERVICES - Information Technology Service
|
$23.83
|
+0.35
1.49% |
$24.04
|
439,127
105.18% of 50 DAV
50 DAV is 417,500
|
$25.50
-6.55%
|
11/26/2010
|
$18.93
|
PP = $19.72
|
|
MB = $20.71
|
Most Recent Note - 1/5/2011 6:07:57 PM
G - Closed near the session high today after a positive reversal. No resistance remains due to overhead supply after a choppy 5-week consolidation above prior highs and its 50 DMA line, but it has not built a sound new base. On 12/09/10 it completed a Secondary Offering.
>>> The latest Featured Stock Update with an annotated graph appeared on 11/26/2010. Click here.
View all notes |
Alert me of new notes |
CANSLIM.net Company Profile |
SEC |
Zacks Reports |
StockTalk |
News |
Chart |
Request a new note
C
A N
S L
I M
|
CMG
-
NYSE
Chipotle Mexican Grill
LEISURE - Restaurants
|
$221.00
|
-1.37
-0.62% |
$224.17
|
530,578
51.53% of 50 DAV
50 DAV is 1,029,600
|
$262.78
-15.90%
|
9/1/2010
|
$158.31
|
PP = $155.52
|
|
MB = $163.30
|
Most Recent Note - 1/5/2011 6:09:46 PM
G - Consolidating near the previously noted chart low, still below its rising 50 DMA line which may act as resistance. Technically, recent violations triggered sell signals and hinted that it may be due for a longer and deeper consolidation, while subsequent gains above its short-term average would help its outlook improve.
>>> The latest Featured Stock Update with an annotated graph appeared on 12/17/2010. Click here.
View all notes |
Alert me of new notes |
CANSLIM.net Company Profile |
SEC |
Zacks Reports |
StockTalk |
News |
Chart |
Request a new note
C
A N
S L
I M
|
Symbol/Exchange
Company Name
Industry Group |
PRICE |
CHANGE
(%Change) |
Day High |
Volume
(% DAV)
(% 50 day avg vol) |
52 Wk Hi
% From Hi |
Featured
Date |
Price
Featured |
Pivot Featured |
|
Max Buy |
DECK
-
NASDAQ
Deckers Outdoor Corp
CONSUMER NON-DURABLES - Textile - Apparel Footwear
|
$80.65
|
+1.95
2.48% |
$81.25
|
2,029,494
103.23% of 50 DAV
50 DAV is 1,966,000
|
$87.88
-8.23%
|
10/27/2010
|
$54.16
|
PP = $54.86
|
|
MB = $57.60
|
Most Recent Note - 1/5/2011 6:11:40 PM
G - Consolidating in recent weeks, extended from a sound base, and still well above its 50 DMA line that defines support to watch.
>>> The latest Featured Stock Update with an annotated graph appeared on 12/16/2010. Click here.
View all notes |
Alert me of new notes |
CANSLIM.net Company Profile |
SEC |
Zacks Reports |
StockTalk |
News |
Chart |
Request a new note
C
A N
S L
I M
|
EZCH
-
NASDAQ
Ezchip Semiconductor Ltd
ELECTRONICS - Semiconductor - Specialized
|
$31.09
|
+0.58
1.90% |
$31.41
|
511,054
190.76% of 50 DAV
50 DAV is 267,900
|
$30.61
1.57%
|
12/2/2010
|
$27.53
|
PP = $26.00
|
|
MB = $27.30
|
Most Recent Note - 1/5/2011 1:40:00 PM
G - Hit another new 52-week highs today with a 3rd consecutive gain backed by above average volume following a healthy consolidation. Prior chart highs in the $26 area coincide with its 50 DMA line defining an important technical support level to watch.
>>> The latest Featured Stock Update with an annotated graph appeared on 12/2/2010. Click here.
View all notes |
Alert me of new notes |
CANSLIM.net Company Profile |
SEC |
Zacks Reports |
StockTalk |
News |
Chart |
Request a new note
C
A N
S L
I M
|
EZPW
-
NASDAQ
Ezcorp Inc Cl A
SPECIALTY RETAIL - Specialty Retail, Other
|
$27.96
|
+0.47
1.71% |
$28.08
|
272,846
75.18% of 50 DAV
50 DAV is 362,900
|
$28.75
-2.75%
|
11/5/2010
|
$24.02
|
PP = $23.85
|
|
MB = $25.04
|
Most Recent Note - 1/5/2011 6:13:07 PM
G - Hovering only -2.8% off its 52-week high and near its best ever close. Extended from a sound base pattern, its 50 DMA line defines important support.
>>> The latest Featured Stock Update with an annotated graph appeared on 12/29/2010. Click here.
View all notes |
Alert me of new notes |
CANSLIM.net Company Profile |
SEC |
Zacks Reports |
StockTalk |
News |
Chart |
Request a new note
C
A N
S L
I M
|
FFIV
-
NASDAQ
F 5 Networks Inc
INTERNET - Internet Software and Services
|
$137.29
|
+5.22
3.95% |
$137.30
|
2,300,103
84.52% of 50 DAV
50 DAV is 2,721,400
|
$143.75
-4.49%
|
6/16/2010
|
$74.50
|
PP = $74.10
|
|
MB = $77.81
|
Most Recent Note - 1/5/2011 6:17:22 PM
G - Closed near the session high today perched -4.5% off its 52-week high. Recent lows define chart support just above its 50 DMA line.
>>> The latest Featured Stock Update with an annotated graph appeared on 12/28/2010. Click here.
View all notes |
Alert me of new notes |
CANSLIM.net Company Profile |
SEC |
Zacks Reports |
StockTalk |
News |
Chart |
Request a new note
C
A N
S L
I M
|
FOSL
-
NASDAQ
Fossil Inc
CONSUMER DURABLES - Recreational Goods, Other
|
$72.00
|
-0.59
-0.81% |
$72.82
|
704,538
90.48% of 50 DAV
50 DAV is 778,700
|
$74.34
-3.15%
|
11/26/2010
|
$69.10
|
PP = $70.17
|
|
MB = $73.68
|
Most Recent Note - 1/5/2011 6:18:24 PM
Y - Hovering less than a dollar from its highest ever closes and still below its "max buy" level. It stalled following its technical breakout on 12/02/10 from an advanced "3-weeks tight" pattern. Its 50 DMA line defines important support to watch.
>>> The latest Featured Stock Update with an annotated graph appeared on 11/29/2010. Click here.
View all notes |
Alert me of new notes |
CANSLIM.net Company Profile |
SEC |
Zacks Reports |
StockTalk |
News |
Chart |
Request a new note
C
A N
S L
I M
|
Symbol/Exchange
Company Name
Industry Group |
PRICE |
CHANGE
(%Change) |
Day High |
Volume
(% DAV)
(% 50 day avg vol) |
52 Wk Hi
% From Hi |
Featured
Date |
Price
Featured |
Pivot Featured |
|
Max Buy |
HMSY
-
NASDAQ
H M S Holdings Corp
COMPUTER SOFTWARE and SERVICES - Healthcare Information Service
|
$64.78
|
+1.17
1.84% |
$65.29
|
167,723
85.88% of 50 DAV
50 DAV is 195,300
|
$67.10
-3.46%
|
11/19/2010
|
$61.89
|
PP = $63.01
|
|
MB = $66.16
|
Most Recent Note - 1/5/2011 6:20:47 PM
G - Perched -3.5% off its high, consolidating just above its 50 DMA line following a negative reversal on 12/22/10. Its Relative Strength rank of 60 now is a concern. See the latest FSU analysis for additional details and an annotated graph.
>>> The latest Featured Stock Update with an annotated graph appeared on 1/3/2011. Click here.
View all notes |
Alert me of new notes |
CANSLIM.net Company Profile |
SEC |
Zacks Reports |
StockTalk |
News |
Chart |
Request a new note
C
A N
S L
I M
|
JOBS
-
NASDAQ
Fifty One Job Inc Ads
DIVERSIFIED SERVICES - Staffing and; Outsourcing Service
|
$51.61
|
+0.79
1.55% |
$51.96
|
36,774
21.36% of 50 DAV
50 DAV is 172,200
|
$55.50
-7.01%
|
10/13/2010
|
$42.07
|
PP = $40.60
|
|
MB = $42.63
|
Most Recent Note - 1/5/2011 6:23:50 PM
G - Consolidating just above its 50 DMA line, just -7% off its 52-week high. Volume totals have recently been cooling. It has not formed a sound new base, only consolidating for the past 4 weeks after recently challenging its all-time high near $55 from 2004.
>>> The latest Featured Stock Update with an annotated graph appeared on 12/30/2010. Click here.
View all notes |
Alert me of new notes |
CANSLIM.net Company Profile |
SEC |
Zacks Reports |
StockTalk |
News |
Chart |
Request a new note
C
A N
S L
I M
|
LULU
-
NASDAQ
Lululemon Athletica
MANUFACTURING - Textile Manufacturing
|
$68.49
|
+1.29
1.92% |
$69.29
|
2,511,426
144.92% of 50 DAV
50 DAV is 1,733,000
|
$74.60
-8.19%
|
10/8/2010
|
$47.66
|
PP = $46.67
|
|
MB = $49.00
|
Most Recent Note - 1/5/2011 6:24:55 PM
G - Today's positive reversal was encouraging. Still, there is no near-term chart support and it is extended from its 50 DMA line.
>>> The latest Featured Stock Update with an annotated graph appeared on 12/1/2010. Click here.
View all notes |
Alert me of new notes |
CANSLIM.net Company Profile |
SEC |
Zacks Reports |
StockTalk |
News |
Chart |
Request a new note
C
A N
S L
I M
|
MWIV
-
NASDAQ
M W I Veterinary Supply
HEALTH SERVICES - Medical Instruments and; Supplies
|
$65.52
|
+1.41
2.20% |
$65.92
|
68,673
130.06% of 50 DAV
50 DAV is 52,800
|
$65.84
-0.49%
|
11/4/2010
|
$61.79
|
PP = $59.60
|
|
MB = $62.58
|
Most Recent Note - 1/5/2011 6:27:07 PM
G - Gain today with above average volume helped it finish 3 cents below its best ever close. Its 50 DMA line defines support to watch.
>>> The latest Featured Stock Update with an annotated graph appeared on 12/21/2010. Click here.
View all notes |
Alert me of new notes |
CANSLIM.net Company Profile |
SEC |
Zacks Reports |
StockTalk |
News |
Chart |
Request a new note
C
A N
S L
I M
|
NEOG
-
NASDAQ
Neogen Corp
DRUGS - Diagnostic Substances
|
$39.93
|
-1.50
-3.62% |
$40.88
|
294,172
321.50% of 50 DAV
50 DAV is 91,500
|
$43.14
-7.44%
|
9/1/2010
|
$30.79
|
PP = $30.49
|
|
MB = $32.01
|
Most Recent Note - 1/5/2011 6:31:22 PM
G - Gapped down today for a second consecutive loss on heavy volume. It nearly tested its 50 DMA line which has been a reliable support level after reporting earnings +30% on +25% sales revenues for the quarter ended November 30, 2010 versus the year ago period.
>>> The latest Featured Stock Update with an annotated graph appeared on 12/6/2010. Click here.
View all notes |
Alert me of new notes |
CANSLIM.net Company Profile |
SEC |
Zacks Reports |
StockTalk |
News |
Chart |
Request a new note
C
A N
S L
I M
|
Symbol/Exchange
Company Name
Industry Group |
PRICE |
CHANGE
(%Change) |
Day High |
Volume
(% DAV)
(% 50 day avg vol) |
52 Wk Hi
% From Hi |
Featured
Date |
Price
Featured |
Pivot Featured |
|
Max Buy |
NFLX
-
NASDAQ
Netflix Inc
SPECIALTY RETAIL - Music and Video Stores
|
$179.73
|
-1.64
-0.90% |
$182.79
|
4,546,444
77.31% of 50 DAV
50 DAV is 5,880,900
|
$206.80
-13.09%
|
11/9/2010
|
$173.10
|
PP = $184.84
|
|
MB = $194.08
|
Most Recent Note - 1/5/2011 6:32:53 PM
G - Quietly hovering near its 50 DMA line and recent lows defining near-term support. More damaging losses could trigger more serious technical sell signals.
>>> The latest Featured Stock Update with an annotated graph appeared on 11/24/2010. Click here.
View all notes |
Alert me of new notes |
CANSLIM.net Company Profile |
SEC |
Zacks Reports |
StockTalk |
News |
Chart |
Request a new note
C
A N
S L
I M
|
NTAP
-
NASDAQ
Netapp Inc
COMPUTER HARDWARE - Data Storage Devices
|
$57.87
|
+0.49
0.85% |
$58.12
|
3,911,648
69.33% of 50 DAV
50 DAV is 5,642,400
|
$57.96
-0.16%
|
9/8/2010
|
$46.98
|
PP = $44.99
|
|
MB = $47.24
|
Most Recent Note - 1/5/2011 6:33:40 PM
G - Today's gain with light volume led to another new high close, rising from what some have labeled a "cup-with-handle" base. However, a flaw in that setup pattern is that the pullback following its 12/13/10 high of $56.55 led to a retracement below the middle point of the overall cup's depth. After high-volume whipsaw action in mid-November the volume totals have been generally cooling, and it found support near its 50 DMA line, working on building a new base. No overhead supply remains to hinder its progress.
>>> The latest Featured Stock Update with an annotated graph appeared on 12/27/2010. Click here.
View all notes |
Alert me of new notes |
CANSLIM.net Company Profile |
SEC |
Zacks Reports |
StockTalk |
News |
Chart |
Request a new note
C
A N
S L
I M
|
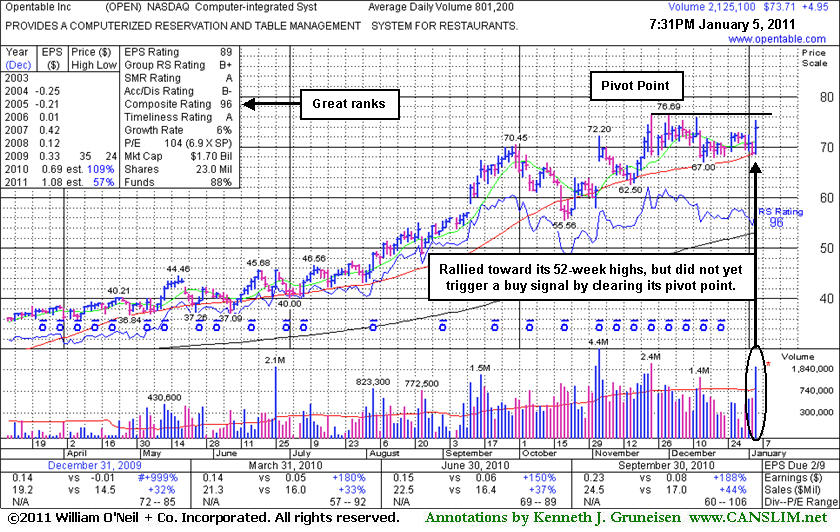
OPEN
-
NASDAQ
Opentable Inc
INTERNET - Internet Software and Services
|
$73.71
|
+4.95
7.20% |
$75.37
|
2,128,537
265.67% of 50 DAV
50 DAV is 801,200
|
$76.39
-3.51%
|
1/5/2011
|
$74.05
|
PP = $76.79
|
|
MB = $80.63
|
Most Recent Note - 1/5/2011 6:37:20 PM
Y - Posted a solid gain today with above average volume, rallying from its 50 DMA support and approaching its 52-week high. Featured in yellow in today's mid-day report with a pivot point cited based on its 52-week high plus 10 cents after an orderly base. Disciplined investors know that confirming gains above its pivot with at least +50% above average volume are needed to confirm a proper technical buy signal. . Last noted in the 11/24/10 mid-day report -"Reported earnings +188% on +44% sales revenues for the quarter ended September 30, 2010 versus the year ago period. It could go on to produce more climactic gains. Found support near its 50 DMA line recently but did not form a sound base pattern of sufficient length since last noted in the 9/20/10 mid-day report - 'The C criteria is satisfied as earnings and sales revenues increases have been strong the 4 latest quarterly comparisons versus the year ago period. It got off to a very volatile start after its 5/11/09 IPO at $20, and it slumped for more than 4 months after it completed a Secondary Offering on 9/23/09. The company's management still owns a 32% stake in its shares and top-rated funds owning shares rose from 50 in Sep '09 to 79 in Jun '10.'"
>>> The latest Featured Stock Update with an annotated graph appeared on 1/5/2011. Click here.
View all notes |
Alert me of new notes |
CANSLIM.net Company Profile |
SEC |
Zacks Reports |
StockTalk |
News |
Chart |
Request a new note
C
A N
S L
I M
|
ORCL
-
NASDAQ
Oracle Corp
COMPUTER SOFTWARE and SERVICES - Application Software
|
$31.04
|
-0.44
-1.40% |
$31.44
|
36,338,892
128.91% of 50 DAV
50 DAV is 28,189,100
|
$32.27
-3.81%
|
12/7/2010
|
$29.05
|
PP = $29.92
|
|
MB = $31.42
|
Most Recent Note - 1/5/2011 6:39:26 PM
G - Volume picked up behind today's loss as it closed below its "max buy" level near the session low, yet only -3.8% off its 52-week high. Support to watch is at prior chart highs and its 50 DMA line.
>>> The latest Featured Stock Update with an annotated graph appeared on 11/18/2010. Click here.
View all notes |
Alert me of new notes |
CANSLIM.net Company Profile |
SEC |
Zacks Reports |
StockTalk |
News |
Chart |
Request a new note
C
A N
S L
I M
|
PAY
-
NYSE
Verifone Systems Inc
COMPUTER HARDWARE - Transaction Automation Systems
|
$41.46
|
+1.99
5.04% |
$41.53
|
1,722,086
118.23% of 50 DAV
50 DAV is 1,456,500
|
$41.47
-0.02%
|
11/29/2010
|
$33.96
|
PP = $36.04
|
|
MB = $37.84
|
Most Recent Note - 1/5/2011 6:40:15 PM
G - Powered higher on slightly above average volume for its best ever close. It has not formed a sound base. Prior high in the $36 area coincides with its 50 DMA line defining important near-term chart support to watch.
>>> The latest Featured Stock Update with an annotated graph appeared on 12/15/2010. Click here.
View all notes |
Alert me of new notes |
CANSLIM.net Company Profile |
SEC |
Zacks Reports |
StockTalk |
News |
Chart |
Request a new note
C
A N
S L
I M
|
Symbol/Exchange
Company Name
Industry Group |
PRICE |
CHANGE
(%Change) |
Day High |
Volume
(% DAV)
(% 50 day avg vol) |
52 Wk Hi
% From Hi |
Featured
Date |
Price
Featured |
Pivot Featured |
|
Max Buy |
PCLN
-
NASDAQ
Priceline.Com Inc
INTERNET - Internet Software and Services
|
$433.60
|
+24.22
5.92% |
$434.95
|
2,409,185
234.42% of 50 DAV
50 DAV is 1,027,700
|
$428.10
1.28%
|
11/1/2002
|
$399.55
|
PP = $428.20
|
|
MB = $449.61
|
Most Recent Note - 1/5/2011 6:42:08 PM
Y - Considerable gain today with +134% above average volume for a new all-time high, confirming a technical buy signal with is convincing rally above the pivot point previously cited. It is free from resistance due to overhead supply. Returned to the Featured Stocks list with its appearance in the January 2011 CANSLIM.net News (read here) including detailed analysis and annotated daily and weekly graphs.
>>> The latest Featured Stock Update with an annotated graph appeared on 1/2/2011. Click here.
View all notes |
Alert me of new notes |
CANSLIM.net Company Profile |
SEC |
Zacks Reports |
StockTalk |
News |
Chart |
Request a new note
C
A N
S L
I M
|
RAX
-
NYSE
Rackspace Hosting Inc
INTERNET - Internet Software and; Services
|
$31.81
|
+1.37
4.50% |
$31.85
|
1,693,387
94.60% of 50 DAV
50 DAV is 1,790,100
|
$32.69
-2.69%
|
9/21/2010
|
$22.84
|
PP = $23.61
|
|
MB = $24.79
|
Most Recent Note - 1/5/2011 6:44:58 PM
G - Positive reversal today was encouraging as it rallied for its best ever new high close. No resistance remains due to overhead supply, but it has not formed a sound new base pattern of sufficient length.
>>> The latest Featured Stock Update with an annotated graph appeared on 12/31/2010. Click here.
View all notes |
Alert me of new notes |
CANSLIM.net Company Profile |
SEC |
Zacks Reports |
StockTalk |
News |
Chart |
Request a new note
C
A N
S L
I M
|
ROVI
-
NASDAQ
Rovi Corp
COMPUTER SOFTWARE andamp; SERVICES - Security Software andamp; Services
|
$65.66
|
+1.63
2.55% |
$67.00
|
4,590,376
390.24% of 50 DAV
50 DAV is 1,176,300
|
$64.18
2.31%
|
10/29/2010
|
$49.99
|
PP = $53.10
|
|
MB = $55.76
|
Most Recent Note - 1/5/2011 6:46:07 PM
G - Hit yet another new 52-week high today with above average and ever-increasing volume behind 8 consecutive gains. Extended from a sound base, meanwhile its 50 DMA line defines support just below a recent chart low ($55.65 on 12/23/10).
>>> The latest Featured Stock Update with an annotated graph appeared on 12/13/2010. Click here.
View all notes |
Alert me of new notes |
CANSLIM.net Company Profile |
SEC |
Zacks Reports |
StockTalk |
News |
Chart |
Request a new note
C
A N
S L
I M
|
SHOO
-
NASDAQ
Steven Madden Limited
CONSUMER NON-DURABLES - Textile - Apparel Footwear
|
$42.27
|
+0.41
0.98% |
$42.29
|
287,037
76.12% of 50 DAV
50 DAV is 377,100
|
$47.69
-11.37%
|
11/23/2010
|
$44.61
|
PP = $44.95
|
|
MB = $47.20
|
Most Recent Note - 1/5/2011 6:47:10 PM
G - Up with below average volume today. Recent slump below its 50 DMA line and prior lows raised concerns as technical damage mounted. Prior highs near $40 define the nearest chart support.
>>> The latest Featured Stock Update with an annotated graph appeared on 1/4/2011. Click here.
View all notes |
Alert me of new notes |
CANSLIM.net Company Profile |
SEC |
Zacks Reports |
StockTalk |
News |
Chart |
Request a new note
C
A N
S L
I M
|
SLW
-
NYSE
Silver Wheaton Corp
METALS and; MINING - Silver
|
$36.65
|
+0.01
0.03% |
$36.78
|
14,671,821
140.02% of 50 DAV
50 DAV is 10,478,700
|
$42.34
-13.44%
|
8/25/2010
|
$21.40
|
PP = $21.99
|
|
MB = $23.09
|
Most Recent Note - 1/5/2011 6:48:57 PM
G - Closed near the session high after a positive reversal from lows briefly below its 50 DMA line - a very important support level. Consolidating since its negative reversal at an all-time high on 12/07/10.
>>> The latest Featured Stock Update with an annotated graph appeared on 12/8/2010. Click here.
View all notes |
Alert me of new notes |
CANSLIM.net Company Profile |
SEC |
Zacks Reports |
StockTalk |
News |
Chart |
Request a new note
C
A N
S L
I M
|
Symbol/Exchange
Company Name
Industry Group |
PRICE |
CHANGE
(%Change) |
Day High |
Volume
(% DAV)
(% 50 day avg vol) |
52 Wk Hi
% From Hi |
Featured
Date |
Price
Featured |
Pivot Featured |
|
Max Buy |
UA
-
NYSE
Under Armour Inc Cl A
CONSUMER NON-DURABLES - Textile - Apparel Clothing
|
$55.54
|
+0.89
1.63% |
$55.94
|
428,483
59.51% of 50 DAV
50 DAV is 720,000
|
$60.14
-7.65%
|
9/9/2010
|
$39.99
|
PP = $40.10
|
|
MB = $42.11
|
Most Recent Note - 1/5/2011 6:49:35 PM
G - Volume totals have been cooling while consolidating just above its 50 DMA line defining important support.
>>> The latest Featured Stock Update with an annotated graph appeared on 12/23/2010. Click here.
View all notes |
Alert me of new notes |
CANSLIM.net Company Profile |
SEC |
Zacks Reports |
StockTalk |
News |
Chart |
Request a new note
C
A N
S L
I M
|
ULTA
-
NASDAQ
Ulta Salon Cosm & Frag
SPECIALTY RETAIL - Specialty Retail, Other
|
$34.52
|
+0.24
0.70% |
$34.75
|
530,439
100.06% of 50 DAV
50 DAV is 530,100
|
$37.24
-7.30%
|
9/3/2010
|
$26.36
|
PP = $25.89
|
|
MB = $27.18
|
Most Recent Note - 1/5/2011 6:50:25 PM
G - Consolidating just above its 50 DMA line still. Subsequent deterioration below it or the most recent chart low ($32.01 on 12/15/10) could raise concerns and trigger technical sell signals.
>>> The latest Featured Stock Update with an annotated graph appeared on 12/22/2010. Click here.
View all notes |
Alert me of new notes |
CANSLIM.net Company Profile |
SEC |
Zacks Reports |
StockTalk |
News |
Chart |
Request a new note
C
A N
S L
I M
|