***Last / Change / Volume data in this table is the closing quote data***
Symbol/Exchange
Company Name
Industry Group |
PRICE |
CHANGE
(%Change) |
Day High |
Volume
(% DAV)
(% 50 day avg vol) |
52 Wk Hi
% From Hi |
Featured
Date |
Price
Featured |
Pivot Featured |
|
Max Buy |
ABV
-
NYSE
Comp De Bebidas Adr
FOOD and BEVERAGE - Beverages - Brewers
|
$30.55
|
-0.03
-0.10% |
$30.67
|
2,549,810
96.11% of 50 DAV
50 DAV is 2,653,100
|
$32.00
-4.53%
|
12/10/2010
|
$139.87
|
PP = $145.46
|
|
MB = $152.73
|
Most Recent Note - 1/5/2011 6:03:27 PM
G - Pulling back from its all-time high. Prior highs in the $29 area define important chart support to watch above its 50 DMA line. Do not be confused by the 5:1 split impacting its share price as of 12/28/10. (Previous data concerning Featured Price and Pivot Point will soon be adjusted).
>>> The latest Featured Stock Update with an annotated graph appeared on 12/3/2010. Click here.
View all notes |
Alert me of new notes |
CANSLIM.net Company Profile |
SEC |
Zacks Reports |
StockTalk |
News |
Chart |
Request a new note
C
A N
S L
I M


|
ARUN
-
NASDAQ
Aruba Networks Inc
COMPUTER HARDWARE - Networking andamp; Communication Dev
|
$23.75
|
+0.27
1.15% |
$23.95
|
1,926,100
80.70% of 50 DAV
50 DAV is 2,386,600
|
$24.28
-2.18%
|
1/3/2011
|
$22.55
|
PP = $24.38
|
|
MB = $25.60
|
 Most Recent Note - 1/6/2011 5:12:44 PM
Y - Today's 4th consecutive gain led to a close -2.2% off its all-time high. Subsequent gains above its new pivot point with at least +50% above average volume may trigger a new (or add-on) technical buy signal.
>>> The latest Featured Stock Update with an annotated graph appeared on 12/14/2010. Click here.
View all notes |
Alert me of new notes |
CANSLIM.net Company Profile |
SEC |
Zacks Reports |
StockTalk |
News |
Chart |
Request a new note
C
A N
S L
I M
|
CACC
-
NASDAQ
Credit Acceptance Corp
FINANCIAL SERVICES - Credit Services
|
$63.02
|
-0.09
-0.14% |
$63.22
|
11,466
50.07% of 50 DAV
50 DAV is 22,900
|
$64.09
-1.67%
|
11/22/2010
|
$59.97
|
PP = $62.00
|
|
MB = $65.10
|
Most Recent Note - 1/6/2011 5:15:41 PM
Y - Slightly higher volume in the past week without meaningful price progress is a sign of mild distributional pressure. It faces no resistance due to overhead supply. Recent lows and its 50 DMA line near $61 define important chart support to watch.
>>> The latest Featured Stock Update with an annotated graph appeared on 12/20/2010. Click here.
View all notes |
Alert me of new notes |
CANSLIM.net Company Profile |
SEC |
Zacks Reports |
StockTalk |
News |
Chart |
Request a new note
C
A N
S L
I M
|
CIS
-
NYSE
Camelot Info Systems Ads
COMPUTER SOFTWARE andamp; SERVICES - Information Technology Service
|
$24.25
|
+0.42
1.76% |
$24.54
|
270,918
64.89% of 50 DAV
50 DAV is 417,500
|
$25.50
-4.90%
|
11/26/2010
|
$18.93
|
PP = $19.72
|
|
MB = $20.71
|
Most Recent Note - 1/5/2011 6:07:57 PM
G - Closed near the session high today after a positive reversal. No resistance remains due to overhead supply after a choppy 5-week consolidation above prior highs and its 50 DMA line, but it has not built a sound new base. On 12/09/10 it completed a Secondary Offering.
>>> The latest Featured Stock Update with an annotated graph appeared on 11/26/2010. Click here.
View all notes |
Alert me of new notes |
CANSLIM.net Company Profile |
SEC |
Zacks Reports |
StockTalk |
News |
Chart |
Request a new note
C
A N
S L
I M
|
CMG
-
NYSE
Chipotle Mexican Grill
LEISURE - Restaurants
|
$226.50
|
+5.50
2.49% |
$229.80
|
1,048,157
101.80% of 50 DAV
50 DAV is 1,029,600
|
$262.78
-13.80%
|
9/1/2010
|
$158.31
|
PP = $155.52
|
|
MB = $163.30
|
Most Recent Note - 1/6/2011 4:16:02 PM
G - Gapped up today, rising near its 50 DMA line but closing near the session low. Recent violations triggered technical sell signals hinting it may be due for a longer and deeper consolidation, while subsequent gains above its short-term average would help its outlook improve.
>>> The latest Featured Stock Update with an annotated graph appeared on 12/17/2010. Click here.
View all notes |
Alert me of new notes |
CANSLIM.net Company Profile |
SEC |
Zacks Reports |
StockTalk |
News |
Chart |
Request a new note
C
A N
S L
I M
|
Symbol/Exchange
Company Name
Industry Group |
PRICE |
CHANGE
(%Change) |
Day High |
Volume
(% DAV)
(% 50 day avg vol) |
52 Wk Hi
% From Hi |
Featured
Date |
Price
Featured |
Pivot Featured |
|
Max Buy |
DECK
-
NASDAQ
Deckers Outdoor Corp
CONSUMER NON-DURABLES - Textile - Apparel Footwear
|
$78.78
|
-1.87
-2.32% |
$80.81
|
1,200,929
61.08% of 50 DAV
50 DAV is 1,966,000
|
$87.88
-10.36%
|
10/27/2010
|
$54.16
|
PP = $54.86
|
|
MB = $57.60
|
Most Recent Note - 1/5/2011 6:11:40 PM
G - Consolidating in recent weeks, extended from a sound base, and still well above its 50 DMA line that defines support to watch.
>>> The latest Featured Stock Update with an annotated graph appeared on 12/16/2010. Click here.
View all notes |
Alert me of new notes |
CANSLIM.net Company Profile |
SEC |
Zacks Reports |
StockTalk |
News |
Chart |
Request a new note
C
A N
S L
I M
|
EZCH
-
NASDAQ
Ezchip Semiconductor Ltd
ELECTRONICS - Semiconductor - Specialized
|
$31.57
|
+0.48
1.54% |
$31.63
|
499,758
186.55% of 50 DAV
50 DAV is 267,900
|
$31.41
0.51%
|
12/2/2010
|
$27.53
|
PP = $26.00
|
|
MB = $27.30
|
Most Recent Note - 1/6/2011 4:37:32 PM
G - Hit another new 52-week high today with a 4th consecutive gain backed by above average volume. Prior chart highs in the $29 area define initial support to watch well above its 50 DMA line.
>>> The latest Featured Stock Update with an annotated graph appeared on 12/2/2010. Click here.
View all notes |
Alert me of new notes |
CANSLIM.net Company Profile |
SEC |
Zacks Reports |
StockTalk |
News |
Chart |
Request a new note
C
A N
S L
I M
|
EZPW
-
NASDAQ
Ezcorp Inc Cl A
SPECIALTY RETAIL - Specialty Retail, Other
|
$28.07
|
+0.11
0.39% |
$28.15
|
475,739
131.09% of 50 DAV
50 DAV is 362,900
|
$28.75
-2.37%
|
11/5/2010
|
$24.02
|
PP = $23.85
|
|
MB = $25.04
|
Most Recent Note - 1/5/2011 6:13:07 PM
G - Hovering only -2.8% off its 52-week high and near its best ever close. Extended from a sound base pattern, its 50 DMA line defines important support.
>>> The latest Featured Stock Update with an annotated graph appeared on 12/29/2010. Click here.
View all notes |
Alert me of new notes |
CANSLIM.net Company Profile |
SEC |
Zacks Reports |
StockTalk |
News |
Chart |
Request a new note
C
A N
S L
I M
|
FFIV
-
NASDAQ
F 5 Networks Inc
INTERNET - Internet Software and Services
|
$138.07
|
+0.78
0.57% |
$139.18
|
1,995,489
73.33% of 50 DAV
50 DAV is 2,721,400
|
$143.75
-3.95%
|
6/16/2010
|
$74.50
|
PP = $74.10
|
|
MB = $77.81
|
Most Recent Note - 1/5/2011 6:17:22 PM
G - Closed near the session high today perched -4.5% off its 52-week high. Recent lows define chart support just above its 50 DMA line.
>>> The latest Featured Stock Update with an annotated graph appeared on 12/28/2010. Click here.
View all notes |
Alert me of new notes |
CANSLIM.net Company Profile |
SEC |
Zacks Reports |
StockTalk |
News |
Chart |
Request a new note
C
A N
S L
I M
|
FOSL
-
NASDAQ
Fossil Inc
CONSUMER DURABLES - Recreational Goods, Other
|
$70.53
|
-1.47
-2.04% |
$71.98
|
985,695
126.58% of 50 DAV
50 DAV is 778,700
|
$74.34
-5.13%
|
11/26/2010
|
$69.10
|
PP = $70.17
|
|
MB = $73.68
|
Most Recent Note - 1/6/2011 4:28:05 PM
Y - Down today on above average volume, a sign of mild distributional pressure while consolidating just above its 50 DMA line. An upward trendline connecting its July - October lows also defines a support level to watch near its short-term average. Subsequent violations may trigger sell signals.
>>> The latest Featured Stock Update with an annotated graph appeared on 11/29/2010. Click here.
View all notes |
Alert me of new notes |
CANSLIM.net Company Profile |
SEC |
Zacks Reports |
StockTalk |
News |
Chart |
Request a new note
C
A N
S L
I M
|
Symbol/Exchange
Company Name
Industry Group |
PRICE |
CHANGE
(%Change) |
Day High |
Volume
(% DAV)
(% 50 day avg vol) |
52 Wk Hi
% From Hi |
Featured
Date |
Price
Featured |
Pivot Featured |
|
Max Buy |
HMSY
-
NASDAQ
H M S Holdings Corp
COMPUTER SOFTWARE and SERVICES - Healthcare Information Service
|
$63.65
|
-1.13
-1.74% |
$64.69
|
204,464
104.69% of 50 DAV
50 DAV is 195,300
|
$67.10
-5.14%
|
11/19/2010
|
$61.89
|
PP = $63.01
|
|
MB = $66.16
|
Most Recent Note - 1/6/2011 4:31:58 PM
G - Loss today with higher volume is a sign of distributional pressure while consolidating just above its 50 DMA line following a negative reversal on 12/22/10. Its waning Relative Strength rank has been noted as a concern. See the latest FSU analysis for additional details and an annotated graph.
>>> The latest Featured Stock Update with an annotated graph appeared on 1/3/2011. Click here.
View all notes |
Alert me of new notes |
CANSLIM.net Company Profile |
SEC |
Zacks Reports |
StockTalk |
News |
Chart |
Request a new note
C
A N
S L
I M
|
JOBS
-
NASDAQ
Fifty One Job Inc Ads
DIVERSIFIED SERVICES - Staffing and; Outsourcing Service
|
$52.49
|
+0.88
1.71% |
$52.94
|
88,074
51.15% of 50 DAV
50 DAV is 172,200
|
$55.50
-5.42%
|
10/13/2010
|
$42.07
|
PP = $40.60
|
|
MB = $42.63
|
Most Recent Note - 1/5/2011 6:23:50 PM
G - Consolidating just above its 50 DMA line, just -7% off its 52-week high. Volume totals have recently been cooling. It has not formed a sound new base, only consolidating for the past 4 weeks after recently challenging its all-time high near $55 from 2004.
>>> The latest Featured Stock Update with an annotated graph appeared on 12/30/2010. Click here.
View all notes |
Alert me of new notes |
CANSLIM.net Company Profile |
SEC |
Zacks Reports |
StockTalk |
News |
Chart |
Request a new note
C
A N
S L
I M
|
LULU
-
NASDAQ
Lululemon Athletica
MANUFACTURING - Textile Manufacturing
|
$66.99
|
-1.50
-2.19% |
$68.00
|
1,849,070
106.70% of 50 DAV
50 DAV is 1,733,000
|
$74.60
-10.20%
|
10/8/2010
|
$47.66
|
PP = $46.67
|
|
MB = $49.00
|
Most Recent Note - 1/6/2011 4:20:45 PM
G - Gapped down today and erased the prior session's gain, ending at its lowest close since quietly peaking on 12/20/10. It is extended from its 50 DMA line and more time is needed for a potential new base to form.
>>> The latest Featured Stock Update with an annotated graph appeared on 12/1/2010. Click here.
View all notes |
Alert me of new notes |
CANSLIM.net Company Profile |
SEC |
Zacks Reports |
StockTalk |
News |
Chart |
Request a new note
C
A N
S L
I M
|
MWIV
-
NASDAQ
M W I Veterinary Supply
HEALTH SERVICES - Medical Instruments and; Supplies
|
$65.46
|
-0.06
-0.09% |
$65.74
|
49,564
93.87% of 50 DAV
50 DAV is 52,800
|
$65.92
-0.70%
|
11/4/2010
|
$61.79
|
PP = $59.60
|
|
MB = $62.58
|
Most Recent Note - 1/5/2011 6:27:07 PM
G - Gain today with above average volume helped it finish 3 cents below its best ever close. Its 50 DMA line defines support to watch.
>>> The latest Featured Stock Update with an annotated graph appeared on 12/21/2010. Click here.
View all notes |
Alert me of new notes |
CANSLIM.net Company Profile |
SEC |
Zacks Reports |
StockTalk |
News |
Chart |
Request a new note
C
A N
S L
I M
|
NEOG
-
NASDAQ
Neogen Corp
DRUGS - Diagnostic Substances
|
$39.00
|
-0.93
-2.33% |
$40.00
|
194,542
212.61% of 50 DAV
50 DAV is 91,500
|
$43.14
-9.60%
|
9/1/2010
|
$30.79
|
PP = $30.49
|
|
MB = $32.01
|
Most Recent Note - 1/6/2011 4:43:20 PM
G - Down today for a 3rd consecutive loss with above average volume. Slumping near its 50 DMA line which has been a reliable support level during past consolidations.
>>> The latest Featured Stock Update with an annotated graph appeared on 12/6/2010. Click here.
View all notes |
Alert me of new notes |
CANSLIM.net Company Profile |
SEC |
Zacks Reports |
StockTalk |
News |
Chart |
Request a new note
C
A N
S L
I M
|
Symbol/Exchange
Company Name
Industry Group |
PRICE |
CHANGE
(%Change) |
Day High |
Volume
(% DAV)
(% 50 day avg vol) |
52 Wk Hi
% From Hi |
Featured
Date |
Price
Featured |
Pivot Featured |
|
Max Buy |
NFLX
-
NASDAQ
Netflix Inc
SPECIALTY RETAIL - Music and Video Stores
|
$177.99
|
-1.74
-0.97% |
$179.67
|
4,570,779
77.72% of 50 DAV
50 DAV is 5,880,900
|
$206.80
-13.93%
|
11/9/2010
|
$173.10
|
PP = $184.84
|
|
MB = $194.08
|
Most Recent Note - 1/6/2011 4:46:12 PM
G - Still quietly hovering near its 50 DMA line and recent lows defining near-term support. More damaging losses could trigger more serious technical sell signals.
>>> The latest Featured Stock Update with an annotated graph appeared on 11/24/2010. Click here.
View all notes |
Alert me of new notes |
CANSLIM.net Company Profile |
SEC |
Zacks Reports |
StockTalk |
News |
Chart |
Request a new note
C
A N
S L
I M
|
NTAP
-
NASDAQ
Netapp Inc
COMPUTER HARDWARE - Data Storage Devices
|
$57.49
|
-0.38
-0.66% |
$58.64
|
4,680,826
82.96% of 50 DAV
50 DAV is 5,642,400
|
$58.12
-1.08%
|
1/6/2011
|
$57.49
|
PP = $58.06
|
|
MB = $60.96
|
Most Recent Note - 1/6/2011 5:01:46 PM
Y - Touched a new high quietly and then reversed into the red today. Color code is changed to yellow with new pivot point cited based on its 11/10/10 high plus 10 cents. Gains with +50% above average volume, ideally even greater volume, are needed behind a gain above its pivot point to trigger a convincing technical buy signal.
>>> The latest Featured Stock Update with an annotated graph appeared on 12/27/2010. Click here.
View all notes |
Alert me of new notes |
CANSLIM.net Company Profile |
SEC |
Zacks Reports |
StockTalk |
News |
Chart |
Request a new note
C
A N
S L
I M
|
OPEN
-
NASDAQ
Opentable Inc
INTERNET - Internet Software and Services
|
$76.10
|
+2.39
3.24% |
$76.49
|
1,896,310
236.68% of 50 DAV
50 DAV is 801,200
|
$76.39
-0.38%
|
1/5/2011
|
$74.05
|
PP = $76.79
|
|
MB = $80.63
|
Most Recent Note - 1/6/2011 5:07:06 PM
Y - Finished the session at a new high close after a second consecutive volume-driven gain. It was featured in yellow in the 1/05/10 mid-day report and covered in greater detail with a fresh annotated graph in the Featured Stock Update section.
>>> The latest Featured Stock Update with an annotated graph appeared on 1/5/2011. Click here.
View all notes |
Alert me of new notes |
CANSLIM.net Company Profile |
SEC |
Zacks Reports |
StockTalk |
News |
Chart |
Request a new note
C
A N
S L
I M
|
ORCL
-
NASDAQ
Oracle Corp
COMPUTER SOFTWARE and SERVICES - Application Software
|
$31.17
|
+0.13
0.42% |
$31.20
|
21,859,043
77.54% of 50 DAV
50 DAV is 28,189,100
|
$32.27
-3.41%
|
12/7/2010
|
$29.05
|
PP = $29.92
|
|
MB = $31.42
|
Most Recent Note - 1/5/2011 6:39:26 PM
G - Volume picked up behind today's loss as it closed below its "max buy" level near the session low, yet only -3.8% off its 52-week high. Support to watch is at prior chart highs and its 50 DMA line.
>>> The latest Featured Stock Update with an annotated graph appeared on 11/18/2010. Click here.
View all notes |
Alert me of new notes |
CANSLIM.net Company Profile |
SEC |
Zacks Reports |
StockTalk |
News |
Chart |
Request a new note
C
A N
S L
I M
|
PAY
-
NYSE
Verifone Systems Inc
COMPUTER HARDWARE - Transaction Automation Systems
|
$41.59
|
+0.13
0.31% |
$41.80
|
1,453,020
99.76% of 50 DAV
50 DAV is 1,456,500
|
$41.53
0.14%
|
11/29/2010
|
$33.96
|
PP = $36.04
|
|
MB = $37.84
|
Most Recent Note - 1/5/2011 6:40:15 PM
G - Powered higher on slightly above average volume for its best ever close. It has not formed a sound base. Prior high in the $36 area coincides with its 50 DMA line defining important near-term chart support to watch.
>>> The latest Featured Stock Update with an annotated graph appeared on 12/15/2010. Click here.
View all notes |
Alert me of new notes |
CANSLIM.net Company Profile |
SEC |
Zacks Reports |
StockTalk |
News |
Chart |
Request a new note
C
A N
S L
I M
|
Symbol/Exchange
Company Name
Industry Group |
PRICE |
CHANGE
(%Change) |
Day High |
Volume
(% DAV)
(% 50 day avg vol) |
52 Wk Hi
% From Hi |
Featured
Date |
Price
Featured |
Pivot Featured |
|
Max Buy |
PCLN
-
NASDAQ
Priceline.Com Inc
INTERNET - Internet Software and Services
|
$437.32
|
+3.72
0.86% |
$441.54
|
1,634,419
159.04% of 50 DAV
50 DAV is 1,027,700
|
$434.95
0.54%
|
11/1/2002
|
$399.55
|
PP = $428.20
|
|
MB = $449.61
|
Most Recent Note - 1/6/2011 4:39:22 PM
Y - Hit another new high today with a second consecutive volume-driven gain. Its considerable gain on 1/05/11 with heavy volume confirmed a technical buy signal as it rallied above the pivot point cited in the January 2011 CANSLIM.net News with detailed analysis and annotated daily and weekly graphs (read here).
>>> The latest Featured Stock Update with an annotated graph appeared on 1/2/2011. Click here.
View all notes |
Alert me of new notes |
CANSLIM.net Company Profile |
SEC |
Zacks Reports |
StockTalk |
News |
Chart |
Request a new note
C
A N
S L
I M
|
RAX
-
NYSE
Rackspace Hosting Inc
INTERNET - Internet Software and; Services
|
$31.24
|
-0.57
-1.79% |
$31.93
|
2,472,005
138.09% of 50 DAV
50 DAV is 1,790,100
|
$32.69
-4.44%
|
9/21/2010
|
$22.84
|
PP = $23.61
|
|
MB = $24.79
|
Most Recent Note - 1/6/2011 4:33:57 PM
G - Loss today with above average volume was a sign of more distribution. No resistance remains due to overhead supply, but it has not formed a sound new base pattern of sufficient length.
>>> The latest Featured Stock Update with an annotated graph appeared on 12/31/2010. Click here.
View all notes |
Alert me of new notes |
CANSLIM.net Company Profile |
SEC |
Zacks Reports |
StockTalk |
News |
Chart |
Request a new note
C
A N
S L
I M
|
ROVI
-
NASDAQ
Rovi Corp
COMPUTER SOFTWARE andamp; SERVICES - Security Software andamp; Services
|
$63.86
|
-1.80
-2.74% |
$65.76
|
3,537,836
300.76% of 50 DAV
50 DAV is 1,176,300
|
$67.00
-4.69%
|
10/29/2010
|
$49.99
|
PP = $53.10
|
|
MB = $55.76
|
Most Recent Note - 1/6/2011 1:21:16 PM
G - Pulling back today from its 52-week high. Above average and ever-increasing volume behind 8 consecutive gains has it now extended from a sound base. Its recent high near $58.50 and its 50 DMA line define chart support levels to watch.
>>> The latest Featured Stock Update with an annotated graph appeared on 12/13/2010. Click here.
View all notes |
Alert me of new notes |
CANSLIM.net Company Profile |
SEC |
Zacks Reports |
StockTalk |
News |
Chart |
Request a new note
C
A N
S L
I M
|
SHOO
-
NASDAQ
Steven Madden Limited
CONSUMER NON-DURABLES - Textile - Apparel Footwear
|
$41.35
|
-0.92
-2.18% |
$43.22
|
299,671
79.47% of 50 DAV
50 DAV is 377,100
|
$47.69
-13.29%
|
11/23/2010
|
$44.61
|
PP = $44.95
|
|
MB = $47.20
|
Most Recent Note - 1/6/2011 5:18:20 PM
G - Reversed for a loss after initially rallying up near its 50 DMA line today. Technical damage has raised concerns, while prior highs near $40 define the next chart support level to watch.
>>> The latest Featured Stock Update with an annotated graph appeared on 1/4/2011. Click here.
View all notes |
Alert me of new notes |
CANSLIM.net Company Profile |
SEC |
Zacks Reports |
StockTalk |
News |
Chart |
Request a new note
C
A N
S L
I M
|
SLW
-
NYSE
Silver Wheaton Corp
METALS and; MINING - Silver
|
$34.19
|
-2.46
-6.71% |
$36.61
|
14,204,587
135.56% of 50 DAV
50 DAV is 10,478,700
|
$42.34
-19.25%
|
8/25/2010
|
$21.40
|
PP = $21.99
|
|
MB = $23.09
|
Most Recent Note - 1/6/2011 3:58:55 PM
G - Slumping below its 50 DMA line, an important support level that it fought to stay above. It has violated the prior session low ($34.56) triggering a technical signal.
>>> The latest Featured Stock Update with an annotated graph appeared on 12/8/2010. Click here.
View all notes |
Alert me of new notes |
CANSLIM.net Company Profile |
SEC |
Zacks Reports |
StockTalk |
News |
Chart |
Request a new note
C
A N
S L
I M
|
Symbol/Exchange
Company Name
Industry Group |
PRICE |
CHANGE
(%Change) |
Day High |
Volume
(% DAV)
(% 50 day avg vol) |
52 Wk Hi
% From Hi |
Featured
Date |
Price
Featured |
Pivot Featured |
|
Max Buy |
UA
-
NYSE
Under Armour Inc Cl A
CONSUMER NON-DURABLES - Textile - Apparel Clothing
|
$54.64
|
-0.90
-1.62% |
$55.86
|
445,493
61.87% of 50 DAV
50 DAV is 720,000
|
$60.14
-9.15%
|
9/9/2010
|
$39.99
|
PP = $40.10
|
|
MB = $42.11
|
Most Recent Note - 1/5/2011 6:49:35 PM
G - Volume totals have been cooling while consolidating just above its 50 DMA line defining important support.
>>> The latest Featured Stock Update with an annotated graph appeared on 12/23/2010. Click here.
View all notes |
Alert me of new notes |
CANSLIM.net Company Profile |
SEC |
Zacks Reports |
StockTalk |
News |
Chart |
Request a new note
C
A N
S L
I M
|
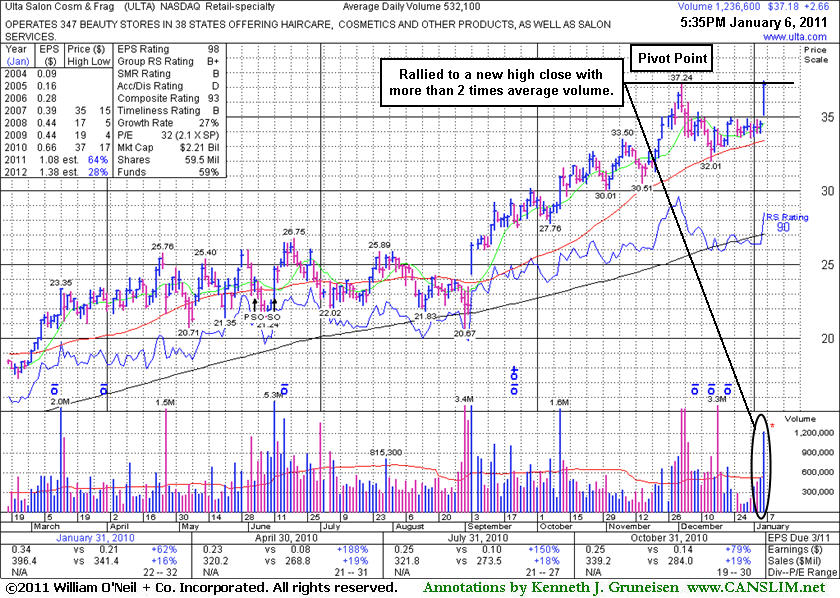
ULTA
-
NASDAQ
Ulta Salon Cosm & Frag
SPECIALTY RETAIL - Specialty Retail, Other
|
$37.18
|
+2.66
7.71% |
$37.48
|
1,240,660
234.04% of 50 DAV
50 DAV is 530,100
|
$37.24
-0.16%
|
1/6/2011
|
$36.12
|
PP = $37.34
|
|
MB = $39.21
|
Most Recent Note - 1/6/2011 3:56:58 PM
Y - Hit a new 52-week high today. Gapped up after reporting encouraging holiday sales data. Its 50 DMA acted as recent support and it is approaching its 52-week high after an orderly 6-week consolidation. Color code was changed to yellow with new pivot point cited based on its 52-week high plus 10 cents. Disciplined investors will resist the urge to get in "early" and watch for gains above the pivot point with at least +50% above average volume to trigger a new (or add-on) technical buy signal.
>>> The latest Featured Stock Update with an annotated graph appeared on 1/6/2011. Click here.
View all notes |
Alert me of new notes |
CANSLIM.net Company Profile |
SEC |
Zacks Reports |
StockTalk |
News |
Chart |
Request a new note
C
A N
S L
I M
|