***Last / Change / Volume data in this table is the closing quote data***
Symbol/Exchange
Company Name
Industry Group |
PRICE |
CHANGE
(%Change) |
Day High |
Volume
(% DAV)
(% 50 day avg vol) |
52 Wk Hi
% From Hi |
Featured
Date |
Price
Featured |
Pivot Featured |
|
Max Buy |
ABV
-
NYSE
Comp De Bebidas Adr
FOOD and BEVERAGE - Beverages - Brewers
|
$31.21
|
-0.58
-1.82% |
$31.89
|
3,333,994
121.92% of 50 DAV
50 DAV is 2,734,600
|
$32.00
-2.47%
|
12/10/2010
|
$139.87
|
PP = $145.46
|
|
MB = $152.73
|
Most Recent Note - 12/31/2010 5:49:22 PM
G - Reversed and closed near the session low today after hitting a new all-time high. Extended from its latest base pattern. Prior highs in the $29 area define important chart support to watch above its 50 DMA line. Do not be confused by the 5:1 split impacting its share price as of 12/28/10. (Previous data concerning Featured Price and Pivot Point will soon be adjusted).
>>> The latest Featured Stock Update with an annotated graph appeared on 12/3/2010. Click here.
View all notes |
Alert me of new notes |
CANSLIM.net Company Profile |
SEC |
Zacks Reports |
StockTalk |
News |
Chart |
Request a new note
C
A N
S L
I M


|
ARUN
-
NASDAQ
Aruba Networks Inc
COMPUTER HARDWARE - Networking andamp; Communication Dev
|
$22.92
|
+0.37
1.65% |
$23.00
|
2,338,140
99.84% of 50 DAV
50 DAV is 2,341,800
|
$24.28
-5.59%
|
1/3/2011
|
$22.55
|
PP = $24.38
|
|
MB = $25.60
|
Most Recent Note - 1/3/2011 7:54:25 PM
Y - Considerable gain today with heavy volume helped it rally back above its 50 DMA line ($22.31 now) and helped its outlook improve. Color code is changed to yellow with new pivot point cited based on its 52-week high plus 10 cents. Time is needed for it to prove a new (or add-on) technical buy signal from a sound new base, meanwhile recent lows in the $20.00 area define an important chart support level to watch.
>>> The latest Featured Stock Update with an annotated graph appeared on 12/14/2010. Click here.
View all notes |
Alert me of new notes |
CANSLIM.net Company Profile |
SEC |
Zacks Reports |
StockTalk |
News |
Chart |
Request a new note
C
A N
S L
I M
|
CACC
-
NASDAQ
Credit Acceptance Corp
FINANCIAL SERVICES - Credit Services
|
$61.65
|
-2.10
-3.29% |
$64.09
|
31,610
143.03% of 50 DAV
50 DAV is 22,100
|
$63.77
-3.32%
|
11/22/2010
|
$59.97
|
PP = $62.00
|
|
MB = $65.10
|
 Most Recent Note - 1/4/2011 2:44:12 PM
Y - Pulling back on lighter volume today, but erasing the progress made with above average volume behind 2 consecutive gains which helped it barely touch a new 52-week high. Its waning Relative Strength rank (77) is a concern, yet it remains below the long ago cited "max buy" level and it faces no resistance due to overhead supply.
>>> The latest Featured Stock Update with an annotated graph appeared on 12/20/2010. Click here.
View all notes |
Alert me of new notes |
CANSLIM.net Company Profile |
SEC |
Zacks Reports |
StockTalk |
News |
Chart |
Request a new note
C
A N
S L
I M
|
CIS
-
NYSE
Camelot Info Systems Ads
COMPUTER SOFTWARE andamp; SERVICES - Information Technology Service
|
$23.48
|
-0.80
-3.29% |
$24.71
|
463,246
114.35% of 50 DAV
50 DAV is 405,100
|
$25.50
-7.92%
|
11/26/2010
|
$18.93
|
PP = $19.72
|
|
MB = $20.71
|
Most Recent Note - 1/4/2011 12:48:33 PM
G - Pulling back today after a disappointing close in the lower half of its intra-day range on the prior session when it had touched a new all-time high with its early gain. No resistance remains due to overhead supply after a choppy 5-week consolidation above prior highs and its 50 DMA line, but it has not built a sound new base. On 12/09/10 it completed a Secondary Offering.
>>> The latest Featured Stock Update with an annotated graph appeared on 11/26/2010. Click here.
View all notes |
Alert me of new notes |
CANSLIM.net Company Profile |
SEC |
Zacks Reports |
StockTalk |
News |
Chart |
Request a new note
C
A N
S L
I M
|
CMG
-
NYSE
Chipotle Mexican Grill
LEISURE - Restaurants
|
$222.37
|
-1.26
-0.56% |
$228.47
|
1,324,709
122.04% of 50 DAV
50 DAV is 1,085,500
|
$262.78
-15.38%
|
9/1/2010
|
$158.31
|
PP = $155.52
|
|
MB = $163.30
|
Most Recent Note - 1/3/2011 5:02:33 PM
G - Considerable gain today with better and slightly above average volume, rallying back above the previously noted chart low ($221.41 on 12/14/10). Rising toward its still rising 50 DMA line which may now act as resistance. Technically, recent violations triggered sell signals and hinted that it may be due for a longer and deeper consolidation, while subsequent gains above its short-term average would help its outlook improve.
>>> The latest Featured Stock Update with an annotated graph appeared on 12/17/2010. Click here.
View all notes |
Alert me of new notes |
CANSLIM.net Company Profile |
SEC |
Zacks Reports |
StockTalk |
News |
Chart |
Request a new note
C
A N
S L
I M
|
Symbol/Exchange
Company Name
Industry Group |
PRICE |
CHANGE
(%Change) |
Day High |
Volume
(% DAV)
(% 50 day avg vol) |
52 Wk Hi
% From Hi |
Featured
Date |
Price
Featured |
Pivot Featured |
|
Max Buy |
DECK
-
NASDAQ
Deckers Outdoor Corp
CONSUMER NON-DURABLES - Textile - Apparel Footwear
|
$78.70
|
-2.53
-3.11% |
$82.43
|
2,205,827
115.50% of 50 DAV
50 DAV is 1,909,800
|
$87.88
-10.45%
|
10/27/2010
|
$54.16
|
PP = $54.86
|
|
MB = $57.60
|
Most Recent Note - 1/4/2011 2:49:33 PM
G - Consolidating in recent weeks after the impressive sprint following its late-October breakout when it was featured on 10/27/10. It is extended from a sound base, and still well above its 50 DMA line.
>>> The latest Featured Stock Update with an annotated graph appeared on 12/16/2010. Click here.
View all notes |
Alert me of new notes |
CANSLIM.net Company Profile |
SEC |
Zacks Reports |
StockTalk |
News |
Chart |
Request a new note
C
A N
S L
I M
|
EZCH
-
NASDAQ
Ezchip Semiconductor Ltd
ELECTRONICS - Semiconductor - Specialized
|
$30.51
|
+0.73
2.45% |
$30.61
|
446,088
172.50% of 50 DAV
50 DAV is 258,600
|
$30.00
1.70%
|
12/2/2010
|
$27.53
|
PP = $26.00
|
|
MB = $27.30
|
Most Recent Note - 1/4/2011 12:56:33 PM
G - Inching to new 52-week highs this week following a healthy consolidation. Prior chart highs in the $26 area coincide with its 50 DMA line defining an important technical support level to watch.
>>> The latest Featured Stock Update with an annotated graph appeared on 12/2/2010. Click here.
View all notes |
Alert me of new notes |
CANSLIM.net Company Profile |
SEC |
Zacks Reports |
StockTalk |
News |
Chart |
Request a new note
C
A N
S L
I M
|
EZPW
-
NASDAQ
Ezcorp Inc Cl A
SPECIALTY RETAIL - Specialty Retail, Other
|
$27.49
|
-0.42
-1.50% |
$28.36
|
510,796
145.69% of 50 DAV
50 DAV is 350,600
|
$28.75
-4.38%
|
11/5/2010
|
$24.02
|
PP = $23.85
|
|
MB = $25.04
|
Most Recent Note - 1/3/2011 5:33:00 PM
G - Gapped up today for a solid gain on higher volume, finishing only -2.9% off its 52-week high and 37 cents off its best ever close. Extended from a sound base pattern, its 50 DMA line defines important support. See the latest FSU analysis for details and an annotated graph.
>>> The latest Featured Stock Update with an annotated graph appeared on 12/29/2010. Click here.
View all notes |
Alert me of new notes |
CANSLIM.net Company Profile |
SEC |
Zacks Reports |
StockTalk |
News |
Chart |
Request a new note
C
A N
S L
I M
|
FFIV
-
NASDAQ
F 5 Networks Inc
INTERNET - Internet Software and Services
|
$132.07
|
-2.26
-1.68% |
$135.96
|
1,442,264
52.39% of 50 DAV
50 DAV is 2,752,700
|
$143.75
-8.13%
|
6/16/2010
|
$74.50
|
PP = $74.10
|
|
MB = $77.81
|
Most Recent Note - 1/3/2011 5:36:55 PM
G - Volume was higher behind today's gap up gain, but still the total was below average. It is perched -6.6% off its 52-week high. Recent lows define chart support just above its 50 DMA line.
>>> The latest Featured Stock Update with an annotated graph appeared on 12/28/2010. Click here.
View all notes |
Alert me of new notes |
CANSLIM.net Company Profile |
SEC |
Zacks Reports |
StockTalk |
News |
Chart |
Request a new note
C
A N
S L
I M
|
FOSL
-
NASDAQ
Fossil Inc
CONSUMER DURABLES - Recreational Goods, Other
|
$72.59
|
-0.10
-0.14% |
$73.19
|
702,773
89.93% of 50 DAV
50 DAV is 781,500
|
$74.34
-2.35%
|
11/26/2010
|
$69.10
|
PP = $70.17
|
|
MB = $73.68
|
Most Recent Note - 1/3/2011 5:41:29 PM
Y - Gapped up today for a gain with below average volume, finishing the session less than a dollar from its highest ever closes and still below its "max buy" level. It stalled following its technical breakout on 12/02/10 from an advanced "3-weeks tight" pattern. Its 50 DMA line defines important support to watch.
>>> The latest Featured Stock Update with an annotated graph appeared on 11/29/2010. Click here.
View all notes |
Alert me of new notes |
CANSLIM.net Company Profile |
SEC |
Zacks Reports |
StockTalk |
News |
Chart |
Request a new note
C
A N
S L
I M
|
Symbol/Exchange
Company Name
Industry Group |
PRICE |
CHANGE
(%Change) |
Day High |
Volume
(% DAV)
(% 50 day avg vol) |
52 Wk Hi
% From Hi |
Featured
Date |
Price
Featured |
Pivot Featured |
|
Max Buy |
HMSY
-
NASDAQ
H M S Holdings Corp
COMPUTER SOFTWARE and SERVICES - Healthcare Information Service
|
$63.61
|
-1.69
-2.59% |
$66.27
|
258,702
135.23% of 50 DAV
50 DAV is 191,300
|
$67.10
-5.20%
|
11/19/2010
|
$61.89
|
PP = $63.01
|
|
MB = $66.16
|
Most Recent Note - 1/3/2011 7:48:21 PM
G - Quietly holding its ground -2.7% off its high since a negative reversal on 12/22/10. Its Relative Strength rank of 64 now is a concern. See the latest FSU analysis for additional details and an annotated graph.
>>> The latest Featured Stock Update with an annotated graph appeared on 1/3/2011. Click here.
View all notes |
Alert me of new notes |
CANSLIM.net Company Profile |
SEC |
Zacks Reports |
StockTalk |
News |
Chart |
Request a new note
C
A N
S L
I M
|
JOBS
-
NASDAQ
Fifty One Job Inc Ads
DIVERSIFIED SERVICES - Staffing and; Outsourcing Service
|
$50.82
|
-0.34
-0.66% |
$51.99
|
88,348
51.54% of 50 DAV
50 DAV is 171,400
|
$55.50
-8.43%
|
10/13/2010
|
$42.07
|
PP = $40.60
|
|
MB = $42.63
|
Most Recent Note - 1/3/2011 5:29:06 PM
G - Gapped up today for a gain on light volume after staying above its 50 DMA line last week. Volume totals have recently been cooling. It has not formed a sound new base, only consolidating for the past 3 weeks after recently challenging its all-time high near $55 from 2004.
>>> The latest Featured Stock Update with an annotated graph appeared on 12/30/2010. Click here.
View all notes |
Alert me of new notes |
CANSLIM.net Company Profile |
SEC |
Zacks Reports |
StockTalk |
News |
Chart |
Request a new note
C
A N
S L
I M
|
LULU
-
NASDAQ
Lululemon Athletica
MANUFACTURING - Textile Manufacturing
|
$67.20
|
-4.38
-6.12% |
$71.74
|
3,531,758
213.27% of 50 DAV
50 DAV is 1,656,000
|
$74.60
-9.92%
|
10/8/2010
|
$47.66
|
PP = $46.67
|
|
MB = $49.00
|
Most Recent Note - 1/4/2011 1:18:23 PM
G - Down for a considerable loss today with volume picking up, enduring distributional pressure. There is no near-term chart support, meanwhile it is extended from its 50 DMA line.
>>> The latest Featured Stock Update with an annotated graph appeared on 12/1/2010. Click here.
View all notes |
Alert me of new notes |
CANSLIM.net Company Profile |
SEC |
Zacks Reports |
StockTalk |
News |
Chart |
Request a new note
C
A N
S L
I M
|
MWIV
-
NASDAQ
M W I Veterinary Supply
HEALTH SERVICES - Medical Instruments and; Supplies
|
$64.11
|
-0.52
-0.80% |
$65.08
|
40,391
75.22% of 50 DAV
50 DAV is 53,700
|
$65.84
-2.63%
|
11/4/2010
|
$61.79
|
PP = $59.60
|
|
MB = $62.58
|
Most Recent Note - 12/31/2010 6:15:30 PM
G - Pulling back from its 52-week high, today it closed near the session low with volume light behind a 4th consecutive small loss. It paused since 12/27/10 following a streak of 6 consecutive gains with higher volume totals.
>>> The latest Featured Stock Update with an annotated graph appeared on 12/21/2010. Click here.
View all notes |
Alert me of new notes |
CANSLIM.net Company Profile |
SEC |
Zacks Reports |
StockTalk |
News |
Chart |
Request a new note
C
A N
S L
I M
|
NEOG
-
NASDAQ
Neogen Corp
DRUGS - Diagnostic Substances
|
$41.43
|
-0.83
-1.96% |
$43.14
|
457,223
568.69% of 50 DAV
50 DAV is 80,400
|
$42.61
-2.77%
|
9/1/2010
|
$30.79
|
PP = $30.49
|
|
MB = $32.01
|
Most Recent Note - 1/4/2011 1:27:32 PM
G - Down today on heavy volume, it nearly tested its 50 DMA line which has been a reliable support level. It reported earnings +30% on +25% sales revenues for the quarter ended November 30, 2010 versus the year ago period.
>>> The latest Featured Stock Update with an annotated graph appeared on 12/6/2010. Click here.
View all notes |
Alert me of new notes |
CANSLIM.net Company Profile |
SEC |
Zacks Reports |
StockTalk |
News |
Chart |
Request a new note
C
A N
S L
I M
|
Symbol/Exchange
Company Name
Industry Group |
PRICE |
CHANGE
(%Change) |
Day High |
Volume
(% DAV)
(% 50 day avg vol) |
52 Wk Hi
% From Hi |
Featured
Date |
Price
Featured |
Pivot Featured |
|
Max Buy |
NFLX
-
NASDAQ
Netflix Inc
SPECIALTY RETAIL - Music and Video Stores
|
$181.37
|
+2.96
1.66% |
$184.90
|
6,295,978
103.20% of 50 DAV
50 DAV is 6,101,000
|
$206.80
-12.30%
|
11/9/2010
|
$173.10
|
PP = $184.84
|
|
MB = $194.08
|
Most Recent Note - 12/31/2010 6:18:36 PM
G - Small loss today with light volume led to technically violating its 50 DMA line for the first time since early-August, raising some concerns. As it trades near recent lows defining near-term support, more damaging losses could trigger more serious technical sell signals.
>>> The latest Featured Stock Update with an annotated graph appeared on 11/24/2010. Click here.
View all notes |
Alert me of new notes |
CANSLIM.net Company Profile |
SEC |
Zacks Reports |
StockTalk |
News |
Chart |
Request a new note
C
A N
S L
I M
|
NTAP
-
NASDAQ
Netapp Inc
COMPUTER HARDWARE - Data Storage Devices
|
$57.38
|
-0.03
-0.05% |
$57.78
|
5,877,376
105.72% of 50 DAV
50 DAV is 5,559,200
|
$57.96
-1.00%
|
9/8/2010
|
$46.98
|
PP = $44.99
|
|
MB = $47.24
|
Most Recent Note - 1/3/2011 5:23:04 PM
G - Today's gain with +34% above average volume led to a new high close, rising from what some have labeled a "cup-with-handle" base. However, a flaw in that setup pattern is that the pullback following its 12/13/10 high of $56.55 led to a retracement below the middle point of the overall cup's depth. After high-volume whipsaw action in mid-November the volume totals have been generally cooling, and it found support near its 50 DMA line, working on building a new base. No overhead supply remains to hinder its progress.
>>> The latest Featured Stock Update with an annotated graph appeared on 12/27/2010. Click here.
View all notes |
Alert me of new notes |
CANSLIM.net Company Profile |
SEC |
Zacks Reports |
StockTalk |
News |
Chart |
Request a new note
C
A N
S L
I M
|
ORCL
-
NASDAQ
Oracle Corp
COMPUTER SOFTWARE and SERVICES - Application Software
|
$31.48
|
-0.14
-0.44% |
$31.75
|
22,870,587
80.97% of 50 DAV
50 DAV is 28,246,100
|
$32.27
-2.45%
|
12/7/2010
|
$29.05
|
PP = $29.92
|
|
MB = $31.42
|
Most Recent Note - 12/31/2010 6:20:59 PM
G - Volume remains very light while stubbornly holding its ground in a tight range -3% off its 52-week high. Extended from a sound base, with support at prior chart highs and its 50 DMA line.
>>> The latest Featured Stock Update with an annotated graph appeared on 11/18/2010. Click here.
View all notes |
Alert me of new notes |
CANSLIM.net Company Profile |
SEC |
Zacks Reports |
StockTalk |
News |
Chart |
Request a new note
C
A N
S L
I M
|
PAY
-
NYSE
Verifone Systems Inc
COMPUTER HARDWARE - Transaction Automation Systems
|
$39.47
|
-0.27
-0.68% |
$39.96
|
1,176,470
80.28% of 50 DAV
50 DAV is 1,465,500
|
$41.47
-4.82%
|
11/29/2010
|
$33.96
|
PP = $36.04
|
|
MB = $37.84
|
Most Recent Note - 1/3/2011 5:46:05 PM
G - Powered higher on near average volume today, closing -4.2% off its all-time high. It has not formed a sound base. Prior high in the $36 area coincides with its 50 DMA line defining important near-term chart support to watch.
>>> The latest Featured Stock Update with an annotated graph appeared on 12/15/2010. Click here.
View all notes |
Alert me of new notes |
CANSLIM.net Company Profile |
SEC |
Zacks Reports |
StockTalk |
News |
Chart |
Request a new note
C
A N
S L
I M
|
PCLN
-
NASDAQ
Priceline.Com Inc
INTERNET - Internet Software and Services
|
$409.38
|
-6.61
-1.59% |
$417.62
|
1,088,246
105.22% of 50 DAV
50 DAV is 1,034,300
|
$428.10
-4.37%
|
11/1/2002
|
$399.55
|
PP = $428.20
|
|
MB = $449.61
|
Most Recent Note - 1/3/2011 5:26:41 PM
Y - Considerable gap up gain today with higher volume helped it rally from its 50 DMA line toward its best prior closes in the $420 area. Returned to the Featured Stocks list with its appearance in the January 2011 CANSLIM.net News (read here) including detailed analysis and annotated daily and weekly graphs.
>>> The latest Featured Stock Update with an annotated graph appeared on 1/2/2011. Click here.
View all notes |
Alert me of new notes |
CANSLIM.net Company Profile |
SEC |
Zacks Reports |
StockTalk |
News |
Chart |
Request a new note
C
A N
S L
I M
|
Symbol/Exchange
Company Name
Industry Group |
PRICE |
CHANGE
(%Change) |
Day High |
Volume
(% DAV)
(% 50 day avg vol) |
52 Wk Hi
% From Hi |
Featured
Date |
Price
Featured |
Pivot Featured |
|
Max Buy |
RAX
-
NYSE
Rackspace Hosting Inc
INTERNET - Internet Software and; Services
|
$30.44
|
-0.99
-3.15% |
$32.42
|
2,219,752
124.20% of 50 DAV
50 DAV is 1,787,200
|
$32.69
-6.88%
|
9/21/2010
|
$22.84
|
PP = $23.61
|
|
MB = $24.79
|
Most Recent Note - 1/4/2011 2:39:12 PM
G - Reversed into the red today after early gains had it poised for a new all-time high close. No resistance remains due to overhead supply, but it stalled after its 12/10/10 volume-driven gain and is enduring mild distributional pressure while currently extended from a sound base pattern.
>>> The latest Featured Stock Update with an annotated graph appeared on 12/31/2010. Click here.
View all notes |
Alert me of new notes |
CANSLIM.net Company Profile |
SEC |
Zacks Reports |
StockTalk |
News |
Chart |
Request a new note
C
A N
S L
I M
|
ROVI
-
NASDAQ
Rovi Corp
COMPUTER SOFTWARE andamp; SERVICES - Security Software andamp; Services
|
$64.03
|
+0.92
1.46% |
$64.18
|
1,812,377
157.86% of 50 DAV
50 DAV is 1,148,100
|
$63.87
0.25%
|
10/29/2010
|
$49.99
|
PP = $53.10
|
|
MB = $55.76
|
Most Recent Note - 1/3/2011 5:49:20 PM
G - Hit yet another new 52-week high today with above average volume behind a 6th consecutive gain. Extended from a sound base, meanwhile its 50 DMA line defines support just below a recent chart low ($55.65 on 12/23/10).
>>> The latest Featured Stock Update with an annotated graph appeared on 12/13/2010. Click here.
View all notes |
Alert me of new notes |
CANSLIM.net Company Profile |
SEC |
Zacks Reports |
StockTalk |
News |
Chart |
Request a new note
C
A N
S L
I M
|
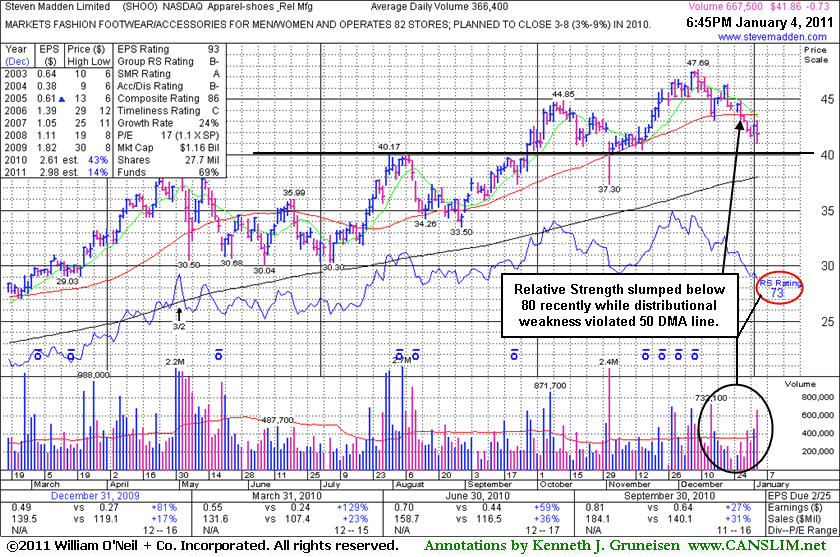
SHOO
-
NASDAQ
Steven Madden Limited
CONSUMER NON-DURABLES - Textile - Apparel Footwear
|
$41.86
|
-0.73
-1.71% |
$43.11
|
667,536
184.50% of 50 DAV
50 DAV is 361,800
|
$47.69
-12.22%
|
11/23/2010
|
$44.61
|
PP = $44.95
|
|
MB = $47.20
|
Most Recent Note - 1/4/2011 2:34:33 PM
G - Down with above average volume today, slumping further below its 50 DMA line and prior lows and raising greater concerns as technical damage mounts. Prior highs near $40 define the nearest chart support.
>>> The latest Featured Stock Update with an annotated graph appeared on 1/4/2011. Click here.
View all notes |
Alert me of new notes |
CANSLIM.net Company Profile |
SEC |
Zacks Reports |
StockTalk |
News |
Chart |
Request a new note
C
A N
S L
I M
|
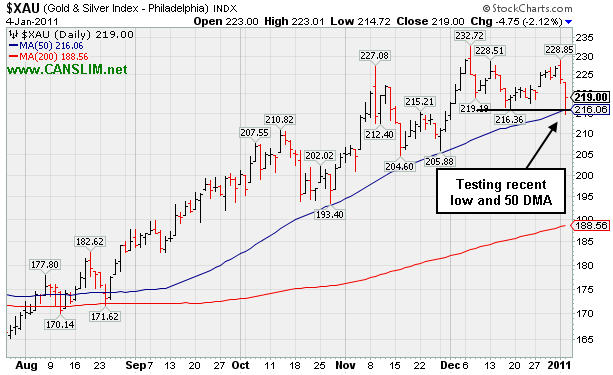
SLW
-
NYSE
Silver Wheaton Corp
METALS and; MINING - Silver
|
$36.64
|
-1.94
-5.03% |
$38.47
|
15,138,813
147.75% of 50 DAV
50 DAV is 10,246,500
|
$42.34
-13.46%
|
8/25/2010
|
$21.40
|
PP = $21.99
|
|
MB = $23.09
|
Most Recent Note - 1/4/2011 2:30:24 PM
G - Damaging loss today with heavier volume raises concerns after recently rallying without great volume conviction while consolidating since its negative reversal at an all-time high on 12/07/10. Recent chart low and its 50 DMA line define support to watch near the $35 area.
>>> The latest Featured Stock Update with an annotated graph appeared on 12/8/2010. Click here.
View all notes |
Alert me of new notes |
CANSLIM.net Company Profile |
SEC |
Zacks Reports |
StockTalk |
News |
Chart |
Request a new note
C
A N
S L
I M
|
UA
-
NYSE
Under Armour Inc Cl A
CONSUMER NON-DURABLES - Textile - Apparel Clothing
|
$54.65
|
-0.92
-1.66% |
$56.11
|
613,807
85.92% of 50 DAV
50 DAV is 714,400
|
$60.14
-9.13%
|
9/9/2010
|
$39.99
|
PP = $40.10
|
|
MB = $42.11
|
Most Recent Note - 12/31/2010 3:32:53 PM
G - Volume totals have been cooling while consolidating near its 50 DMA line ($53.42 now) defining important support.
>>> The latest Featured Stock Update with an annotated graph appeared on 12/23/2010. Click here.
View all notes |
Alert me of new notes |
CANSLIM.net Company Profile |
SEC |
Zacks Reports |
StockTalk |
News |
Chart |
Request a new note
C
A N
S L
I M
|
Symbol/Exchange
Company Name
Industry Group |
PRICE |
CHANGE
(%Change) |
Day High |
Volume
(% DAV)
(% 50 day avg vol) |
52 Wk Hi
% From Hi |
Featured
Date |
Price
Featured |
Pivot Featured |
|
Max Buy |
ULTA
-
NASDAQ
Ulta Salon Cosm & Frag
SPECIALTY RETAIL - Specialty Retail, Other
|
$34.28
|
-0.04
-0.12% |
$34.84
|
473,803
90.45% of 50 DAV
50 DAV is 523,800
|
$37.24
-7.95%
|
9/3/2010
|
$26.36
|
PP = $25.89
|
|
MB = $27.18
|
Most Recent Note - 12/31/2010 3:34:23 PM
G - Volume totals are still cooling while consolidating just above its 50 DMA line. Subsequent deterioration below it or the most recent chart low ($32.01 on 12/15/10) could raise concerns and trigger technical sell signals.
>>> The latest Featured Stock Update with an annotated graph appeared on 12/22/2010. Click here.
View all notes |
Alert me of new notes |
CANSLIM.net Company Profile |
SEC |
Zacks Reports |
StockTalk |
News |
Chart |
Request a new note
C
A N
S L
I M
|