You are not logged in.
This means you
CAN ONLY VIEW reports that were published prior to Monday, April 14, 2025.
You
MUST UPGRADE YOUR MEMBERSHIP if you want to see any current reports.
AFTER MARKET UPDATE - TUESDAY, JANUARY 3RD, 2012
Previous After Market Report Next After Market Report >>>
|
|
|
|
DOW |
+179.82 |
12,397.38 |
+1.47% |
|
Volume |
855,118,190 |
+45% |
|
Volume |
1,606,541,190 |
+58% |
|
NASDAQ |
+43.57 |
2,648.72 |
+1.67% |
|
Advancers |
2,349 |
75% |
|
Advancers |
1,922 |
72% |
|
S&P 500 |
+19.46 |
1,277.06 |
+1.55% |
|
Decliners |
702 |
22% |
|
Decliners |
694 |
26% |
|
Russell 2000 |
+11.36 |
752.28 |
+1.53% |
|
52 Wk Highs |
202 |
|
|
52 Wk Highs |
75 |
|
|
S&P 600 |
+6.48 |
421.55 |
+1.56% |
|
52 Wk Lows |
5 |
|
|
52 Wk Lows |
31 |
|
|
 |
Major Averages Pop Cork on New Year With Gains
Kenneth J. Gruneisen - Passed the CAN SLIM® Master's Exam
Wall Street rang in the New Year with a rally but the major averages finished off the session's early highs. The volume totals rose behind Tuesday's gains both on the NYSE and on the Nasdaq exchange, up from Friday's session, yet the totals remained lighter than average. Breadth was positive as advancers led decliners by more than 3-1 on the NYSE and by nearly 3-1 on the Nasdaq exchange. New 52-week highs outnumbered new 52-week lows on the NYSE, and new highs took the lead on the Nasdaq exchange again. There were 79 high-ranked companies from the CANSLIM.net Leaders List that made new 52-week highs and appeared on the CANSLIM.net BreakOuts Page, more than doubling the prior session total of 32 stocks.
Many media outlets raved about the first session of the new year and its positive action, however, many stocks including market leaders erased the bulk of the session's early gains and some issues ended with worrisome negative reversals. There were gains for 9 of the 17 high-ranked companies currently included on the Featured Stocks Page. Of the 79 stocks that hit new 52-week highs and appeared on the CANSLIM.net BreakOuts Page, only 18 of them actually finished the session above their old highs.
Setting the positive tone to start 2012 were better-than-expected manufacturing data out of Asia and Europe. The market extended its gain after reports showed U.S. factory output expanded at its fastest pace in six months and construction spending rose 1.2% in November. The release of the December FOMC meeting minutes revealed the central bank will increase transparency by issuing individual policymakers fed funds forecasts starting in January.
Economically sensitive stocks led the market's advance. Financials rose with Dow components Bank of America Corp (BAC +4.32%) and JP Morgan Chase & Co (JPM +5.20%) gaining. The positive manufacturing data boosted industrial and energy stocks higher. Shares of Caterpillar Inc (CAT +3.73%) and ConocoPhillips (COP +1.78%) climbed. Optimism over the global economy dampened demand for defensive stocks. Utilities sat out move with Exelon (EXC -3.00%) down following an analyst downgrade of the shares.
The Q4 2011 CANSLIM.net Webcast aired on Wednesday, December 28th at 8PM EST and is now available "ON DEMAND" to all upgraded members at no additional cost. Via the Premium Member Homepage links to all prior reports and webcasts are always available.
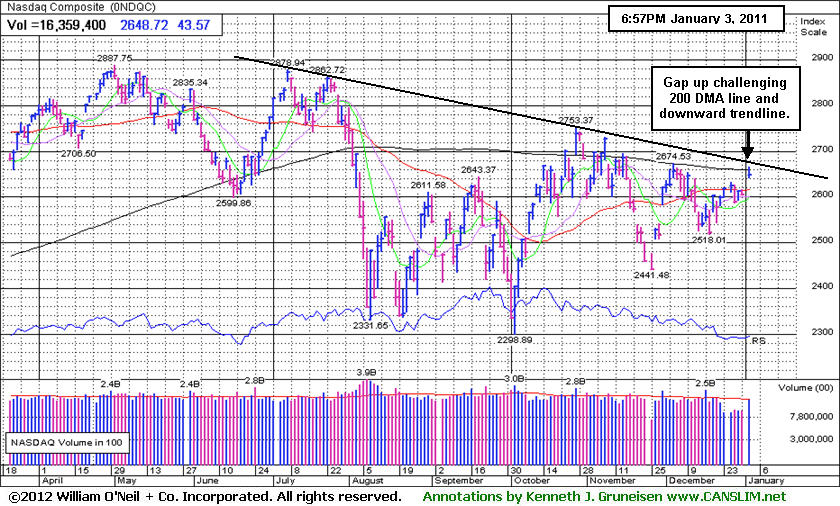
PICTURED: The Nasdaq Composite Index gapped up for a solid gain that challenged its 200-day moving average line and multi-month downward trendline. Those levels define a very important resistance area, and subsequent gains above them would be a more convincing and reassuring sign of technical strength returning to the market.
|
 Kenneth J. Gruneisen started out as a licensed stockbroker in August 1987, a couple of months prior to the historic stock market crash that took the Dow Jones Industrial Average down -22.6% in a single day. He has published daily fact-based fundamental and technical analysis on high-ranked stocks online for two decades. Through FACTBASEDINVESTING.COM, Kenneth provides educational articles, news, market commentary, and other information regarding proven investment systems that work in good times and bad.
Comments contained in the body of this report are technical opinions only and are not necessarily those of Gruneisen Growth Corp. The material herein has been obtained from sources believed to be reliable and accurate, however, its accuracy and completeness cannot be guaranteed. Our firm, employees, and customers may effect transactions, including transactions contrary to any recommendation herein, or have positions in the securities mentioned herein or options with respect thereto. Any recommendation contained in this report may not be suitable for all investors and it is not to be deemed an offer or solicitation on our part with respect to the purchase or sale of any securities. |
|
 |
Financial and Commodity-Linked Groups Led Gainers
Kenneth J. Gruneisen - Passed the CAN SLIM® Master's Exam
Financial and commodity-linked groups led Tuesday's gainers. The Bank Index ($BKX +3.28%) and Broker/Dealer Index ($XBD +3.63%) tallied big gains that underpinned the major averages' advance, and the Gold & Silver Index ($XAU +4.79%), Oil Services Index ($OSX +3.87%), and Integrated Oil Index ($XOI +2.58%) spurted higher. The tech sector saw unanimous gains from the Semiconductor Index ($SOX +1.14%), Biotechnology Index ($BTK +1.18%), Internet Index ($IIX +2.27%), and Networking Index ($NWX +2.97%). The Healthcare Index ($HMO +1.36%) rounded out the widely positive session while the Retail Index ($RLX +0.67%) was a relative laggard as it posted a small gain.
Charts courtesy www.stockcharts.com
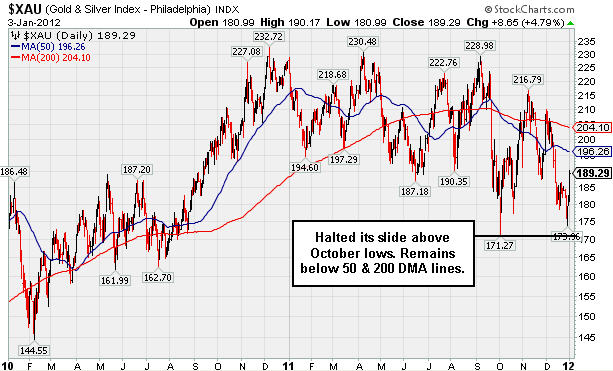
PICTURED: The Gold & Silver Index ($XAU +4.79%) was a standout gainer. It halted its slide above its October lows. It remains below its 50-day and 200-day moving average (DMA) lines.
| Oil Services |
$OSX |
224.66 |
+8.38 |
+3.87% |
+3.87% |
| Healthcare |
$HMO |
2,312.55 |
+30.94 |
+1.36% |
+1.36% |
| Integrated Oil |
$XOI |
1,260.77 |
+31.66 |
+2.58% |
+2.58% |
| Semiconductor |
$SOX |
368.60 |
+4.16 |
+1.14% |
+1.14% |
| Networking |
$NWX |
221.54 |
+6.39 |
+2.97% |
+2.97% |
| Internet |
$IIX |
288.14 |
+6.40 |
+2.27% |
+2.27% |
| Broker/Dealer |
$XBD |
86.30 |
+3.02 |
+3.63% |
+3.63% |
| Retail |
$RLX |
526.70 |
+3.50 |
+0.67% |
+0.67% |
| Gold & Silver |
$XAU |
189.29 |
+8.65 |
+4.79% |
+4.79% |
| Bank |
$BKX |
40.67 |
+1.29 |
+3.28% |
+3.28% |
| Biotech |
$BTK |
1,104.30 |
+12.88 |
+1.18% |
+1.18% |
|
|
|
 |
Familiar Financial Name Returns to Featured Stocks Page
Kenneth J. Gruneisen - Passed the CAN SLIM® Master's Exam
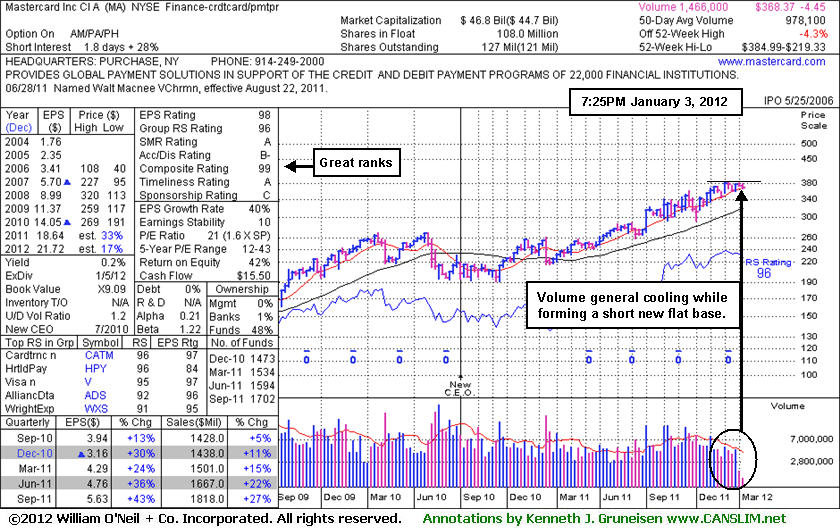
Mastercard Inc Cl A (MA -$4.45 or -1.19% to $368.37) is forming a short flat base pattern, but it encountered distributional pressure today while consolidating within close striking distance of its all-time high. While building on a riskier late-stage base, in the mid-day report (read here) it was highlighted in yellow with new pivot point cited based on its 52-week high plus 10 cents. Disciplined investors may watch for volume-driven gains above its pivot point to subsequently trigger a convincing technical buy signal. Proof of fresh institutional buying demand is a critical reassurance to watch for. Patience is required in the interim, as there is no assurance a breakout will occur.
Its last FSU appearance was on 9/12/11 with an annotated graph under the headline, "Conviction Questionable But Consolidation Has Look Of New Base." Afterward it indeed broke out, but soon it failed and triggered technical sell signals while violating its 50-day moving average line with damaging losses. It was dropped from the Featured Stocks page on October 4th. Based on its resilience it has again returned to the Featured Stocks page as a worthy looking candidate in the strong Finance - Credit Card/Payment Processing group, joining its peer Visa Inc (V) on that list of noteworthy and potentially action-worthy leaders.
It has been showing impressive sales revenues acceleration and strong quarterly earnings increases, especially with the latest September 2011 quarter showing a +43% earnings increase on +27% sales revenues. Bigger percentage increases in the recent quarterly comparisons, sequentially, are a sign the company has been building great momentum. It has maintained a strong annual earnings (A criteria) history.
|
|
|
Color Codes Explained :
Y - Better candidates highlighted by our
staff of experts.
G - Previously featured
in past reports as yellow but may no longer be buyable under the
guidelines.
***Last / Change / Volume data in this table is the closing quote data***
Symbol/Exchange
Company Name
Industry Group |
PRICE |
CHANGE
(%Change) |
Day High |
Volume
(% DAV)
(% 50 day avg vol) |
52 Wk Hi
% From Hi |
Featured
Date |
Price
Featured |
Pivot Featured |
|
Max Buy |
ADS
-
NYSE
Alliance Data Sys Corp
COMPUTER SOFTWARE and SERVICES - Information and Delivery Service
|
$102.76
|
-1.08
-1.04% |
$105.25
|
1,661,305
220.98% of 50 DAV
50 DAV is 751,800
|
$107.33
-4.26%
|
10/21/2011
|
$97.94
|
PP = $101.15
|
|
MB = $106.21
|
 Most Recent Note - 1/3/2012 11:57:42 AM
Y - Churning above average volume today without making meaningful price progress while still perched within close striking distance of its all-time high. Its 50 DMA line defines important near-term chart support.
>>> The latest Featured Stock Update with an annotated graph appeared on 12/14/2011. Click here.
View all notes |
Alert me of new notes |
CANSLIM.net Company Profile |
SEC |
Zacks Reports |
StockTalk |
News |
Chart |
Request a new note
C
A N
S L
I M


|
ALXN
-
NASDAQ
Alexion Pharmaceuticals
DRUGS - Drug Manufacturers - Other
|
$70.57
|
-0.93
-1.30% |
$72.67
|
1,489,785
123.80% of 50 DAV
50 DAV is 1,203,400
|
$72.25
-2.33%
|
11/30/2011
|
$68.66
|
PP = $70.52
|
|
MB = $74.05
|
Most Recent Note - 12/27/2011 12:09:14 PM
Y - Rallying to new all-time high territory and above its pivot point with today's gain. A strong close with at least +40% above average volume or more may clinch a new technical buy signal. Recent lows near $62 define important near-term support to watch.
>>> The latest Featured Stock Update with an annotated graph appeared on 12/12/2011. Click here.
View all notes |
Alert me of new notes |
CANSLIM.net Company Profile |
SEC |
Zacks Reports |
StockTalk |
News |
Chart |
Request a new note
C
A N
S L
I M
|
CATM
-
NASDAQ
Cardtronics Inc
DIVERSIFIED SERVICES - Business/Management Services
|
$27.24
|
+0.18
0.67% |
$28.03
|
441,434
128.89% of 50 DAV
50 DAV is 342,500
|
$28.74
-5.22%
|
12/23/2011
|
$28.64
|
PP = $28.56
|
|
MB = $29.99
|
Most Recent Note - 12/28/2011 5:22:32 PM
Y - Down today for a 2nd consecutive loss on near average volume, slumping further below the pivot point cited. Its 50 DMA line defines important chart support to watch.
>>> The latest Featured Stock Update with an annotated graph appeared on 12/23/2011. Click here.
View all notes |
Alert me of new notes |
CANSLIM.net Company Profile |
SEC |
Zacks Reports |
StockTalk |
News |
Chart |
Request a new note
C
A N
S L
I M
|
CELG
-
NASDAQ
Celgene Corp
DRUGS - Drug Manufacturers - Major
|
$68.66
|
+1.06
1.57% |
$68.97
|
3,033,130
91.53% of 50 DAV
50 DAV is 3,313,900
|
$68.25
0.60%
|
12/20/2011
|
$66.68
|
PP = $68.35
|
|
MB = $71.77
|
Most Recent Note - 12/29/2011 6:10:32 PM
Y - Perched within close striking distance of its 52-week high. Subsequent volume-driven gains above the pivot point may trigger a new (or add-on) technical buy signal. See the latest FSU analysis for more details and a new annotated graph.
>>> The latest Featured Stock Update with an annotated graph appeared on 12/29/2011. Click here.
View all notes |
Alert me of new notes |
CANSLIM.net Company Profile |
SEC |
Zacks Reports |
StockTalk |
News |
Chart |
Request a new note
C
A N
S L
I M
|
FEIC
-
NASDAQ
F E I Co
ELECTRONICS - Diversified Electronics
|
$41.41
|
+0.63
1.54% |
$42.60
|
392,768
114.04% of 50 DAV
50 DAV is 344,400
|
$43.00
-3.70%
|
12/7/2011
|
$41.41
|
PP = $42.35
|
|
MB = $44.47
|
Most Recent Note - 12/30/2011 6:16:04 PM
Y - Pulled back with light volume today while hovering near its all-time high. Its 50 DMA line and prior lows in the $36 area define chart support. Disciplined investors would still be watching for a volume-driven gain above the pivot point to trigger a proper technical buy signal.
>>> The latest Featured Stock Update with an annotated graph appeared on 12/21/2011. Click here.
View all notes |
Alert me of new notes |
CANSLIM.net Company Profile |
SEC |
Zacks Reports |
StockTalk |
News |
Chart |
Request a new note
C
A N
S L
I M
|
Symbol/Exchange
Company Name
Industry Group |
PRICE |
CHANGE
(%Change) |
Day High |
Volume
(% DAV)
(% 50 day avg vol) |
52 Wk Hi
% From Hi |
Featured
Date |
Price
Featured |
Pivot Featured |
|
Max Buy |
GNC
-
NYSE
G N C Holdings Inc
RETAIL - Drug Stores
|
$28.41
|
-0.54
-1.87% |
$29.34
|
852,070
52.49% of 50 DAV
50 DAV is 1,623,400
|
$29.50
-3.69%
|
10/26/2011
|
$24.60
|
PP = $24.80
|
|
MB = $26.04
|
Most Recent Note - 1/3/2012 6:28:26 PM
G - Encountered mild distributional pressure today while perched near its all-time high. It is extended from its prior base pattern. Prior chart highs and its 50 DMA line coincide in the $25-26 area defining important support to watch on pullbacks.
>>> The latest Featured Stock Update with an annotated graph appeared on 12/16/2011. Click here.
View all notes |
Alert me of new notes |
CANSLIM.net Company Profile |
SEC |
Zacks Reports |
StockTalk |
News |
Chart |
Request a new note
C
A N
S L
I M
|
HMSY
-
NASDAQ
H M S Holdings Corp
COMPUTER SOFTWARE and SERVICES - Healthcare Information Service
|
$31.26
|
-0.72
-2.25% |
$32.83
|
621,506
57.99% of 50 DAV
50 DAV is 1,071,800
|
$32.33
-3.30%
|
10/27/2011
|
$26.44
|
PP = $28.37
|
|
MB = $29.79
|
Most Recent Note - 1/3/2012 6:26:05 PM
G - Touched another new all-time high today and then reversed into the red for a small loss on light volume. No resistance remains, but it is extended from its prior base.
>>> The latest Featured Stock Update with an annotated graph appeared on 12/28/2011. Click here.
View all notes |
Alert me of new notes |
CANSLIM.net Company Profile |
SEC |
Zacks Reports |
StockTalk |
News |
Chart |
Request a new note
C
A N
S L
I M
|
ISRG
-
NASDAQ
Intuitive Surgical Inc
HEALTH SERVICES - Medical Appliances and Equipment
|
$471.71
|
+8.70
1.88% |
$473.93
|
344,522
111.06% of 50 DAV
50 DAV is 310,200
|
$469.25
0.52%
|
12/20/2011
|
$442.43
|
PP = $449.16
|
|
MB = $471.62
|
Most Recent Note - 12/29/2011 5:42:08 PM
Y - Up today without great volume conviction, yet rising even further into new all-time high territory. Recent gains above its pivot point have lacked the volume needed to trigger a proper new (or add-on) technical buy signal. Important support is defined by its 50 DMA line.
>>> The latest Featured Stock Update with an annotated graph appeared on 12/13/2011. Click here.
View all notes |
Alert me of new notes |
CANSLIM.net Company Profile |
SEC |
Zacks Reports |
StockTalk |
News |
Chart |
Request a new note
C
A N
S L
I M
|
MA
-
NYSE
Mastercard Inc Cl A
DIVERSIFIED SERVICES - Business/Management Services
|
$368.37
|
-4.45
-1.19% |
$378.64
|
1,470,711
150.36% of 50 DAV
50 DAV is 978,100
|
$384.99
-4.32%
|
1/3/2012
|
$367.87
|
PP = $385.09
|
|
MB = $404.34
|
Most Recent Note - 1/3/2012 8:03:35 PM
Y - Encountered distributional pressure today while consolidating within close striking distance of its all-time high. While building on a riskier late-stage base, in the mid-day report (read here) it was highlighted in yellow with new pivot point cited based on its 52-week high plus 10 cents while. Quarterly and annual earnings history makes it a good match with the C and A criteria. See the latest FSU analysis for an annotated weekly graph.

>>> The latest Featured Stock Update with an annotated graph appeared on 1/3/2012. Click here.
View all notes |
Alert me of new notes |
CANSLIM.net Company Profile |
SEC |
Zacks Reports |
StockTalk |
News |
Chart |
Request a new note
C
A N
S L
I M
|
MG
-
NYSE
Mistras Group Inc
DIVERSIFIED SERVICES - Bulding and Faci;ity Management Services
|
$24.48
|
-1.01
-3.96% |
$26.24
|
139,955
101.20% of 50 DAV
50 DAV is 138,300
|
$26.15
-6.39%
|
10/28/2011
|
$22.49
|
PP = $23.61
|
|
MB = $24.79
|
Most Recent Note - 1/3/2012 6:19:42 PM
G - Touched a new high today, but ended with a loss and closed near the session low after a negative reversal. The distributional session led to a dip below its "max buy" level. Prior highs in the $23 area define chart support along with its 50 DMA line.
>>> The latest Featured Stock Update with an annotated graph appeared on 12/8/2011. Click here.
View all notes |
Alert me of new notes |
CANSLIM.net Company Profile |
SEC |
Zacks Reports |
StockTalk |
News |
Chart |
Request a new note
C
A N
S L
I M
|
Symbol/Exchange
Company Name
Industry Group |
PRICE |
CHANGE
(%Change) |
Day High |
Volume
(% DAV)
(% 50 day avg vol) |
52 Wk Hi
% From Hi |
Featured
Date |
Price
Featured |
Pivot Featured |
|
Max Buy |
MKTX
-
NASDAQ
Marketaxess Holdings Inc
FINANCIAL SERVICES - Investment Brokerage - Nationa
|
$29.26
|
-0.85
-2.82% |
$31.40
|
242,327
118.90% of 50 DAV
50 DAV is 203,800
|
$31.59
-7.38%
|
10/28/2011
|
$29.79
|
PP = $31.05
|
|
MB = $32.60
|
Most Recent Note - 1/3/2012 6:24:08 PM
Y - After it was poised for a best-ever close with its early gain, the negative reversal indicated more distributional pressure, raising concerns as it ended near the session low today with a loss on slightly higher volume. The 50 DMA line is initial chart support to watch.
>>> The latest Featured Stock Update with an annotated graph appeared on 12/20/2011. Click here.
View all notes |
Alert me of new notes |
CANSLIM.net Company Profile |
SEC |
Zacks Reports |
StockTalk |
News |
Chart |
Request a new note
C
A N
S L
I M
|
OSIS
-
NASDAQ
O S I Systems Inc
ELECTRONICS - Semiconductor Equipment and Mate
|
$49.46
|
+0.68
1.39% |
$50.50
|
100,263
91.23% of 50 DAV
50 DAV is 109,900
|
$49.89
-0.86%
|
11/1/2011
|
$42.07
|
PP = $45.57
|
|
MB = $47.85
|
Most Recent Note - 12/27/2011 12:58:30 PM
G - Up today without great volume conviction, yet inching further above its "max buy" level into new all-time high territory and its color code is changed to green. Its 50 DMA line and recent chart lows near $45 define important near-term support to watch.
>>> The latest Featured Stock Update with an annotated graph appeared on 12/27/2011. Click here.
View all notes |
Alert me of new notes |
CANSLIM.net Company Profile |
SEC |
Zacks Reports |
StockTalk |
News |
Chart |
Request a new note
C
A N
S L
I M
|
PRGO
-
NASDAQ
Perrigo Co
DRUGS - Drug Related Products
|
$98.55
|
+1.25
1.28% |
$99.29
|
1,090,383
81.23% of 50 DAV
50 DAV is 1,342,300
|
$104.70
-5.87%
|
12/9/2011
|
$99.54
|
PP = $101.56
|
|
MB = $106.64
|
Most Recent Note - 12/30/2011 6:21:32 PM
Y - Down again today on light volume, finishing -7.1% off its 52-week high. A proper technical buy signal did not occur after it was featured on 12/09/11, and there was a negative reversal on 12/22/11 after touching a new all-time high. Insider buying was recently reported while perched near all-time highs, which is a reassuring sign.Its Relative Strength line peaked in September and did not recently lead the way confirming new highs.
>>> The latest Featured Stock Update with an annotated graph appeared on 12/9/2011. Click here.
View all notes |
Alert me of new notes |
CANSLIM.net Company Profile |
SEC |
Zacks Reports |
StockTalk |
News |
Chart |
Request a new note
C
A N
S L
I M
|
RAX
-
NYSE
Rackspace Hosting Inc
INTERNET - Internet Software and; Services
|
$43.27
|
+0.26
0.60% |
$44.10
|
1,510,064
97.12% of 50 DAV
50 DAV is 1,554,900
|
$46.50
-6.94%
|
11/8/2011
|
$44.28
|
PP = $46.27
|
|
MB = $48.58
|
Most Recent Note - 12/27/2011 1:02:58 PM
Y - Holding its ground today perched within -5.7% of its 52-week and all-time high. Its 50 DMA line defines near-term support to watch. That short-term moving average has risen since its positive crossover with the 200 DMA line shown on the graph in the latest FSU analysis dated 12/07/11.
>>> The latest Featured Stock Update with an annotated graph appeared on 12/7/2011. Click here.
View all notes |
Alert me of new notes |
CANSLIM.net Company Profile |
SEC |
Zacks Reports |
StockTalk |
News |
Chart |
Request a new note
C
A N
S L
I M
|
SWI
-
NYSE
Solarwinds Inc
COMPUTER SOFTWARE and SERVICES - Application Software
|
$28.51
|
+0.56
2.00% |
$28.87
|
916,004
72.27% of 50 DAV
50 DAV is 1,267,400
|
$33.68
-15.35%
|
10/27/2011
|
$27.78
|
PP = $25.62
|
|
MB = $26.90
|
Most Recent Note - 12/30/2011 3:56:52 PM
G - Slumping further below its 50 DMA line today with another loss on light volume. A rebound above that important short-term average is needed for its outlook to improve. Prior highs in the $25-26 area and its 200 DMA line define the next important area of chart support.
>>> The latest Featured Stock Update with an annotated graph appeared on 12/19/2011. Click here.
View all notes |
Alert me of new notes |
CANSLIM.net Company Profile |
SEC |
Zacks Reports |
StockTalk |
News |
Chart |
Request a new note
C
A N
S L
I M
|
Symbol/Exchange
Company Name
Industry Group |
PRICE |
CHANGE
(%Change) |
Day High |
Volume
(% DAV)
(% 50 day avg vol) |
52 Wk Hi
% From Hi |
Featured
Date |
Price
Featured |
Pivot Featured |
|
Max Buy |
TDG
-
NYSE
Transdigm Group Inc
AEROSPACE/DEFENSE - Aerospace/Defense Products and; Services
|
$94.08
|
-1.60
-1.67% |
$98.91
|
795,394
225.39% of 50 DAV
50 DAV is 352,900
|
$102.73
-8.42%
|
11/9/2011
|
$98.45
|
PP = $95.14
|
|
MB = $99.90
|
Most Recent Note - 1/3/2012 8:08:22 PM
G - Erased early gains today and violated its 50 DMA line, closing near the session low. Its loss on more than 2 times average volume triggered a technical sell signal, and the color code is changed to green after the worrisome sign of distributional pressure.
>>> The latest Featured Stock Update with an annotated graph appeared on 12/6/2011. Click here.
View all notes |
Alert me of new notes |
CANSLIM.net Company Profile |
SEC |
Zacks Reports |
StockTalk |
News |
Chart |
Request a new note
C
A N
S L
I M
|
V
-
NYSE
Visa Inc Cl A
DIVERSIFIED SERVICES - Business/Management Services
|
$102.99
|
+1.46
1.44% |
$103.40
|
4,207,114
102.57% of 50 DAV
50 DAV is 4,101,800
|
$103.45
-0.44%
|
10/24/2011
|
$94.21
|
PP = $94.85
|
|
MB = $99.59
|
Most Recent Note - 12/29/2011 5:40:35 PM
G - Up today with below average volume, rising to a best-ever close. It is extended from its prior base and trading above its "max buy" level. Prior highs in the $95 area and its 50 DMA line define chart support to watch on pullbacks.
>>> The latest Featured Stock Update with an annotated graph appeared on 12/15/2011. Click here.
View all notes |
Alert me of new notes |
CANSLIM.net Company Profile |
SEC |
Zacks Reports |
StockTalk |
News |
Chart |
Request a new note
C
A N
S L
I M
|
|
|
|
THESE ARE NOT BUY RECOMMENDATIONS!
Comments contained in the body of this report are technical
opinions only. The material herein has been obtained
from sources believed to be reliable and accurate, however,
its accuracy and completeness cannot be guaranteed.
This site is not an investment advisor, hence it does
not endorse or recommend any securities or other investments.
Any recommendation contained in this report may not
be suitable for all investors and it is not to be deemed
an offer or solicitation on our part with respect to
the purchase or sale of any securities. All trademarks,
service marks and trade names appearing in this report
are the property of their respective owners, and are
likewise used for identification purposes only.
This report is a service available
only to active Paid Premium Members.
You may opt-out of receiving report notifications
at any time. Questions or comments may be submitted
by writing to Premium Membership Services 665 S.E. 10 Street, Suite 201 Deerfield Beach, FL 33441-5634 or by calling 1-800-965-8307
or 954-785-1121.
|
|
|

