You are not logged in.
This means you
CAN ONLY VIEW reports that were published prior to Tuesday, April 15, 2025.
You
MUST UPGRADE YOUR MEMBERSHIP if you want to see any current reports.
AFTER MARKET UPDATE - FRIDAY, DECEMBER 30TH, 2011
Previous After Market Report Next After Market Report >>>
|
|
|
|
DOW |
-69.48 |
12,217.56 |
-0.57% |
|
Volume |
588,098,710 |
+11% |
|
Volume |
1,019,770,670 |
+1% |
|
NASDAQ |
-8.59 |
2,605.15 |
-0.33% |
|
Advancers |
1,424 |
46% |
|
Advancers |
1,195 |
44% |
|
S&P 500 |
-5.42 |
1,257.60 |
-0.43% |
|
Decliners |
1,583 |
51% |
|
Decliners |
1,400 |
52% |
|
Russell 2000 |
-4.06 |
740.92 |
-0.54% |
|
52 Wk Highs |
149 |
|
|
52 Wk Highs |
34 |
|
|
S&P 600 |
-3.92 |
415.07 |
-0.94% |
|
52 Wk Lows |
18 |
|
|
52 Wk Lows |
59 |
|
|
The staff at CANSLIM.net kindly wishes all of our members a happy, healthy, and prosperous New Year! Please be advised that the market will be closed on Monday, January 2nd. Our regular reports will resume on Tuesday. We look forward to the opportunity to highlight worthwhile buy candidates in 2012, and we hope to hear your success stories!
The Q4 2011 CANSLIM.net Webcast recently aired and it is now available to members "ON DEMAND" at no additional cost - CLICK HERE. If there is any topic you would like to see covered in a future webcast please submit your comments or questions via the inquiry form. Thank you!
|
 |
Major Averages Closed Choppy Year With Mixed Results
Kenneth J. Gruneisen - Passed the CAN SLIM® Master's Exam
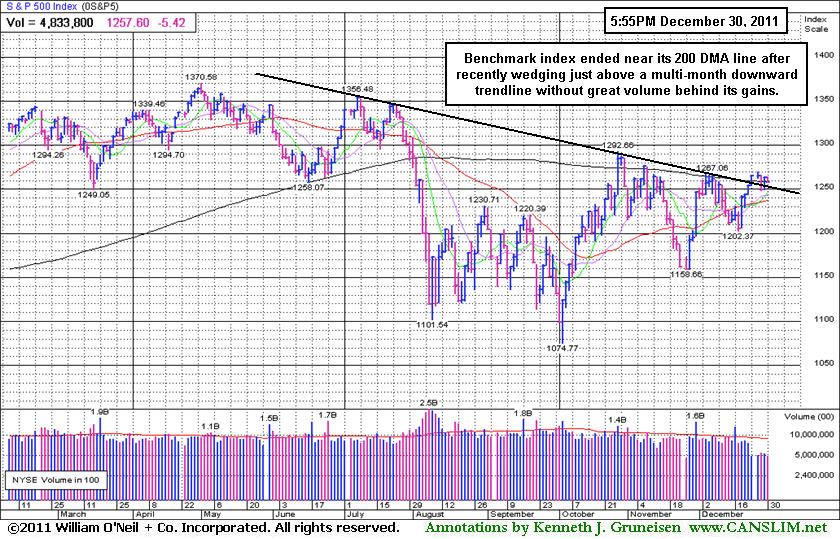
For 2011, the Dow Jones Industrial Average gained +5.5%, the S&P 500 Index was flat while the Nasdaq Composite Index declined -1.8%. The major averages finished with modest losses across the board on Friday. The session's volume totals were near and slightly up from the prior session totals, yet volume remained lighter than average both on the NYSE and on the Nasdaq exchange. Breadth was negative as decliners led advancers by 7-6 on the Nasdaq exchange, meanwhile the breadth was closer to even on the NYSE. New 52-week highs outnumbered new 52-week lows on the NYSE but new lows outnumbered new highs on the Nasdaq exchange again. There were 32 high-ranked companies from the CANSLIM.net Leaders List that made new 52-week highs and appeared on the CANSLIM.net BreakOuts Page, up a notch from the prior session total of 31 stocks. There were losses for 14 of the 17 high-ranked companies currently included on the Featured Stocks Page.
Wall Street ended 2011 on a down note. The market ended Friday's session lower as news out of Europe damped optimism on the U.S. economy heading into 2012. Spain set the cautious tone after announcing austerity measures that included an increased forecast of its budget deficit to 8% of GDP, up from its previous 6.0% estimate.
Utilities led the market lower with Consolidated Edison Inc (ED -0.89%) losing ground. Consumer staples stocks also declined with Dow component Kraft Foods Inc (KFT -0.85%) falling. Financials sank with JP Morgan Chase & Co (JPM -0.51%) among the influential decliners. Telecom was a bright spot as MetroPCS Communications Inc (PCS +5.34%) rallied after an analyst said the wireless carrier could be a possible takeover target.
The Q4 2011 CANSLIM.net Webcast aired on Wednesday, December 28th at 8PM EST and is now available "ON DEMAND" to all upgraded members at no additional cost. Via the Premium Member Homepage links to all prior reports and webcasts are always available.
PICTURED: The benchmark S&P 500 Index ended the year at its 200-day moving average (DMA) line after recently wedging just above a multi-month downward trendline without great volume behind its gains.
|
 Kenneth J. Gruneisen started out as a licensed stockbroker in August 1987, a couple of months prior to the historic stock market crash that took the Dow Jones Industrial Average down -22.6% in a single day. He has published daily fact-based fundamental and technical analysis on high-ranked stocks online for two decades. Through FACTBASEDINVESTING.COM, Kenneth provides educational articles, news, market commentary, and other information regarding proven investment systems that work in good times and bad.
Comments contained in the body of this report are technical opinions only and are not necessarily those of Gruneisen Growth Corp. The material herein has been obtained from sources believed to be reliable and accurate, however, its accuracy and completeness cannot be guaranteed. Our firm, employees, and customers may effect transactions, including transactions contrary to any recommendation herein, or have positions in the securities mentioned herein or options with respect thereto. Any recommendation contained in this report may not be suitable for all investors and it is not to be deemed an offer or solicitation on our part with respect to the purchase or sale of any securities. |
|
 |
Financial Indexes Finished With Big Yearly Losses
Kenneth J. Gruneisen - Passed the CAN SLIM® Master's Exam
The major averages were negatively influenced on Friday by the slumping Retail Index ($RLX -0.76%) and the falling financial indexes including the Bank Index ($BKX -0.81%) and Broker/Dealer Index ($XBD -0.58%). The tech sector saw small losses from the Semiconductor Index ($SOX -0.41%), Internet Index ($IIX -0.31%), and Networking Index ($NWX -0.21%) while the Biotechnology Index ($BTK +0.11%) barely ended above unchanged. Energy-related shares were quiet as the Integrated Oil Index ($XOI +0.01%) and Oil Services Index ($OSX +0.07%) finished flat, and the Gold & Silver Index ($XAU +0.67%) posted a small gain.
Charts courtesy www.stockcharts.com
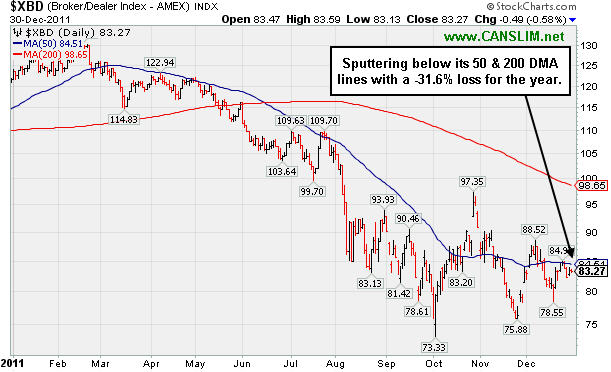
PICTURED 1: The Broker/Dealer Index ($XBD -0.58%) is sputtering below its 50-day moving average (DMA) line and well below its 200 DMA line (red line above), finishing with a -31.6% loss for the year.
Charts courtesy www.stockcharts.com
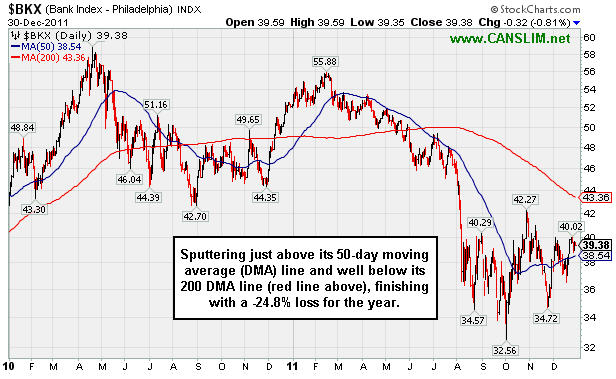
PICTURED 2: The Bank Index ($BKX -0.81%) is sputtering just above its 50-day moving average (DMA) line and well below its 200 DMA line (red line above), finishing with a -24.8% loss for the year.
| Oil Services |
$OSX |
216.28 |
+0.15 |
+0.07% |
-11.77% |
| Healthcare |
$HMO |
2,281.61 |
-25.05 |
-1.09% |
+34.85% |
| Integrated Oil |
$XOI |
1,229.10 |
+0.14 |
+0.01% |
+1.31% |
| Semiconductor |
$SOX |
364.44 |
-1.49 |
-0.41% |
-11.51% |
| Networking |
$NWX |
215.16 |
-0.45 |
-0.21% |
-23.31% |
| Internet |
$IIX |
281.74 |
-0.89 |
-0.31% |
-8.45% |
| Broker/Dealer |
$XBD |
83.27 |
-0.49 |
-0.58% |
-31.47% |
| Retail |
$RLX |
523.20 |
-4.03 |
-0.76% |
+2.92% |
| Gold & Silver |
$XAU |
180.64 |
+1.21 |
+0.67% |
-20.28% |
| Bank |
$BKX |
39.38 |
-0.32 |
-0.81% |
-24.57% |
| Biotech |
$BTK |
1,091.43 |
+1.25 |
+0.11% |
-15.89% |
|
|
|
 |
Deterioration and Lack Of Buying Demand Raising Concerns
Kenneth J. Gruneisen - Passed the CAN SLIM® Master's Exam
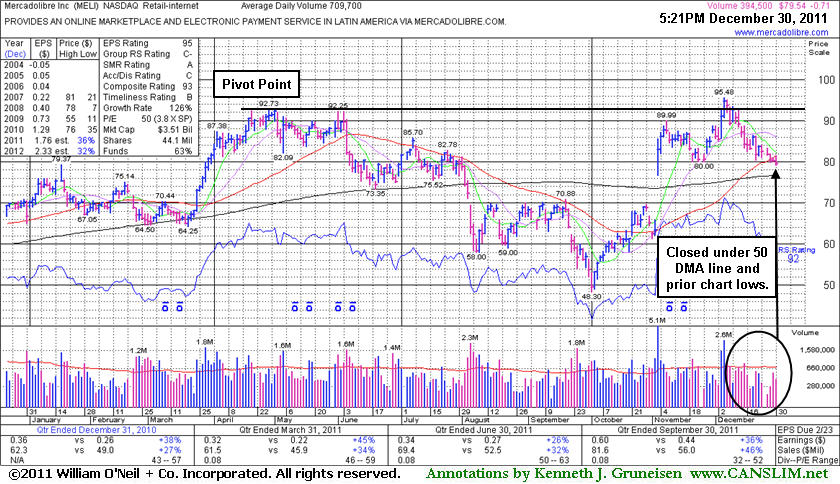
Mercadolibre Inc (MELI -$0.71 or -0.88% to $79.54) added to its streak of losses with light volume today. It quietly slumped just below its 50-day moving average (DMA) line and below prior lows repeatedly noted as chart support near the $80 area. It stalled after volume-driven gains to new all-time highs in early-December. It has not encountered heavy distributional pressure, however, concerns are raised by the lack of buying demand evidenced by its deterioration and failure to produce any gains in the past few weeks backed by meaningful volume. MELI finished -16.7% off its 52-week high today. Based on the weak action it will be dropped from the Featured Stocks list tonight.
Its last appearance in this FSU section was on 12/05/11 with an annotated daily graph under the headline, "Challenging 52-week High After Rebounding From Deep Correction," after featured in that day's mid-day report color coded yellow with new pivot point cited based on its 52-week high plus 10 cents. It had rebounded impressively after a deep consolidation below its 50-day and 200-day moving average (DMA) lines since dropped from the Featured Stocks list on 6/13/11. The Latin American Internet - eCommerce firm has seen top-rated funds owning an interest wane from 323 in Mar '11 to 307 in Sep '11, which prior reports had noted as a slightly discouraging sign concerning the I criteria. Its 12/06/11 rally above its pivot point with nearly 4 times average volume had triggered a technical buy signal. However, disciplined investors limit losses if ever a stock falls -7% from their purchase price. Healthy stocks typically do not fall more than -7% below their pivot point, and the best way to prevent large losses is to follow a strict rule of limiting your losses as the fact-based investment system's rules specify! In the event strength returns, any stock that is dropped from the Featured Stocks list may return again in the future at which time a new pivot point may be cited and it will be highlighted in yellow.
|
|
|
Color Codes Explained :
Y - Better candidates highlighted by our
staff of experts.
G - Previously featured
in past reports as yellow but may no longer be buyable under the
guidelines.
***Last / Change / Volume data in this table is the closing quote data***
Symbol/Exchange
Company Name
Industry Group |
PRICE |
CHANGE
(%Change) |
Day High |
Volume
(% DAV)
(% 50 day avg vol) |
52 Wk Hi
% From Hi |
Featured
Date |
Price
Featured |
Pivot Featured |
|
Max Buy |
ADS
-
NYSE
Alliance Data Sys Corp
COMPUTER SOFTWARE and SERVICES - Information and Delivery Service
|
$103.84
|
-0.49
-0.47% |
$104.36
|
368,192
48.12% of 50 DAV
50 DAV is 765,100
|
$107.33
-3.25%
|
10/21/2011
|
$97.94
|
PP = $101.15
|
|
MB = $106.21
|
Most Recent Note - 12/27/2011 12:44:09 PM
Y - Stubbornly holding its ground with volume totals cooling while perched within close striking distance of its all-time high. Its 50 DMA line defines important near-term chart support.
>>> The latest Featured Stock Update with an annotated graph appeared on 12/14/2011. Click here.
View all notes |
Alert me of new notes |
CANSLIM.net Company Profile |
SEC |
Zacks Reports |
StockTalk |
News |
Chart |
Request a new note
C
A N
S L
I M


|
ALXN
-
NASDAQ
Alexion Pharmaceuticals
DRUGS - Drug Manufacturers - Other
|
$71.50
|
+0.52
0.73% |
$72.25
|
1,051,496
87.35% of 50 DAV
50 DAV is 1,203,800
|
$72.18
-0.94%
|
11/30/2011
|
$68.66
|
PP = $70.52
|
|
MB = $74.05
|
Most Recent Note - 12/27/2011 12:09:14 PM
Y - Rallying to new all-time high territory and above its pivot point with today's gain. A strong close with at least +40% above average volume or more may clinch a new technical buy signal. Recent lows near $62 define important near-term support to watch.
>>> The latest Featured Stock Update with an annotated graph appeared on 12/12/2011. Click here.
View all notes |
Alert me of new notes |
CANSLIM.net Company Profile |
SEC |
Zacks Reports |
StockTalk |
News |
Chart |
Request a new note
C
A N
S L
I M
|
CATM
-
NASDAQ
Cardtronics Inc
DIVERSIFIED SERVICES - Business/Management Services
|
$27.06
|
-0.32
-1.17% |
$27.74
|
262,273
75.30% of 50 DAV
50 DAV is 348,300
|
$28.74
-5.85%
|
12/23/2011
|
$28.64
|
PP = $28.56
|
|
MB = $29.99
|
Most Recent Note - 12/28/2011 5:22:32 PM
Y - Down today for a 2nd consecutive loss on near average volume, slumping further below the pivot point cited. Its 50 DMA line defines important chart support to watch.
>>> The latest Featured Stock Update with an annotated graph appeared on 12/23/2011. Click here.
View all notes |
Alert me of new notes |
CANSLIM.net Company Profile |
SEC |
Zacks Reports |
StockTalk |
News |
Chart |
Request a new note
C
A N
S L
I M
|
CELG
-
NASDAQ
Celgene Corp
DRUGS - Drug Manufacturers - Major
|
$67.60
|
+0.05
0.07% |
$68.10
|
1,780,963
53.52% of 50 DAV
50 DAV is 3,327,500
|
$68.25
-0.95%
|
12/20/2011
|
$66.68
|
PP = $68.35
|
|
MB = $71.77
|
Most Recent Note - 12/29/2011 6:10:32 PM
Y - Perched within close striking distance of its 52-week high. Subsequent volume-driven gains above the pivot point may trigger a new (or add-on) technical buy signal. See the latest FSU analysis for more details and a new annotated graph.
>>> The latest Featured Stock Update with an annotated graph appeared on 12/29/2011. Click here.
View all notes |
Alert me of new notes |
CANSLIM.net Company Profile |
SEC |
Zacks Reports |
StockTalk |
News |
Chart |
Request a new note
C
A N
S L
I M
|
FEIC
-
NASDAQ
F E I Co
ELECTRONICS - Diversified Electronics
|
$40.78
|
-1.06
-2.53% |
$41.85
|
227,547
65.75% of 50 DAV
50 DAV is 346,100
|
$43.00
-5.16%
|
12/7/2011
|
$41.41
|
PP = $42.35
|
|
MB = $44.47
|
 Most Recent Note - 12/30/2011 6:16:04 PM
Y - Pulled back with light volume today while hovering near its all-time high. Its 50 DMA line and prior lows in the $36 area define chart support. Disciplined investors would still be watching for a volume-driven gain above the pivot point to trigger a proper technical buy signal.
>>> The latest Featured Stock Update with an annotated graph appeared on 12/21/2011. Click here.
View all notes |
Alert me of new notes |
CANSLIM.net Company Profile |
SEC |
Zacks Reports |
StockTalk |
News |
Chart |
Request a new note
C
A N
S L
I M
|
Symbol/Exchange
Company Name
Industry Group |
PRICE |
CHANGE
(%Change) |
Day High |
Volume
(% DAV)
(% 50 day avg vol) |
52 Wk Hi
% From Hi |
Featured
Date |
Price
Featured |
Pivot Featured |
|
Max Buy |
GNC
-
NYSE
G N C Holdings Inc
RETAIL - Drug Stores
|
$28.95
|
-0.24
-0.82% |
$29.23
|
164,557
10.10% of 50 DAV
50 DAV is 1,629,900
|
$29.50
-1.86%
|
10/26/2011
|
$24.60
|
PP = $24.80
|
|
MB = $26.04
|
Most Recent Note - 12/27/2011 1:16:31 PM
G - Holding its ground perched near all-time high territory. It is extended from its prior base pattern. Prior chart highs and its 50 DMA line coincide in the $25-26 area defining important support to watch on pullbacks.
>>> The latest Featured Stock Update with an annotated graph appeared on 12/16/2011. Click here.
View all notes |
Alert me of new notes |
CANSLIM.net Company Profile |
SEC |
Zacks Reports |
StockTalk |
News |
Chart |
Request a new note
C
A N
S L
I M
|
HMSY
-
NASDAQ
H M S Holdings Corp
COMPUTER SOFTWARE and SERVICES - Healthcare Information Service
|
$31.98
|
+0.04
0.13% |
$32.22
|
865,465
81.04% of 50 DAV
50 DAV is 1,068,000
|
$32.33
-1.08%
|
10/27/2011
|
$26.44
|
PP = $28.37
|
|
MB = $29.79
|
Most Recent Note - 12/28/2011 6:39:35 PM
G - Touched a new all-time high today and then reversed into the red for a small loss on light volume. No resistance remains, but it is extended from its prior base. See the latest FSU analysis for more details and a new annotated graph.
>>> The latest Featured Stock Update with an annotated graph appeared on 12/28/2011. Click here.
View all notes |
Alert me of new notes |
CANSLIM.net Company Profile |
SEC |
Zacks Reports |
StockTalk |
News |
Chart |
Request a new note
C
A N
S L
I M
|
ISRG
-
NASDAQ
Intuitive Surgical Inc
HEALTH SERVICES - Medical Appliances and Equipment
|
$463.01
|
-3.02
-0.65% |
$469.25
|
181,310
54.06% of 50 DAV
50 DAV is 335,400
|
$466.04
-0.65%
|
12/20/2011
|
$442.43
|
PP = $449.16
|
|
MB = $471.62
|
Most Recent Note - 12/29/2011 5:42:08 PM
Y - Up today without great volume conviction, yet rising even further into new all-time high territory. Recent gains above its pivot point have lacked the volume needed to trigger a proper new (or add-on) technical buy signal. Important support is defined by its 50 DMA line.
>>> The latest Featured Stock Update with an annotated graph appeared on 12/13/2011. Click here.
View all notes |
Alert me of new notes |
CANSLIM.net Company Profile |
SEC |
Zacks Reports |
StockTalk |
News |
Chart |
Request a new note
C
A N
S L
I M
|
MELI
-
NASDAQ
Mercadolibre Inc
INTERNET - Internet Software and; Services
|
$79.54
|
-0.71
-0.88% |
$81.48
|
394,595
55.60% of 50 DAV
50 DAV is 709,700
|
$95.48
-16.69%
|
12/5/2011
|
$91.08
|
PP = $92.83
|
|
MB = $97.47
|
Most Recent Note - 12/30/2011 6:13:44 PM
Added to its streak of losses with light volume today and raised concerns while technically slumping under its 50 DMA line and below prior lows previously noted as chart support near the $80 area. Based on weak action it will be dropped from the Featured Stocks list tonight. See the latest FSU analysis for more details and a new annotated graph.
>>> The latest Featured Stock Update with an annotated graph appeared on 12/30/2011. Click here.
View all notes |
Alert me of new notes |
CANSLIM.net Company Profile |
SEC |
Zacks Reports |
StockTalk |
News |
Chart |
Request a new note
C
A N
S L
I M
|
MG
-
NYSE
Mistras Group Inc
DIVERSIFIED SERVICES - Bulding and Faci;ity Management Services
|
$25.49
|
-0.01
-0.04% |
$25.72
|
56,370
39.53% of 50 DAV
50 DAV is 142,600
|
$26.15
-2.52%
|
10/28/2011
|
$22.49
|
PP = $23.61
|
|
MB = $24.79
|
Most Recent Note - 12/27/2011 1:14:50 PM
G - Up today and on track for a 5th consecutive small gain. Color code is changed to green after inching above its "max buy" level. Prior highs in the $23 area define chart support along with its 50 DMA line.
>>> The latest Featured Stock Update with an annotated graph appeared on 12/8/2011. Click here.
View all notes |
Alert me of new notes |
CANSLIM.net Company Profile |
SEC |
Zacks Reports |
StockTalk |
News |
Chart |
Request a new note
C
A N
S L
I M
|
Symbol/Exchange
Company Name
Industry Group |
PRICE |
CHANGE
(%Change) |
Day High |
Volume
(% DAV)
(% 50 day avg vol) |
52 Wk Hi
% From Hi |
Featured
Date |
Price
Featured |
Pivot Featured |
|
Max Buy |
MKTX
-
NASDAQ
Marketaxess Holdings Inc
FINANCIAL SERVICES - Investment Brokerage - Nationa
|
$30.11
|
-0.10
-0.33% |
$30.53
|
117,385
57.54% of 50 DAV
50 DAV is 204,000
|
$31.59
-4.69%
|
10/28/2011
|
$29.79
|
PP = $31.05
|
|
MB = $32.60
|
Most Recent Note - 12/28/2011 12:48:58 PM
Y - Up today, rallying within striking distance of its best-ever close. Held its ground after reversing back into the prior base when encountering distributional pressure immediately following its volume-driven breakout on 12/20/11. The 50 DMA line is initial chart support to watch.
>>> The latest Featured Stock Update with an annotated graph appeared on 12/20/2011. Click here.
View all notes |
Alert me of new notes |
CANSLIM.net Company Profile |
SEC |
Zacks Reports |
StockTalk |
News |
Chart |
Request a new note
C
A N
S L
I M
|
OSIS
-
NASDAQ
O S I Systems Inc
ELECTRONICS - Semiconductor Equipment and Mate
|
$48.78
|
-0.22
-0.45% |
$49.32
|
76,119
68.89% of 50 DAV
50 DAV is 110,500
|
$49.89
-2.22%
|
11/1/2011
|
$42.07
|
PP = $45.57
|
|
MB = $47.85
|
Most Recent Note - 12/27/2011 12:58:30 PM
G - Up today without great volume conviction, yet inching further above its "max buy" level into new all-time high territory and its color code is changed to green. Its 50 DMA line and recent chart lows near $45 define important near-term support to watch.
>>> The latest Featured Stock Update with an annotated graph appeared on 12/27/2011. Click here.
View all notes |
Alert me of new notes |
CANSLIM.net Company Profile |
SEC |
Zacks Reports |
StockTalk |
News |
Chart |
Request a new note
C
A N
S L
I M
|
PRGO
-
NASDAQ
Perrigo Co
DRUGS - Drug Related Products
|
$97.30
|
-1.74
-1.76% |
$99.63
|
681,677
50.97% of 50 DAV
50 DAV is 1,337,500
|
$104.70
-7.07%
|
12/9/2011
|
$99.54
|
PP = $101.56
|
|
MB = $106.64
|
Most Recent Note - 12/30/2011 6:21:32 PM
Y - Down again today on light volume, finishing -7.1% off its 52-week high. A proper technical buy signal did not occur after it was featured on 12/09/11, and there was a negative reversal on 12/22/11 after touching a new all-time high. Insider buying was recently reported while perched near all-time highs, which is a reassuring sign.Its Relative Strength line peaked in September and did not recently lead the way confirming new highs.
>>> The latest Featured Stock Update with an annotated graph appeared on 12/9/2011. Click here.
View all notes |
Alert me of new notes |
CANSLIM.net Company Profile |
SEC |
Zacks Reports |
StockTalk |
News |
Chart |
Request a new note
C
A N
S L
I M
|
RAX
-
NYSE
Rackspace Hosting Inc
INTERNET - Internet Software and; Services
|
$43.01
|
-0.36
-0.83% |
$43.62
|
763,072
49.05% of 50 DAV
50 DAV is 1,555,700
|
$46.50
-7.50%
|
11/8/2011
|
$44.28
|
PP = $46.27
|
|
MB = $48.58
|
Most Recent Note - 12/27/2011 1:02:58 PM
Y - Holding its ground today perched within -5.7% of its 52-week and all-time high. Its 50 DMA line defines near-term support to watch. That short-term moving average has risen since its positive crossover with the 200 DMA line shown on the graph in the latest FSU analysis dated 12/07/11.
>>> The latest Featured Stock Update with an annotated graph appeared on 12/7/2011. Click here.
View all notes |
Alert me of new notes |
CANSLIM.net Company Profile |
SEC |
Zacks Reports |
StockTalk |
News |
Chart |
Request a new note
C
A N
S L
I M
|
SWI
-
NYSE
Solarwinds Inc
COMPUTER SOFTWARE and SERVICES - Application Software
|
$27.95
|
-0.53
-1.86% |
$28.58
|
585,556
46.11% of 50 DAV
50 DAV is 1,269,800
|
$33.68
-17.01%
|
10/27/2011
|
$27.78
|
PP = $25.62
|
|
MB = $26.90
|
Most Recent Note - 12/30/2011 3:56:52 PM
G - Slumping further below its 50 DMA line today with another loss on light volume. A rebound above that important short-term average is needed for its outlook to improve. Prior highs in the $25-26 area and its 200 DMA line define the next important area of chart support.
>>> The latest Featured Stock Update with an annotated graph appeared on 12/19/2011. Click here.
View all notes |
Alert me of new notes |
CANSLIM.net Company Profile |
SEC |
Zacks Reports |
StockTalk |
News |
Chart |
Request a new note
C
A N
S L
I M
|
Symbol/Exchange
Company Name
Industry Group |
PRICE |
CHANGE
(%Change) |
Day High |
Volume
(% DAV)
(% 50 day avg vol) |
52 Wk Hi
% From Hi |
Featured
Date |
Price
Featured |
Pivot Featured |
|
Max Buy |
TDG
-
NYSE
Transdigm Group Inc
AEROSPACE/DEFENSE - Aerospace/Defense Products and; Services
|
$95.68
|
-0.81
-0.84% |
$96.59
|
160,769
45.34% of 50 DAV
50 DAV is 354,600
|
$102.73
-6.86%
|
11/9/2011
|
$98.45
|
PP = $95.14
|
|
MB = $99.90
|
Most Recent Note - 12/28/2011 5:03:33 PM
Y - Finished near the session low today with a considerable loss on higher (yet still below average) volume. Its 50 DMA line defines near-term support above recent lows where subsequent violations would trigger technical sell signals.
>>> The latest Featured Stock Update with an annotated graph appeared on 12/6/2011. Click here.
View all notes |
Alert me of new notes |
CANSLIM.net Company Profile |
SEC |
Zacks Reports |
StockTalk |
News |
Chart |
Request a new note
C
A N
S L
I M
|
V
-
NYSE
Visa Inc Cl A
DIVERSIFIED SERVICES - Business/Management Services
|
$101.53
|
-1.62
-1.57% |
$103.20
|
2,146,608
51.51% of 50 DAV
50 DAV is 4,167,100
|
$103.45
-1.86%
|
10/24/2011
|
$94.21
|
PP = $94.85
|
|
MB = $99.59
|
Most Recent Note - 12/29/2011 5:40:35 PM
G - Up today with below average volume, rising to a best-ever close. It is extended from its prior base and trading above its "max buy" level. Prior highs in the $95 area and its 50 DMA line define chart support to watch on pullbacks.
>>> The latest Featured Stock Update with an annotated graph appeared on 12/15/2011. Click here.
View all notes |
Alert me of new notes |
CANSLIM.net Company Profile |
SEC |
Zacks Reports |
StockTalk |
News |
Chart |
Request a new note
C
A N
S L
I M
|
|
|
|
THESE ARE NOT BUY RECOMMENDATIONS!
Comments contained in the body of this report are technical
opinions only. The material herein has been obtained
from sources believed to be reliable and accurate, however,
its accuracy and completeness cannot be guaranteed.
This site is not an investment advisor, hence it does
not endorse or recommend any securities or other investments.
Any recommendation contained in this report may not
be suitable for all investors and it is not to be deemed
an offer or solicitation on our part with respect to
the purchase or sale of any securities. All trademarks,
service marks and trade names appearing in this report
are the property of their respective owners, and are
likewise used for identification purposes only.
This report is a service available
only to active Paid Premium Members.
You may opt-out of receiving report notifications
at any time. Questions or comments may be submitted
by writing to Premium Membership Services 665 S.E. 10 Street, Suite 201 Deerfield Beach, FL 33441-5634 or by calling 1-800-965-8307
or 954-785-1121.
|
|
|

