***Last / Change / Volume data in this table is the closing quote data***
Symbol/Exchange
Company Name
Industry Group |
PRICE |
CHANGE
(%Change) |
Day High |
Volume
(% DAV)
(% 50 day avg vol) |
52 Wk Hi
% From Hi |
Featured
Date |
Price
Featured |
Pivot Featured |
|
Max Buy |
ABV
-
NYSE
Comp De Bebidas Adr
FOOD and BEVERAGE - Beverages - Brewers
|
$31.79
|
+0.76
2.45% |
$31.89
|
2,388,969
87.36% of 50 DAV
50 DAV is 2,734,600
|
$32.00
-0.66%
|
12/10/2010
|
$139.87
|
PP = $145.46
|
|
MB = $152.73
|
Most Recent Note - 12/31/2010 5:49:22 PM
G - Reversed and closed near the session low today after hitting a new all-time high. Extended from its latest base pattern. Prior highs in the $29 area define important chart support to watch above its 50 DMA line. Do not be confused by the 5:1 split impacting its share price as of 12/28/10. (Previous data concerning Featured Price and Pivot Point will soon be adjusted).
>>> The latest Featured Stock Update with an annotated graph appeared on 12/3/2010. Click here.
View all notes |
Alert me of new notes |
CANSLIM.net Company Profile |
SEC |
Zacks Reports |
StockTalk |
News |
Chart |
Request a new note
C
A N
S L
I M


|
ARUN
-
NASDAQ
Aruba Networks Inc
COMPUTER HARDWARE - Networking andamp; Communication Dev
|
$22.55
|
+1.67
8.00% |
$23.00
|
3,982,196
170.05% of 50 DAV
50 DAV is 2,341,800
|
$24.28
-7.13%
|
1/3/2011
|
$22.55
|
PP = $24.38
|
|
MB = $25.60
|
 Most Recent Note - 1/3/2011 7:54:25 PM
Y - Considerable gain today with heavy volume helped it rally back above its 50 DMA line ($22.31 now) and helped its outlook improve. Color code is changed to yellow with new pivot point cited based on its 52-week high plus 10 cents. Time is needed for it to prove a new (or add-on) technical buy signal from a sound new base, meanwhile recent lows in the $20.00 area define an important chart support level to watch.
>>> The latest Featured Stock Update with an annotated graph appeared on 12/14/2010. Click here.
View all notes |
Alert me of new notes |
CANSLIM.net Company Profile |
SEC |
Zacks Reports |
StockTalk |
News |
Chart |
Request a new note
C
A N
S L
I M
|
CACC
-
NASDAQ
Credit Acceptance Corp
FINANCIAL SERVICES - Credit Services
|
$63.75
|
+0.98
1.56% |
$63.77
|
31,855
144.14% of 50 DAV
50 DAV is 22,100
|
$63.58
0.27%
|
11/22/2010
|
$59.97
|
PP = $62.00
|
|
MB = $65.10
|
Most Recent Note - 1/3/2011 5:53:33 PM
Y - Rallied today for a new 52-week high with +44% above average volume behind its second consecutive gain. It remains below the long ago cited "max buy" level and it faces no resistance due to overhead supply.
>>> The latest Featured Stock Update with an annotated graph appeared on 12/20/2010. Click here.
View all notes |
Alert me of new notes |
CANSLIM.net Company Profile |
SEC |
Zacks Reports |
StockTalk |
News |
Chart |
Request a new note
C
A N
S L
I M
|
CIS
-
NYSE
Camelot Info Systems Ads
COMPUTER SOFTWARE andamp; SERVICES - Information Technology Service
|
$24.28
|
+0.36
1.51% |
$25.50
|
501,775
123.86% of 50 DAV
50 DAV is 405,100
|
$24.90
-2.49%
|
11/26/2010
|
$18.93
|
PP = $19.72
|
|
MB = $20.71
|
Most Recent Note - 1/3/2011 12:40:06 PM
G - Touched a new all-time high with today's gain. No resistance remains due to overhead supply after a choppy 5-week consolidation above prior highs and its 50 DMA line, but it has not built a sound new base. On 12/09/10 it completed a Secondary Offering.
>>> The latest Featured Stock Update with an annotated graph appeared on 11/26/2010. Click here.
View all notes |
Alert me of new notes |
CANSLIM.net Company Profile |
SEC |
Zacks Reports |
StockTalk |
News |
Chart |
Request a new note
C
A N
S L
I M
|
CMG
-
NYSE
Chipotle Mexican Grill
LEISURE - Restaurants
|
$223.63
|
+10.97
5.16% |
$224.84
|
1,216,927
112.11% of 50 DAV
50 DAV is 1,085,500
|
$262.78
-14.90%
|
9/1/2010
|
$158.31
|
PP = $155.52
|
|
MB = $163.30
|
Most Recent Note - 1/3/2011 5:02:33 PM
G - Considerable gain today with better and slightly above average volume, rallying back above the previously noted chart low ($221.41 on 12/14/10). Rising toward its still rising 50 DMA line which may now act as resistance. Technically, recent violations triggered sell signals and hinted that it may be due for a longer and deeper consolidation, while subsequent gains above its short-term average would help its outlook improve.
>>> The latest Featured Stock Update with an annotated graph appeared on 12/17/2010. Click here.
View all notes |
Alert me of new notes |
CANSLIM.net Company Profile |
SEC |
Zacks Reports |
StockTalk |
News |
Chart |
Request a new note
C
A N
S L
I M
|
Symbol/Exchange
Company Name
Industry Group |
PRICE |
CHANGE
(%Change) |
Day High |
Volume
(% DAV)
(% 50 day avg vol) |
52 Wk Hi
% From Hi |
Featured
Date |
Price
Featured |
Pivot Featured |
|
Max Buy |
DECK
-
NASDAQ
Deckers Outdoor Corp
CONSUMER NON-DURABLES - Textile - Apparel Footwear
|
$81.23
|
+1.49
1.87% |
$81.58
|
2,292,083
120.02% of 50 DAV
50 DAV is 1,909,800
|
$87.88
-7.57%
|
10/27/2010
|
$54.16
|
PP = $54.86
|
|
MB = $57.60
|
Most Recent Note - 12/31/2010 3:12:11 PM
G - Volume totals have been cooling during its brief consolidation. It is extended well above its 50 DMA line, not near any sound base.
>>> The latest Featured Stock Update with an annotated graph appeared on 12/16/2010. Click here.
View all notes |
Alert me of new notes |
CANSLIM.net Company Profile |
SEC |
Zacks Reports |
StockTalk |
News |
Chart |
Request a new note
C
A N
S L
I M
|
EZCH
-
NASDAQ
Ezchip Semiconductor Ltd
ELECTRONICS - Semiconductor - Specialized
|
$29.78
|
+1.68
5.98% |
$30.00
|
433,281
167.55% of 50 DAV
50 DAV is 258,600
|
$29.73
0.17%
|
12/2/2010
|
$27.53
|
PP = $26.00
|
|
MB = $27.30
|
Most Recent Note - 1/3/2011 12:50:05 PM
G - Considerable gain today with volume picking up, rallying to within -1% of its 52-week high. Prior chart highs in the $26 area coincide with its 50 DMA line defining an important technical support level to watch.
>>> The latest Featured Stock Update with an annotated graph appeared on 12/2/2010. Click here.
View all notes |
Alert me of new notes |
CANSLIM.net Company Profile |
SEC |
Zacks Reports |
StockTalk |
News |
Chart |
Request a new note
C
A N
S L
I M
|
EZPW
-
NASDAQ
Ezcorp Inc Cl A
SPECIALTY RETAIL - Specialty Retail, Other
|
$27.91
|
+0.78
2.88% |
$28.07
|
457,102
130.38% of 50 DAV
50 DAV is 350,600
|
$28.75
-2.92%
|
11/5/2010
|
$24.02
|
PP = $23.85
|
|
MB = $25.04
|
Most Recent Note - 1/3/2011 5:33:00 PM
G - Gapped up today for a solid gain on higher volume, finishing only -2.9% off its 52-week high and 37 cents off its best ever close. Extended from a sound base pattern, its 50 DMA line defines important support. See the latest FSU analysis for details and an annotated graph.
>>> The latest Featured Stock Update with an annotated graph appeared on 12/29/2010. Click here.
View all notes |
Alert me of new notes |
CANSLIM.net Company Profile |
SEC |
Zacks Reports |
StockTalk |
News |
Chart |
Request a new note
C
A N
S L
I M
|
FFIV
-
NASDAQ
F 5 Networks Inc
INTERNET - Internet Software and Services
|
$134.33
|
+4.17
3.20% |
$137.69
|
2,307,418
83.82% of 50 DAV
50 DAV is 2,752,700
|
$143.75
-6.55%
|
6/16/2010
|
$74.50
|
PP = $74.10
|
|
MB = $77.81
|
Most Recent Note - 1/3/2011 5:36:55 PM
G - Volume was higher behind today's gap up gain, but still the total was below average. It is perched -6.6% off its 52-week high. Recent lows define chart support just above its 50 DMA line.
>>> The latest Featured Stock Update with an annotated graph appeared on 12/28/2010. Click here.
View all notes |
Alert me of new notes |
CANSLIM.net Company Profile |
SEC |
Zacks Reports |
StockTalk |
News |
Chart |
Request a new note
C
A N
S L
I M
|
FOSL
-
NASDAQ
Fossil Inc
CONSUMER DURABLES - Recreational Goods, Other
|
$72.69
|
+2.21
3.14% |
$72.82
|
599,455
76.71% of 50 DAV
50 DAV is 781,500
|
$74.34
-2.22%
|
11/26/2010
|
$69.10
|
PP = $70.17
|
|
MB = $73.68
|
Most Recent Note - 1/3/2011 5:41:29 PM
Y - Gapped up today for a gain with below average volume, finishing the session less than a dollar from its highest ever closes and still below its "max buy" level. It stalled following its technical breakout on 12/02/10 from an advanced "3-weeks tight" pattern. Its 50 DMA line defines important support to watch.
>>> The latest Featured Stock Update with an annotated graph appeared on 11/29/2010. Click here.
View all notes |
Alert me of new notes |
CANSLIM.net Company Profile |
SEC |
Zacks Reports |
StockTalk |
News |
Chart |
Request a new note
C
A N
S L
I M
|
Symbol/Exchange
Company Name
Industry Group |
PRICE |
CHANGE
(%Change) |
Day High |
Volume
(% DAV)
(% 50 day avg vol) |
52 Wk Hi
% From Hi |
Featured
Date |
Price
Featured |
Pivot Featured |
|
Max Buy |
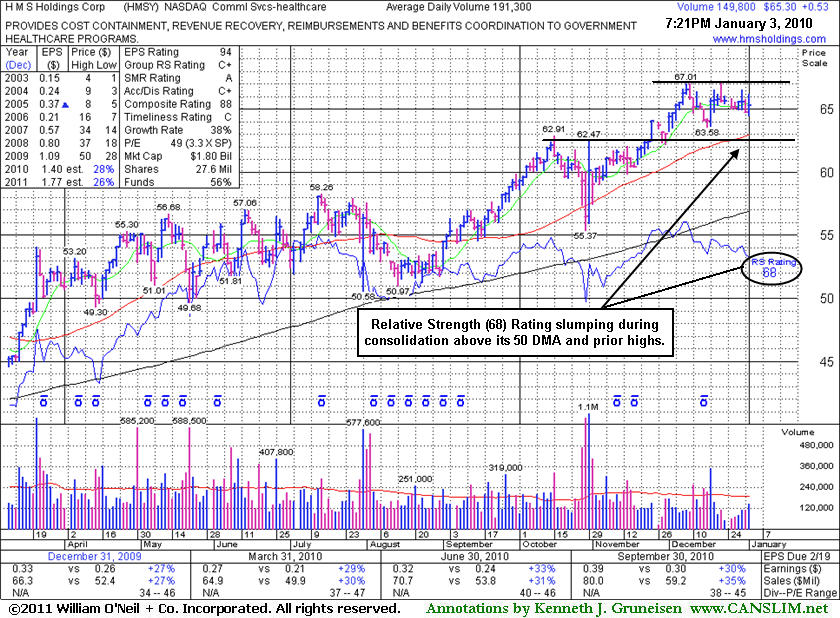
HMSY
-
NASDAQ
H M S Holdings Corp
COMPUTER SOFTWARE and SERVICES - Healthcare Information Service
|
$65.30
|
+0.53
0.82% |
$66.19
|
151,115
78.99% of 50 DAV
50 DAV is 191,300
|
$67.10
-2.68%
|
11/19/2010
|
$61.89
|
PP = $63.01
|
|
MB = $66.16
|
Most Recent Note - 1/3/2011 7:48:21 PM
G - Quietly holding its ground -2.7% off its high since a negative reversal on 12/22/10. Its Relative Strength rank of 64 now is a concern. See the latest FSU analysis for additional details and an annotated graph.
>>> The latest Featured Stock Update with an annotated graph appeared on 1/3/2011. Click here.
View all notes |
Alert me of new notes |
CANSLIM.net Company Profile |
SEC |
Zacks Reports |
StockTalk |
News |
Chart |
Request a new note
C
A N
S L
I M
|
JOBS
-
NASDAQ
Fifty One Job Inc Ads
DIVERSIFIED SERVICES - Staffing and; Outsourcing Service
|
$51.16
|
+1.91
3.88% |
$51.71
|
111,971
65.33% of 50 DAV
50 DAV is 171,400
|
$55.50
-7.82%
|
10/13/2010
|
$42.07
|
PP = $40.60
|
|
MB = $42.63
|
Most Recent Note - 1/3/2011 5:29:06 PM
G - Gapped up today for a gain on light volume after staying above its 50 DMA line last week. Volume totals have recently been cooling. It has not formed a sound new base, only consolidating for the past 3 weeks after recently challenging its all-time high near $55 from 2004.
>>> The latest Featured Stock Update with an annotated graph appeared on 12/30/2010. Click here.
View all notes |
Alert me of new notes |
CANSLIM.net Company Profile |
SEC |
Zacks Reports |
StockTalk |
News |
Chart |
Request a new note
C
A N
S L
I M
|
LULU
-
NASDAQ
Lululemon Athletica
MANUFACTURING - Textile Manufacturing
|
$71.58
|
+3.16
4.62% |
$72.02
|
2,268,432
136.98% of 50 DAV
50 DAV is 1,656,000
|
$74.60
-4.05%
|
10/8/2010
|
$47.66
|
PP = $46.67
|
|
MB = $49.00
|
Most Recent Note - 1/3/2011 12:58:04 PM
G - Considerable gain today with volume picking up, rallying back to within -4% of its all-time high. There is no near-term chart support, meanwhile it is extended from its 50 DMA line (now $55.76).
>>> The latest Featured Stock Update with an annotated graph appeared on 12/1/2010. Click here.
View all notes |
Alert me of new notes |
CANSLIM.net Company Profile |
SEC |
Zacks Reports |
StockTalk |
News |
Chart |
Request a new note
C
A N
S L
I M
|
MWIV
-
NASDAQ
M W I Veterinary Supply
HEALTH SERVICES - Medical Instruments and; Supplies
|
$64.63
|
+1.48
2.34% |
$65.83
|
32,957
61.37% of 50 DAV
50 DAV is 53,700
|
$65.84
-1.84%
|
11/4/2010
|
$61.79
|
PP = $59.60
|
|
MB = $62.58
|
Most Recent Note - 12/31/2010 6:15:30 PM
G - Pulling back from its 52-week high, today it closed near the session low with volume light behind a 4th consecutive small loss. It paused since 12/27/10 following a streak of 6 consecutive gains with higher volume totals.
>>> The latest Featured Stock Update with an annotated graph appeared on 12/21/2010. Click here.
View all notes |
Alert me of new notes |
CANSLIM.net Company Profile |
SEC |
Zacks Reports |
StockTalk |
News |
Chart |
Request a new note
C
A N
S L
I M
|
NEOG
-
NASDAQ
Neogen Corp
DRUGS - Diagnostic Substances
|
$42.26
|
+1.23
3.00% |
$42.61
|
221,088
274.99% of 50 DAV
50 DAV is 80,400
|
$42.47
-0.49%
|
9/1/2010
|
$30.79
|
PP = $30.49
|
|
MB = $32.01
|
Most Recent Note - 1/3/2011 1:04:41 PM
G - Small gap up gain today leaves it perched -1.3% from its all-time high, after a brief consolidation in a tight range. Its 50 DMA line has been a reliable support level.
>>> The latest Featured Stock Update with an annotated graph appeared on 12/6/2010. Click here.
View all notes |
Alert me of new notes |
CANSLIM.net Company Profile |
SEC |
Zacks Reports |
StockTalk |
News |
Chart |
Request a new note
C
A N
S L
I M
|
Symbol/Exchange
Company Name
Industry Group |
PRICE |
CHANGE
(%Change) |
Day High |
Volume
(% DAV)
(% 50 day avg vol) |
52 Wk Hi
% From Hi |
Featured
Date |
Price
Featured |
Pivot Featured |
|
Max Buy |
NFLX
-
NASDAQ
Netflix Inc
SPECIALTY RETAIL - Music and Video Stores
|
$178.41
|
+2.71
1.54% |
$180.87
|
5,707,970
93.56% of 50 DAV
50 DAV is 6,101,000
|
$206.80
-13.73%
|
11/9/2010
|
$173.10
|
PP = $184.84
|
|
MB = $194.08
|
Most Recent Note - 12/31/2010 6:18:36 PM
G - Small loss today with light volume led to technically violating its 50 DMA line for the first time since early-August, raising some concerns. As it trades near recent lows defining near-term support, more damaging losses could trigger more serious technical sell signals.
>>> The latest Featured Stock Update with an annotated graph appeared on 11/24/2010. Click here.
View all notes |
Alert me of new notes |
CANSLIM.net Company Profile |
SEC |
Zacks Reports |
StockTalk |
News |
Chart |
Request a new note
C
A N
S L
I M
|
NTAP
-
NASDAQ
Netapp Inc
COMPUTER HARDWARE - Data Storage Devices
|
$57.41
|
+2.45
4.46% |
$57.51
|
7,446,299
133.95% of 50 DAV
50 DAV is 5,559,200
|
$57.96
-0.95%
|
9/8/2010
|
$46.98
|
PP = $44.99
|
|
MB = $47.24
|
Most Recent Note - 1/3/2011 5:23:04 PM
G - Today's gain with +34% above average volume led to a new high close, rising from what some have labeled a "cup-with-handle" base. However, a flaw in that setup pattern is that the pullback following its 12/13/10 high of $56.55 led to a retracement below the middle point of the overall cup's depth. After high-volume whipsaw action in mid-November the volume totals have been generally cooling, and it found support near its 50 DMA line, working on building a new base. No overhead supply remains to hinder its progress.
>>> The latest Featured Stock Update with an annotated graph appeared on 12/27/2010. Click here.
View all notes |
Alert me of new notes |
CANSLIM.net Company Profile |
SEC |
Zacks Reports |
StockTalk |
News |
Chart |
Request a new note
C
A N
S L
I M
|
ORCL
-
NASDAQ
Oracle Corp
COMPUTER SOFTWARE and SERVICES - Application Software
|
$31.62
|
+0.32
1.02% |
$31.94
|
20,970,477
74.24% of 50 DAV
50 DAV is 28,246,100
|
$32.27
-2.01%
|
12/7/2010
|
$29.05
|
PP = $29.92
|
|
MB = $31.42
|
Most Recent Note - 12/31/2010 6:20:59 PM
G - Volume remains very light while stubbornly holding its ground in a tight range -3% off its 52-week high. Extended from a sound base, with support at prior chart highs and its 50 DMA line.
>>> The latest Featured Stock Update with an annotated graph appeared on 11/18/2010. Click here.
View all notes |
Alert me of new notes |
CANSLIM.net Company Profile |
SEC |
Zacks Reports |
StockTalk |
News |
Chart |
Request a new note
C
A N
S L
I M
|
PAY
-
NYSE
Verifone Systems Inc
COMPUTER HARDWARE - Transaction Automation Systems
|
$39.74
|
+1.18
3.06% |
$40.37
|
1,398,253
95.41% of 50 DAV
50 DAV is 1,465,500
|
$41.47
-4.17%
|
11/29/2010
|
$33.96
|
PP = $36.04
|
|
MB = $37.84
|
Most Recent Note - 1/3/2011 5:46:05 PM
G - Powered higher on near average volume today, closing -4.2% off its all-time high. It has not formed a sound base. Prior high in the $36 area coincides with its 50 DMA line defining important near-term chart support to watch.
>>> The latest Featured Stock Update with an annotated graph appeared on 12/15/2010. Click here.
View all notes |
Alert me of new notes |
CANSLIM.net Company Profile |
SEC |
Zacks Reports |
StockTalk |
News |
Chart |
Request a new note
C
A N
S L
I M
|
PCLN
-
NASDAQ
Priceline.Com Inc
INTERNET - Internet Software and Services
|
$415.99
|
+16.44
4.11% |
$415.99
|
1,323,564
127.97% of 50 DAV
50 DAV is 1,034,300
|
$428.10
-2.83%
|
11/1/2002
|
$399.55
|
PP = $428.20
|
|
MB = $449.61
|
Most Recent Note - 1/3/2011 5:26:41 PM
Y - Considerable gap up gain today with higher volume helped it rally from its 50 DMA line toward its best prior closes in the $420 area. Returned to the Featured Stocks list with its appearance in the January 2011 CANSLIM.net News (read here) including detailed analysis and annotated daily and weekly graphs.
>>> The latest Featured Stock Update with an annotated graph appeared on 1/2/2011. Click here.
View all notes |
Alert me of new notes |
CANSLIM.net Company Profile |
SEC |
Zacks Reports |
StockTalk |
News |
Chart |
Request a new note
C
A N
S L
I M
|
Symbol/Exchange
Company Name
Industry Group |
PRICE |
CHANGE
(%Change) |
Day High |
Volume
(% DAV)
(% 50 day avg vol) |
52 Wk Hi
% From Hi |
Featured
Date |
Price
Featured |
Pivot Featured |
|
Max Buy |
RAX
-
NYSE
Rackspace Hosting Inc
INTERNET - Internet Software and; Services
|
$31.43
|
+0.02
0.06% |
$32.44
|
1,623,893
90.86% of 50 DAV
50 DAV is 1,787,200
|
$32.69
-3.85%
|
9/21/2010
|
$22.84
|
PP = $23.61
|
|
MB = $24.79
|
Most Recent Note - 12/31/2010 6:23:05 PM
G - Stubbornly holding its ground -3.9% off its all-time high. No resistance remains due to overhead supply, but it is extended from any sound base.
>>> The latest Featured Stock Update with an annotated graph appeared on 12/31/2010. Click here.
View all notes |
Alert me of new notes |
CANSLIM.net Company Profile |
SEC |
Zacks Reports |
StockTalk |
News |
Chart |
Request a new note
C
A N
S L
I M
|
ROVI
-
NASDAQ
Rovi Corp
COMPUTER SOFTWARE andamp; SERVICES - Security Software andamp; Services
|
$63.11
|
+1.10
1.77% |
$63.87
|
2,163,150
188.41% of 50 DAV
50 DAV is 1,148,100
|
$62.50
0.98%
|
10/29/2010
|
$49.99
|
PP = $53.10
|
|
MB = $55.76
|
Most Recent Note - 1/3/2011 5:49:20 PM
G - Hit yet another new 52-week high today with above average volume behind a 6th consecutive gain. Extended from a sound base, meanwhile its 50 DMA line defines support just below a recent chart low ($55.65 on 12/23/10).
>>> The latest Featured Stock Update with an annotated graph appeared on 12/13/2010. Click here.
View all notes |
Alert me of new notes |
CANSLIM.net Company Profile |
SEC |
Zacks Reports |
StockTalk |
News |
Chart |
Request a new note
C
A N
S L
I M
|
SHOO
-
NASDAQ
Steven Madden Limited
CONSUMER NON-DURABLES - Textile - Apparel Footwear
|
$42.59
|
+0.87
2.09% |
$42.69
|
461,592
127.58% of 50 DAV
50 DAV is 361,800
|
$47.69
-10.69%
|
11/23/2010
|
$44.61
|
PP = $44.95
|
|
MB = $47.20
|
Most Recent Note - 12/31/2010 6:27:38 PM
G - Today's 4th consecutive loss has it slumping further below its 50 DMA line and prior lows, raising greater concerns while triggering technical sell signals, even though volume totals have been below average. Old highs near $40 define the nearest chart support below its short-term average.
>>> The latest Featured Stock Update with an annotated graph appeared on 11/23/2010. Click here.
View all notes |
Alert me of new notes |
CANSLIM.net Company Profile |
SEC |
Zacks Reports |
StockTalk |
News |
Chart |
Request a new note
C
A N
S L
I M
|
SLW
-
NYSE
Silver Wheaton Corp
METALS and; MINING - Silver
|
$38.58
|
-0.46
-1.18% |
$40.00
|
9,090,251
88.72% of 50 DAV
50 DAV is 10,246,500
|
$42.34
-8.88%
|
8/25/2010
|
$21.40
|
PP = $21.99
|
|
MB = $23.09
|
Most Recent Note - 12/31/2010 2:39:04 PM
G - Gapped up today, rallying without great volume conviction while consolidating since its negative reversal at an all-time high on 12/07/10. Recent chart low and its 50 DMA line define support to watch near the $35 area.
>>> The latest Featured Stock Update with an annotated graph appeared on 12/8/2010. Click here.
View all notes |
Alert me of new notes |
CANSLIM.net Company Profile |
SEC |
Zacks Reports |
StockTalk |
News |
Chart |
Request a new note
C
A N
S L
I M
|
UA
-
NYSE
Under Armour Inc Cl A
CONSUMER NON-DURABLES - Textile - Apparel Clothing
|
$55.57
|
+0.73
1.33% |
$56.20
|
864,091
120.95% of 50 DAV
50 DAV is 714,400
|
$60.14
-7.60%
|
9/9/2010
|
$39.99
|
PP = $40.10
|
|
MB = $42.11
|
Most Recent Note - 12/31/2010 3:32:53 PM
G - Volume totals have been cooling while consolidating near its 50 DMA line ($53.42 now) defining important support.
>>> The latest Featured Stock Update with an annotated graph appeared on 12/23/2010. Click here.
View all notes |
Alert me of new notes |
CANSLIM.net Company Profile |
SEC |
Zacks Reports |
StockTalk |
News |
Chart |
Request a new note
C
A N
S L
I M
|
Symbol/Exchange
Company Name
Industry Group |
PRICE |
CHANGE
(%Change) |
Day High |
Volume
(% DAV)
(% 50 day avg vol) |
52 Wk Hi
% From Hi |
Featured
Date |
Price
Featured |
Pivot Featured |
|
Max Buy |
ULTA
-
NASDAQ
Ulta Salon Cosm & Frag
SPECIALTY RETAIL - Specialty Retail, Other
|
$34.32
|
+0.32
0.94% |
$34.50
|
392,310
74.90% of 50 DAV
50 DAV is 523,800
|
$37.24
-7.84%
|
9/3/2010
|
$26.36
|
PP = $25.89
|
|
MB = $27.18
|
Most Recent Note - 12/31/2010 3:34:23 PM
G - Volume totals are still cooling while consolidating just above its 50 DMA line. Subsequent deterioration below it or the most recent chart low ($32.01 on 12/15/10) could raise concerns and trigger technical sell signals.
>>> The latest Featured Stock Update with an annotated graph appeared on 12/22/2010. Click here.
View all notes |
Alert me of new notes |
CANSLIM.net Company Profile |
SEC |
Zacks Reports |
StockTalk |
News |
Chart |
Request a new note
C
A N
S L
I M
|