***Last / Change / Volume data in this table is the closing quote data***
Symbol/Exchange
Company Name
Industry Group |
PRICE |
CHANGE
(%Change) |
Day High |
Volume
(% DAV)
(% 50 day avg vol) |
52 Wk Hi
% From Hi |
Featured
Date |
Price
Featured |
Pivot Featured |
|
Max Buy |
ABV
-
NYSE
Comp De Bebidas Adr
FOOD and BEVERAGE - Beverages - Brewers
|
$31.03
|
-0.09
-0.29% |
$32.00
|
1,576,948
56.45% of 50 DAV
50 DAV is 2,793,600
|
$31.63
-1.90%
|
12/10/2010
|
$139.87
|
PP = $145.46
|
|
MB = $152.73
|
 Most Recent Note - 12/31/2010 5:49:22 PM
G - Reversed and closed near the session low today after hitting a new all-time high. Extended from its latest base pattern. Prior highs in the $29 area define important chart support to watch above its 50 DMA line. Do not be confused by the 5:1 split impacting its share price as of 12/28/10. (Previous data concerning Featured Price and Pivot Point will soon be adjusted).
>>> The latest Featured Stock Update with an annotated graph appeared on 12/3/2010. Click here.
View all notes |
Alert me of new notes |
CANSLIM.net Company Profile |
SEC |
Zacks Reports |
StockTalk |
News |
Chart |
Request a new note
C
A N
S L
I M


|
ARUN
-
NASDAQ
Aruba Networks Inc
COMPUTER HARDWARE - Networking andamp; Communication Dev
|
$20.88
|
-0.40
-1.88% |
$21.35
|
1,257,235
52.70% of 50 DAV
50 DAV is 2,385,500
|
$24.28
-14.00%
|
8/30/2010
|
$18.12
|
PP = $18.51
|
|
MB = $19.44
|
Most Recent Note - 12/31/2010 2:58:38 PM
G - Hovering near recent chart lows in the $20.00 area with volume totals cooling. Further deterioration may trigger more serious technical sell signals. For its outlook to improve, a rebound above its 50 DMA line is needed.
>>> The latest Featured Stock Update with an annotated graph appeared on 12/14/2010. Click here.
View all notes |
Alert me of new notes |
CANSLIM.net Company Profile |
SEC |
Zacks Reports |
StockTalk |
News |
Chart |
Request a new note
C
A N
S L
I M
|
CACC
-
NASDAQ
Credit Acceptance Corp
FINANCIAL SERVICES - Credit Services
|
$62.77
|
+1.18
1.92% |
$62.90
|
29,283
134.33% of 50 DAV
50 DAV is 21,800
|
$63.58
-1.27%
|
11/22/2010
|
$59.97
|
PP = $62.00
|
|
MB = $65.10
|
Most Recent Note - 12/31/2010 2:46:30 PM
Y - Consolidating in a tight trading range still after gains this week without great volume conviction helped it touch a new 52-week high. Relative Strength rating has slumped to 73 while it has stubbornly held its ground yet failed to make meaningful price progress since its 11/29/10 breakout.
>>> The latest Featured Stock Update with an annotated graph appeared on 12/20/2010. Click here.
View all notes |
Alert me of new notes |
CANSLIM.net Company Profile |
SEC |
Zacks Reports |
StockTalk |
News |
Chart |
Request a new note
C
A N
S L
I M
|
CIS
-
NYSE
Camelot Info Systems Ads
COMPUTER SOFTWARE andamp; SERVICES - Information Technology Service
|
$23.92
|
+0.04
0.17% |
$24.90
|
276,249
68.31% of 50 DAV
50 DAV is 404,400
|
$24.89
-3.90%
|
11/26/2010
|
$18.93
|
PP = $19.72
|
|
MB = $20.71
|
Most Recent Note - 12/31/2010 3:05:10 PM
G - Tested its all-time high with today's earlier gains. No resistance remains due to overhead supply after a choppy 5-week consolidation above prior highs and its 50 DMA line. On 12/09/10 it completed a Secondary Offering.
>>> The latest Featured Stock Update with an annotated graph appeared on 11/26/2010. Click here.
View all notes |
Alert me of new notes |
CANSLIM.net Company Profile |
SEC |
Zacks Reports |
StockTalk |
News |
Chart |
Request a new note
C
A N
S L
I M
|
CMG
-
NYSE
Chipotle Mexican Grill
LEISURE - Restaurants
|
$212.66
|
-5.11
-2.35% |
$217.91
|
653,307
59.90% of 50 DAV
50 DAV is 1,090,600
|
$262.78
-19.07%
|
9/1/2010
|
$158.31
|
PP = $155.52
|
|
MB = $163.30
|
Most Recent Note - 12/31/2010 3:10:10 PM
G - Concerns are increasing while it quietly is slumping further below its 50 DMA line and below the previously noted chart low ($221.41 on 12/14/10). Technically, those violations were sell signals, and the damage hints that it may be due for a longer and deeper consolidation.
>>> The latest Featured Stock Update with an annotated graph appeared on 12/17/2010. Click here.
View all notes |
Alert me of new notes |
CANSLIM.net Company Profile |
SEC |
Zacks Reports |
StockTalk |
News |
Chart |
Request a new note
C
A N
S L
I M
|
Symbol/Exchange
Company Name
Industry Group |
PRICE |
CHANGE
(%Change) |
Day High |
Volume
(% DAV)
(% 50 day avg vol) |
52 Wk Hi
% From Hi |
Featured
Date |
Price
Featured |
Pivot Featured |
|
Max Buy |
DECK
-
NASDAQ
Deckers Outdoor Corp
CONSUMER NON-DURABLES - Textile - Apparel Footwear
|
$79.74
|
-1.66
-2.04% |
$81.00
|
1,173,276
61.74% of 50 DAV
50 DAV is 1,900,200
|
$87.88
-9.26%
|
10/27/2010
|
$54.16
|
PP = $54.86
|
|
MB = $57.60
|
Most Recent Note - 12/31/2010 3:12:11 PM
G - Volume totals have been cooling during its brief consolidation. It is extended well above its 50 DMA line, not near any sound base.
>>> The latest Featured Stock Update with an annotated graph appeared on 12/16/2010. Click here.
View all notes |
Alert me of new notes |
CANSLIM.net Company Profile |
SEC |
Zacks Reports |
StockTalk |
News |
Chart |
Request a new note
C
A N
S L
I M
|
EZCH
-
NASDAQ
Ezchip Semiconductor Ltd
ELECTRONICS - Semiconductor - Specialized
|
$28.10
|
-0.16
-0.57% |
$28.35
|
137,045
50.55% of 50 DAV
50 DAV is 271,100
|
$29.73
-5.48%
|
12/2/2010
|
$27.53
|
PP = $26.00
|
|
MB = $27.30
|
Most Recent Note - 12/31/2010 5:53:30 PM
G - Volume totals have been below average while consolidating in a tight range, and it is perched only -5.5% off its 52-week high. Prior chart highs in the $26 area coincide with its 50 DMA line defining an important technical support level to watch.
>>> The latest Featured Stock Update with an annotated graph appeared on 12/2/2010. Click here.
View all notes |
Alert me of new notes |
CANSLIM.net Company Profile |
SEC |
Zacks Reports |
StockTalk |
News |
Chart |
Request a new note
C
A N
S L
I M
|
EZPW
-
NASDAQ
Ezcorp Inc Cl A
SPECIALTY RETAIL - Specialty Retail, Other
|
$27.13
|
-0.31
-1.13% |
$27.51
|
246,549
69.94% of 50 DAV
50 DAV is 352,500
|
$28.75
-5.63%
|
11/5/2010
|
$24.02
|
PP = $23.85
|
|
MB = $25.04
|
Most Recent Note - 12/31/2010 5:54:43 PM
G - Holding its ground stubbornly, perched only -5.5% off its 52-week high. Extended from a sound base pattern, its 50 DMA line defines important support. See the latest FSU analysis for details and an annotated graph.
>>> The latest Featured Stock Update with an annotated graph appeared on 12/29/2010. Click here.
View all notes |
Alert me of new notes |
CANSLIM.net Company Profile |
SEC |
Zacks Reports |
StockTalk |
News |
Chart |
Request a new note
C
A N
S L
I M
|
FFIV
-
NASDAQ
F 5 Networks Inc
INTERNET - Internet Software and Services
|
$130.16
|
-2.25
-1.70% |
$132.44
|
1,017,231
35.94% of 50 DAV
50 DAV is 2,830,000
|
$143.75
-9.45%
|
6/16/2010
|
$74.50
|
PP = $74.10
|
|
MB = $77.81
|
Most Recent Note - 12/31/2010 5:59:03 PM
G - Volume totals have been cooling while consolidating, and it has slumped -9.5% off its 52-week high. Today it dipped below its recent low ($129.59 on 12/16/10) previously noted as initial chart support just above its 50 DMA line ($126.86 now).
>>> The latest Featured Stock Update with an annotated graph appeared on 12/28/2010. Click here.
View all notes |
Alert me of new notes |
CANSLIM.net Company Profile |
SEC |
Zacks Reports |
StockTalk |
News |
Chart |
Request a new note
C
A N
S L
I M
|
FOSL
-
NASDAQ
Fossil Inc
CONSUMER DURABLES - Recreational Goods, Other
|
$70.48
|
-1.41
-1.96% |
$72.45
|
503,609
64.36% of 50 DAV
50 DAV is 782,500
|
$74.34
-5.19%
|
11/26/2010
|
$69.10
|
PP = $70.17
|
|
MB = $73.68
|
Most Recent Note - 12/31/2010 6:03:41 PM
Y - Still consolidating above prior highs while volume totals have been below average. Today marked its lowest close since it stalled following its technical breakout on 12/02/10 from an advanced "3-weeks tight" pattern. Its 50 DMA line ($67.51 now) defines important support.
>>> The latest Featured Stock Update with an annotated graph appeared on 11/29/2010. Click here.
View all notes |
Alert me of new notes |
CANSLIM.net Company Profile |
SEC |
Zacks Reports |
StockTalk |
News |
Chart |
Request a new note
C
A N
S L
I M
|
Symbol/Exchange
Company Name
Industry Group |
PRICE |
CHANGE
(%Change) |
Day High |
Volume
(% DAV)
(% 50 day avg vol) |
52 Wk Hi
% From Hi |
Featured
Date |
Price
Featured |
Pivot Featured |
|
Max Buy |
HMSY
-
NASDAQ
H M S Holdings Corp
COMPUTER SOFTWARE and SERVICES - Healthcare Information Service
|
$64.77
|
-0.82
-1.25% |
$65.80
|
114,223
59.52% of 50 DAV
50 DAV is 191,900
|
$67.10
-3.47%
|
11/19/2010
|
$61.89
|
PP = $63.01
|
|
MB = $66.16
|
Most Recent Note - 12/31/2010 6:09:34 PM
G - Quietly holding its ground -3.4% off its high since a negative reversal on 12/22/10. Prior highs in the $62 define initial chart support to watch along with its 50 DMA line. Its Relative Strength rank of 70 now is a concern, below the 80+ guideline normally expected of sound buy candidates.
>>> The latest Featured Stock Update with an annotated graph appeared on 11/19/2010. Click here.
View all notes |
Alert me of new notes |
CANSLIM.net Company Profile |
SEC |
Zacks Reports |
StockTalk |
News |
Chart |
Request a new note
C
A N
S L
I M
|
JOBS
-
NASDAQ
Fifty One Job Inc Ads
DIVERSIFIED SERVICES - Staffing and; Outsourcing Service
|
$49.25
|
+0.64
1.32% |
$49.90
|
72,000
41.74% of 50 DAV
50 DAV is 172,500
|
$55.50
-11.26%
|
10/13/2010
|
$42.07
|
PP = $40.60
|
|
MB = $42.63
|
Most Recent Note - 12/31/2010 6:13:14 PM
G - Fought to stay above its 50 DMA line this week with volume totals recently cooling. It has not formed a sound new base, only consolidating for the past 3 weeks after recently challenging its all-time high near $55 from 2004.
>>> The latest Featured Stock Update with an annotated graph appeared on 12/30/2010. Click here.
View all notes |
Alert me of new notes |
CANSLIM.net Company Profile |
SEC |
Zacks Reports |
StockTalk |
News |
Chart |
Request a new note
C
A N
S L
I M
|
LULU
-
NASDAQ
Lululemon Athletica
MANUFACTURING - Textile Manufacturing
|
$68.42
|
-1.13
-1.62% |
$69.52
|
1,044,189
63.17% of 50 DAV
50 DAV is 1,652,900
|
$74.60
-8.28%
|
10/8/2010
|
$47.66
|
PP = $46.67
|
|
MB = $49.00
|
Most Recent Note - 12/31/2010 6:13:59 PM
G - Consolidating -8.3% off its all-time high. There is no near-term chart support, meanwhile it is extended from its 50 DMA line (now $55.76).
>>> The latest Featured Stock Update with an annotated graph appeared on 12/1/2010. Click here.
View all notes |
Alert me of new notes |
CANSLIM.net Company Profile |
SEC |
Zacks Reports |
StockTalk |
News |
Chart |
Request a new note
C
A N
S L
I M
|
MWIV
-
NASDAQ
M W I Veterinary Supply
HEALTH SERVICES - Medical Instruments and; Supplies
|
$63.15
|
-1.48
-2.29% |
$65.23
|
26,605
47.17% of 50 DAV
50 DAV is 56,400
|
$65.84
-4.09%
|
11/4/2010
|
$61.79
|
PP = $59.60
|
|
MB = $62.58
|
Most Recent Note - 12/31/2010 6:15:30 PM
G - Pulling back from its 52-week high, today it closed near the session low with volume light behind a 4th consecutive small loss. It paused since 12/27/10 following a streak of 6 consecutive gains with higher volume totals.
>>> The latest Featured Stock Update with an annotated graph appeared on 12/21/2010. Click here.
View all notes |
Alert me of new notes |
CANSLIM.net Company Profile |
SEC |
Zacks Reports |
StockTalk |
News |
Chart |
Request a new note
C
A N
S L
I M
|
NEOG
-
NASDAQ
Neogen Corp
DRUGS - Diagnostic Substances
|
$41.03
|
-0.86
-2.05% |
$42.19
|
85,548
106.27% of 50 DAV
50 DAV is 80,500
|
$42.47
-3.39%
|
9/1/2010
|
$30.79
|
PP = $30.49
|
|
MB = $32.01
|
Most Recent Note - 12/31/2010 6:17:07 PM
G - Small loss this week broke a 6-week winning streak. Perched -3.3%v from its all-time high, extended from any sound base after steadily advancing. Its 50 DMA line has been a reliable support level.
>>> The latest Featured Stock Update with an annotated graph appeared on 12/6/2010. Click here.
View all notes |
Alert me of new notes |
CANSLIM.net Company Profile |
SEC |
Zacks Reports |
StockTalk |
News |
Chart |
Request a new note
C
A N
S L
I M
|
Symbol/Exchange
Company Name
Industry Group |
PRICE |
CHANGE
(%Change) |
Day High |
Volume
(% DAV)
(% 50 day avg vol) |
52 Wk Hi
% From Hi |
Featured
Date |
Price
Featured |
Pivot Featured |
|
Max Buy |
NFLX
-
NASDAQ
Netflix Inc
SPECIALTY RETAIL - Music and Video Stores
|
$175.70
|
-4.10
-2.28% |
$179.74
|
3,080,387
49.28% of 50 DAV
50 DAV is 6,251,200
|
$206.80
-15.04%
|
11/9/2010
|
$173.10
|
PP = $184.84
|
|
MB = $194.08
|
Most Recent Note - 12/31/2010 6:18:36 PM
G - Small loss today with light volume led to technically violating its 50 DMA line for the first time since early-August, raising some concerns. As it trades near recent lows defining near-term support, more damaging losses could trigger more serious technical sell signals.
>>> The latest Featured Stock Update with an annotated graph appeared on 11/24/2010. Click here.
View all notes |
Alert me of new notes |
CANSLIM.net Company Profile |
SEC |
Zacks Reports |
StockTalk |
News |
Chart |
Request a new note
C
A N
S L
I M
|
NTAP
-
NASDAQ
Netapp Inc
COMPUTER HARDWARE - Data Storage Devices
|
$54.96
|
+0.06
0.11% |
$55.04
|
1,807,142
31.06% of 50 DAV
50 DAV is 5,818,400
|
$57.96
-5.18%
|
9/8/2010
|
$46.98
|
PP = $44.99
|
|
MB = $47.24
|
Most Recent Note - 12/31/2010 6:19:37 PM
G - Volume totals have been very light while consolidating in a very tight trading range above its 50 DMA line, working on building a new base.
>>> The latest Featured Stock Update with an annotated graph appeared on 12/27/2010. Click here.
View all notes |
Alert me of new notes |
CANSLIM.net Company Profile |
SEC |
Zacks Reports |
StockTalk |
News |
Chart |
Request a new note
C
A N
S L
I M
|
ORCL
-
NASDAQ
Oracle Corp
COMPUTER SOFTWARE and SERVICES - Application Software
|
$31.30
|
+0.01
0.03% |
$31.33
|
11,716,389
39.82% of 50 DAV
50 DAV is 29,427,000
|
$32.27
-3.01%
|
12/7/2010
|
$29.05
|
PP = $29.92
|
|
MB = $31.42
|
Most Recent Note - 12/31/2010 6:20:59 PM
G - Volume remains very light while stubbornly holding its ground in a tight range -3% off its 52-week high. Extended from a sound base, with support at prior chart highs and its 50 DMA line.
>>> The latest Featured Stock Update with an annotated graph appeared on 11/18/2010. Click here.
View all notes |
Alert me of new notes |
CANSLIM.net Company Profile |
SEC |
Zacks Reports |
StockTalk |
News |
Chart |
Request a new note
C
A N
S L
I M
|
PAY
-
NYSE
Verifone Systems Inc
COMPUTER HARDWARE - Transaction Automation Systems
|
$38.56
|
-0.27
-0.70% |
$38.91
|
524,075
35.06% of 50 DAV
50 DAV is 1,495,000
|
$41.47
-7.02%
|
11/29/2010
|
$33.96
|
PP = $36.04
|
|
MB = $37.84
|
Most Recent Note - 12/31/2010 6:22:12 PM
G - Perched -7.0% off its all-time high with volume totals cooling. It has not formed a sound base. Prior high in the $36 area coincides with its 50 DMA line defining important support to watch.
>>> The latest Featured Stock Update with an annotated graph appeared on 12/15/2010. Click here.
View all notes |
Alert me of new notes |
CANSLIM.net Company Profile |
SEC |
Zacks Reports |
StockTalk |
News |
Chart |
Request a new note
C
A N
S L
I M
|
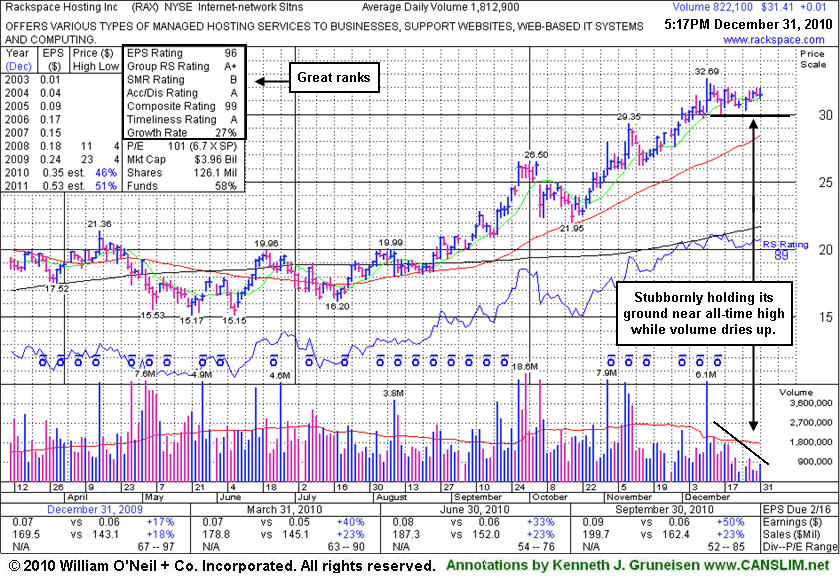
RAX
-
NYSE
Rackspace Hosting Inc
INTERNET - Internet Software and; Services
|
$31.41
|
+0.01
0.03% |
$31.94
|
822,054
44.58% of 50 DAV
50 DAV is 1,844,000
|
$32.69
-3.92%
|
9/21/2010
|
$22.84
|
PP = $23.61
|
|
MB = $24.79
|
Most Recent Note - 12/31/2010 6:23:05 PM
G - Stubbornly holding its ground -3.9% off its all-time high. No resistance remains due to overhead supply, but it is extended from any sound base.
>>> The latest Featured Stock Update with an annotated graph appeared on 12/31/2010. Click here.
View all notes |
Alert me of new notes |
CANSLIM.net Company Profile |
SEC |
Zacks Reports |
StockTalk |
News |
Chart |
Request a new note
C
A N
S L
I M
|
Symbol/Exchange
Company Name
Industry Group |
PRICE |
CHANGE
(%Change) |
Day High |
Volume
(% DAV)
(% 50 day avg vol) |
52 Wk Hi
% From Hi |
Featured
Date |
Price
Featured |
Pivot Featured |
|
Max Buy |
ROVI
-
NASDAQ
Rovi Corp
COMPUTER SOFTWARE andamp; SERVICES - Security Software andamp; Services
|
$62.01
|
+0.08
0.13% |
$62.50
|
1,035,147
91.48% of 50 DAV
50 DAV is 1,131,500
|
$62.07
-0.10%
|
10/29/2010
|
$49.99
|
PP = $53.10
|
|
MB = $55.76
|
Most Recent Note - 12/31/2010 6:26:09 PM
G - Hit yet another new 52-week high today with a 5th consecutive gain. Extended from a sound base, meanwhile its 50 DMA line defines support just below last week's low ($55.65 on 12/23/10).
>>> The latest Featured Stock Update with an annotated graph appeared on 12/13/2010. Click here.
View all notes |
Alert me of new notes |
CANSLIM.net Company Profile |
SEC |
Zacks Reports |
StockTalk |
News |
Chart |
Request a new note
C
A N
S L
I M
|
SHOO
-
NASDAQ
Steven Madden Limited
CONSUMER NON-DURABLES - Textile - Apparel Footwear
|
$41.72
|
-0.48
-1.14% |
$42.53
|
313,543
87.14% of 50 DAV
50 DAV is 359,800
|
$47.69
-12.52%
|
11/23/2010
|
$44.61
|
PP = $44.95
|
|
MB = $47.20
|
Most Recent Note - 12/31/2010 6:27:38 PM
G - Today's 4th consecutive loss has it slumping further below its 50 DMA line and prior lows, raising greater concerns while triggering technical sell signals, even though volume totals have been below average. Old highs near $40 define the nearest chart support below its short-term average.
>>> The latest Featured Stock Update with an annotated graph appeared on 11/23/2010. Click here.
View all notes |
Alert me of new notes |
CANSLIM.net Company Profile |
SEC |
Zacks Reports |
StockTalk |
News |
Chart |
Request a new note
C
A N
S L
I M
|
SLW
-
NYSE
Silver Wheaton Corp
METALS and; MINING - Silver
|
$39.04
|
+1.17
3.09% |
$39.24
|
6,558,448
63.21% of 50 DAV
50 DAV is 10,376,300
|
$42.34
-7.79%
|
8/25/2010
|
$21.40
|
PP = $21.99
|
|
MB = $23.09
|
Most Recent Note - 12/31/2010 2:39:04 PM
G - Gapped up today, rallying without great volume conviction while consolidating since its negative reversal at an all-time high on 12/07/10. Recent chart low and its 50 DMA line define support to watch near the $35 area.
>>> The latest Featured Stock Update with an annotated graph appeared on 12/8/2010. Click here.
View all notes |
Alert me of new notes |
CANSLIM.net Company Profile |
SEC |
Zacks Reports |
StockTalk |
News |
Chart |
Request a new note
C
A N
S L
I M
|
UA
-
NYSE
Under Armour Inc Cl A
CONSUMER NON-DURABLES - Textile - Apparel Clothing
|
$54.84
|
-0.30
-0.54% |
$55.35
|
449,505
62.50% of 50 DAV
50 DAV is 719,200
|
$60.14
-8.81%
|
9/9/2010
|
$39.99
|
PP = $40.10
|
|
MB = $42.11
|
Most Recent Note - 12/31/2010 3:32:53 PM
G - Volume totals have been cooling while consolidating near its 50 DMA line ($53.42 now) defining important support.
>>> The latest Featured Stock Update with an annotated graph appeared on 12/23/2010. Click here.
View all notes |
Alert me of new notes |
CANSLIM.net Company Profile |
SEC |
Zacks Reports |
StockTalk |
News |
Chart |
Request a new note
C
A N
S L
I M
|
ULTA
-
NASDAQ
Ulta Salon Cosm & Frag
SPECIALTY RETAIL - Specialty Retail, Other
|
$34.00
|
-0.34
-0.99% |
$34.57
|
219,750
41.29% of 50 DAV
50 DAV is 532,200
|
$37.24
-8.70%
|
9/3/2010
|
$26.36
|
PP = $25.89
|
|
MB = $27.18
|
Most Recent Note - 12/31/2010 3:34:23 PM
G - Volume totals are still cooling while consolidating just above its 50 DMA line. Subsequent deterioration below it or the most recent chart low ($32.01 on 12/15/10) could raise concerns and trigger technical sell signals.
>>> The latest Featured Stock Update with an annotated graph appeared on 12/22/2010. Click here.
View all notes |
Alert me of new notes |
CANSLIM.net Company Profile |
SEC |
Zacks Reports |
StockTalk |
News |
Chart |
Request a new note
C
A N
S L
I M
|
Symbol/Exchange
Company Name
Industry Group |
PRICE |
CHANGE
(%Change) |
Day High |
Volume
(% DAV)
(% 50 day avg vol) |
52 Wk Hi
% From Hi |
Featured
Date |
Price
Featured |
Pivot Featured |
|
Max Buy |