You are not logged in.
This means you
CAN ONLY VIEW reports that were published prior to Tuesday, April 15, 2025.
You
MUST UPGRADE YOUR MEMBERSHIP if you want to see any current reports.
AFTER MARKET UPDATE - FRIDAY, DECEMBER 23RD, 2011
Previous After Market Report Next After Market Report >>>
|
|
|
|
DOW |
+124.35 |
12,294.00 |
+1.02% |
|
Volume |
477,821,920 |
-38% |
|
Volume |
946,833,650 |
-36% |
|
NASDAQ |
+19.19 |
2,618.64 |
+0.74% |
|
Advancers |
2,063 |
66% |
|
Advancers |
1,360 |
51% |
|
S&P 500 |
+11.33 |
1,265.33 |
+0.90% |
|
Decliners |
923 |
30% |
|
Decliners |
1,183 |
44% |
|
Russell 2000 |
+2.47 |
747.98 |
+0.33% |
|
52 Wk Highs |
161 |
|
|
52 Wk Highs |
32 |
|
|
S&P 600 |
+1.36 |
419.66 |
+0.33% |
|
52 Wk Lows |
12 |
|
|
52 Wk Lows |
30 |
|
|
The staff at CANSLIM.net wishes all of our members a blessed holiday filled with happiness and many special moments with your family and friends. Please be advised that the market will be closed on Monday, December 26th. Our regular reports will resume on Tuesday.
The Q4 2011 CANSLIM.net Webcast is scheduled to air on Wednesday, December 28th at 8PM EST and it will be available "ON DEMAND" afterward to all upgraded members at no additional cost. If there is any topic you would like to see covered in the upcoming webcast please submit your comments or questions via the inquiry form. Thank you!
|
 |
Major Averages Rose With Less Volume
Kenneth J. Gruneisen - Passed the CAN SLIM® Master's Exam
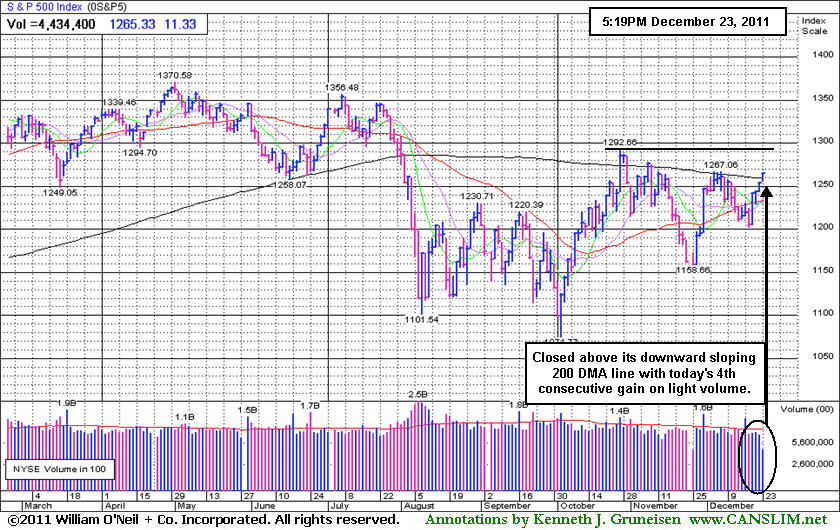
The volume totals were reported much lighter on the NYSE and on the Nasdaq exchange as stocks rallied into the closing bell to cap a four-day winning streak. The Dow Jones Industrial Average added 124.35 points to 12,294.00 for its highest close since July. Advancers outnumbered declining issues by about 2-1 on the NYSE and by about 6-5 on the Nasdaq exchange. New 52-week highs outnumbered new 52-week lows both on the NYSE and on the Nasdaq exchange. There were 37 high-ranked companies from the CANSLIM.net Leaders List that made new 52-week highs and appeared on the CANSLIM.net BreakOuts Page, down from the prior session total of 58 stocks. There were losses from only 4 of the 17 high-ranked companies currently included on the Featured Stocks Page.
Markets opened on higher ground following mixed U.S. economic data. A disappointing +0.1% increase in November consumer spending was muted by a better-than-expected +3.8% increase in last month's durable goods orders. On the housing front, new home sales for November rose +1.6%, just shy of estimates. A surprise jump in durable goods orders and a bi-partisan agreement in extending the payroll tax-cut provided optimism to the markets. European markets finished in the green. The FTSE in London closed +1% higher, the German DAX added +0.5%, and the CAC in France advanced +1%.
Tech stocks led the rally with shares of Rambus Inc (RMBS +12.16%) trading up after the company announced a 5-year licensing agreement with Broadcom Corp (BRCM -0.02%). American Greetings Corp (AM -3.06%) added to Thursday's declines as the number two greeting card company slumped. Chico's FAS Inc (CHS +5.45%) rose after rumors circulated that current share valuation makes the company a target for private equity investors. United Continental Holdings Inc (UAL -2.02%) fell after the airline said fourth-quarter domestic capacity was showing declines. Solar company SunPower Corp (SPWR +2.56%) was up after agreeing to purchase solar panel manufacturer Tenesol. AT&T Inc (T +0.71%) inched higher after the telecom giant received regulatory approval to acquire wireless spectrum from Qualcomm Inc (QCOM +0.46%) to improve the company's 4G capabilities.
The Q4 2011 CANSLIM.net Webcast is scheduled to air on Wednesday, December 28th at 8PM EST and it will be available "ON DEMAND" afterward to all upgraded members at no additional cost. Via the Premium Member Homepage links to all prior reports and webcasts are always available.
PICTURED: The S&P 500 Index rallied for a 4th consecutive gain on light volume to close above its downward sloping 200-day moving average (DMA) line and it moved into the green on the year.
|
 Kenneth J. Gruneisen started out as a licensed stockbroker in August 1987, a couple of months prior to the historic stock market crash that took the Dow Jones Industrial Average down -22.6% in a single day. He has published daily fact-based fundamental and technical analysis on high-ranked stocks online for two decades. Through FACTBASEDINVESTING.COM, Kenneth provides educational articles, news, market commentary, and other information regarding proven investment systems that work in good times and bad.
Comments contained in the body of this report are technical opinions only and are not necessarily those of Gruneisen Growth Corp. The material herein has been obtained from sources believed to be reliable and accurate, however, its accuracy and completeness cannot be guaranteed. Our firm, employees, and customers may effect transactions, including transactions contrary to any recommendation herein, or have positions in the securities mentioned herein or options with respect thereto. Any recommendation contained in this report may not be suitable for all investors and it is not to be deemed an offer or solicitation on our part with respect to the purchase or sale of any securities. |
|
 |
Financial, Tech, Energy, and Defensive Groups Rose
Kenneth J. Gruneisen - Passed the CAN SLIM® Master's Exam
Financial shares edged higher and the Broker/Dealer Index ($XBD +0.26%) and Bank Index ($BKX +0.66%) posted small gains along with the Retail Index ($RLX +0.49%) giving a positive influence to the major averages. The Internet Index ($IIX +0.71%), Biotechnology Index ($BTK +0.41%), Semiconductor Index ($SOX +0.49%), and Networking Index ($NWX +0.53%) ended unanimously higher with small gains. Energy-related shares also drifted higher and the Oil Services Index ($OSX +0.58%) and Integrated Oil Index ($XOI +0.81%) rose, and gains from defensive groups including the Healthcare Index ($HMO +1.38%) and Gold & Silver Index ($XAU +0.55%) rounded out Friday's quiet but solidly positive session.
Charts courtesy www.stockcharts.com
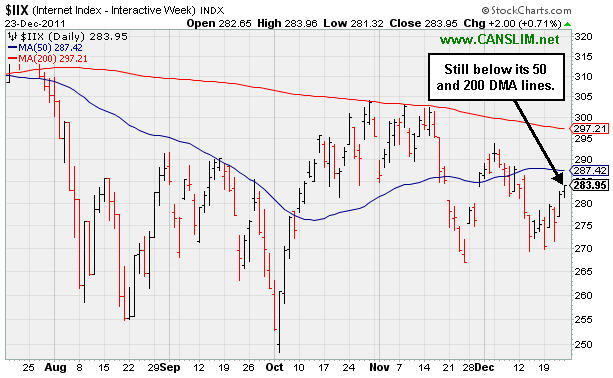
PICTURED: The Internet Index ($IIX +0.71%) is still below its 50-day and 200-day moving average (DMA) lines.
| Oil Services |
$OSX |
219.90 |
+1.27 |
+0.58% |
-10.29% |
| Healthcare |
$HMO |
2,338.06 |
+31.76 |
+1.38% |
+38.18% |
| Integrated Oil |
$XOI |
1,233.88 |
+9.89 |
+0.81% |
+1.71% |
| Semiconductor |
$SOX |
368.60 |
+1.79 |
+0.49% |
-10.49% |
| Networking |
$NWX |
219.40 |
+1.17 |
+0.53% |
-21.80% |
| Internet |
$IIX |
283.95 |
+2.00 |
+0.71% |
-7.73% |
| Broker/Dealer |
$XBD |
84.79 |
+0.22 |
+0.26% |
-30.22% |
| Retail |
$RLX |
528.77 |
+2.56 |
+0.49% |
+4.01% |
| Gold & Silver |
$XAU |
185.12 |
+1.01 |
+0.55% |
-18.30% |
| Bank |
$BKX |
39.94 |
+0.26 |
+0.66% |
-23.50% |
| Biotech |
$BTK |
1,074.70 |
+4.38 |
+0.41% |
-17.18% |
|
|
|
 |
Resilient Leader Reached New High Today
Kenneth J. Gruneisen - Passed the CAN SLIM® Master's Exam
Often, when a leading stock is setting up to breakout of a solid base it is highlighted in CANSLIM.net's Mid-Day Breakouts Report. The most relevant factors are noted in the report which allows prudent CANSLIM oriented investors to place the issue in their watch list. After doing any necessary backup research, the investor is prepared to act if and when the stock triggers a technical buy signal (breaks above its pivot point on more than +50% average turnover). In the event the stock fails to trigger a technical buy signal and its price declines then it will simply be removed from the watch list. In other cases, stocks may be featured in CANSLIM.net's Mid-Day Breakouts Report.after recent action already triggered technical buy signal. Disciplined investors know to buy as near as possible to the pivot point and avoid chasing stocks after they have rallied more than +5% above their pivot point. It is crucial to always limit losses whenever any stock heads the wrong direction, and disciplined investors sell if a struggling stock ever falls more than -7% from their purchase price.
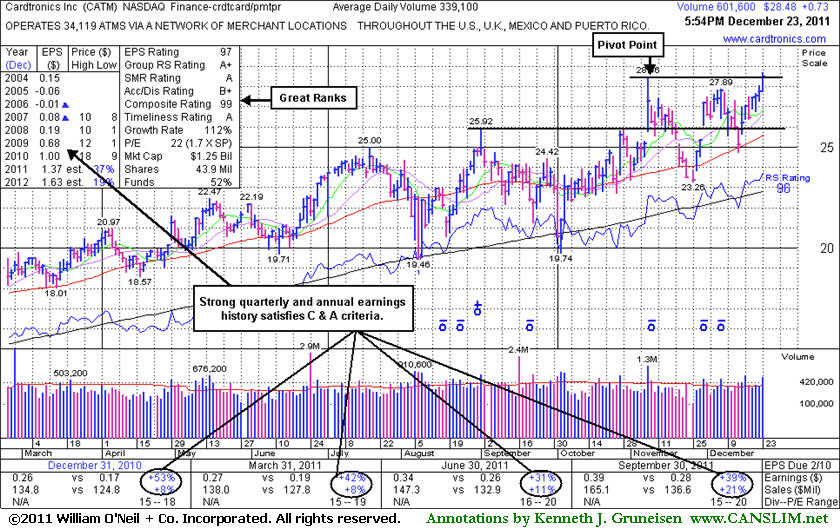
Cardtronics Inc (CATM +$0.73 or +2.63% to $28.48) was featured in yellow in the mid-day report (read here). Today's 4th consecutive gain was backed by +77% above average volume as it hit a new 52-week high. Its new pivot point cited was based on its 11/08/11 high plus 10 cents, so its close today actually left it just short of triggering a convincing technical buy signal. Confirming gains into new high territory with above average volume would be a welcome reassurance of accumulation by the institutional crowd. Disciplined investors who might look to accumulate shares could be wise to use a tactic called pyramiding.
Earlier it found prompt support at its 200-day moving average (DMA) line. Its last appearance in this FSU section was on 11/08/11 with an annotated graph under the headline, "Sales Revenues Increases Show Accelerating Growth." It was noted and dropped from the Featured Stocks list on 11/25/11 due to weak action, then it promptly repaired its 50-day moving average (DMA) violation. Later it found support at that important short-term average line during a subsequent pullback.
It reported earnings +39% on +21% sales revenues for the quarter ended September 30, 2011 versus the year ago period. Strong earnings increases above the +25% guideline in quarterly comparisons and strong annual earnings satisfy the C and A criteria. Sales revenues increases in recent comparisons (Mar, Jun, Sep '11) show encouraging sequential acceleration from +8%, +11%, to +21% in the latest report.
The number of top-rated funds owning its shares rose from 221 in Dec '10 to 318 in Sep '11, a reassuring sign concerning the I criteria. The Finance - Credit card/Payment Processing group has the best possible 99 Group RS Rating and leadership in other stocks in the industry group satisfies the L criteria.
|
|
|
Color Codes Explained :
Y - Better candidates highlighted by our
staff of experts.
G - Previously featured
in past reports as yellow but may no longer be buyable under the
guidelines.
***Last / Change / Volume data in this table is the closing quote data***
Symbol/Exchange
Company Name
Industry Group |
PRICE |
CHANGE
(%Change) |
Day High |
Volume
(% DAV)
(% 50 day avg vol) |
52 Wk Hi
% From Hi |
Featured
Date |
Price
Featured |
Pivot Featured |
|
Max Buy |
ADS
-
NYSE
Alliance Data Sys Corp
COMPUTER SOFTWARE and SERVICES - Information and Delivery Service
|
$105.74
|
+0.00
0.00% |
$106.34
|
274,756
31.89% of 50 DAV
50 DAV is 861,500
|
$107.33
-1.48%
|
10/21/2011
|
$97.94
|
PP = $101.15
|
|
MB = $106.21
|
Most Recent Note - 12/20/2011 2:32:27 PM
Y - Up today without great volume conviction while perched within striking distance of a best-ever close. Just above its 50 DMA line it found support last week, meanwhile any subsequent violation of that important short-term average would raise concerns.
>>> The latest Featured Stock Update with an annotated graph appeared on 12/14/2011. Click here.
View all notes |
Alert me of new notes |
CANSLIM.net Company Profile |
SEC |
Zacks Reports |
StockTalk |
News |
Chart |
Request a new note
C
A N
S L
I M


|
ALXN
-
NASDAQ
Alexion Pharmaceuticals
DRUGS - Drug Manufacturers - Other
|
$69.08
|
+1.72
2.55% |
$69.25
|
880,280
74.00% of 50 DAV
50 DAV is 1,189,500
|
$70.42
-1.90%
|
11/30/2011
|
$68.66
|
PP = $70.52
|
|
MB = $74.05
|
 Most Recent Note - 12/23/2011 6:22:41 PM
Y - Gain today with below average volume leaves it perched within close striking distance its all-time high. Recent lows near $62 define important near-term support to watch.
>>> The latest Featured Stock Update with an annotated graph appeared on 12/12/2011. Click here.
View all notes |
Alert me of new notes |
CANSLIM.net Company Profile |
SEC |
Zacks Reports |
StockTalk |
News |
Chart |
Request a new note
C
A N
S L
I M
|
CATM
-
NASDAQ
Cardtronics Inc
DIVERSIFIED SERVICES - Business/Management Services
|
$28.48
|
+0.73
2.63% |
$28.69
|
601,752
177.46% of 50 DAV
50 DAV is 339,100
|
$28.46
0.07%
|
12/23/2011
|
$28.64
|
PP = $28.56
|
|
MB = $29.99
|
Most Recent Note - 12/23/2011 6:20:57 PM
Y - Fundamentals remain strong and a 4th consecutive gain today backed by +77% above average volume helped it touch a new 52-week high, but it did not close above the new pivot point cited based on its 11/08/11 high plus 10 cents. See the latest FSU analysis for more details and a new annotated graph.
>>> The latest Featured Stock Update with an annotated graph appeared on 12/23/2011. Click here.
View all notes |
Alert me of new notes |
CANSLIM.net Company Profile |
SEC |
Zacks Reports |
StockTalk |
News |
Chart |
Request a new note
C
A N
S L
I M
|
CELG
-
NASDAQ
Celgene Corp
DRUGS - Drug Manufacturers - Major
|
$67.32
|
+0.23
0.34% |
$67.44
|
1,169,402
34.04% of 50 DAV
50 DAV is 3,435,800
|
$68.25
-1.36%
|
12/20/2011
|
$66.68
|
PP = $68.35
|
|
MB = $71.77
|
Most Recent Note - 12/20/2011 2:11:03 PM
Y - Gapped up today after a rebound above its 50 DMA line on the prior session helped its outlook improve. Color code is changed to yellow with a new pivot point cited based on its 52-week high plus 10 cents. Now only -2.2% off its 52-week high, subsequent volume-driven gains above the pivot point may trigger a new (or add-on) technical buy signal.
>>> The latest Featured Stock Update with an annotated graph appeared on 12/1/2011. Click here.
View all notes |
Alert me of new notes |
CANSLIM.net Company Profile |
SEC |
Zacks Reports |
StockTalk |
News |
Chart |
Request a new note
C
A N
S L
I M
|
FEIC
-
NASDAQ
F E I Co
ELECTRONICS - Diversified Electronics
|
$41.86
|
-0.01
-0.02% |
$42.00
|
79,243
22.30% of 50 DAV
50 DAV is 355,400
|
$42.25
-0.92%
|
12/7/2011
|
$41.41
|
PP = $42.35
|
|
MB = $44.47
|
Most Recent Note - 12/22/2011 5:45:15 PM
Y - Gapped up today and rallied for a best-ever close near its all-time high, but volume was below average behind its gain. Its 50 DMA line and prior lows in the $36 area define chart support. Disciplined investors would watch for a volume-driven gain above the pivot point to trigger a proper technical buy signal.
>>> The latest Featured Stock Update with an annotated graph appeared on 12/21/2011. Click here.
View all notes |
Alert me of new notes |
CANSLIM.net Company Profile |
SEC |
Zacks Reports |
StockTalk |
News |
Chart |
Request a new note
C
A N
S L
I M
|
Symbol/Exchange
Company Name
Industry Group |
PRICE |
CHANGE
(%Change) |
Day High |
Volume
(% DAV)
(% 50 day avg vol) |
52 Wk Hi
% From Hi |
Featured
Date |
Price
Featured |
Pivot Featured |
|
Max Buy |
GNC
-
NYSE
G N C Holdings Inc
RETAIL - Drug Stores
|
$28.65
|
+0.28
0.99% |
$29.00
|
558,157
33.05% of 50 DAV
50 DAV is 1,688,800
|
$29.50
-2.88%
|
10/26/2011
|
$24.60
|
PP = $24.80
|
|
MB = $26.04
|
Most Recent Note - 12/22/2011 5:43:15 PM
G - After touching another new all-time high today it reversed into the red for a small loss on below average volume. It is extended from its prior base pattern. Prior chart highs and its 50 DMA line coincide in the $25-26 area defining important support to watch on pullbacks.
>>> The latest Featured Stock Update with an annotated graph appeared on 12/16/2011. Click here.
View all notes |
Alert me of new notes |
CANSLIM.net Company Profile |
SEC |
Zacks Reports |
StockTalk |
News |
Chart |
Request a new note
C
A N
S L
I M
|
HMSY
-
NASDAQ
H M S Holdings Corp
COMPUTER SOFTWARE and SERVICES - Healthcare Information Service
|
$31.57
|
+0.16
0.51% |
$31.85
|
242,215
22.64% of 50 DAV
50 DAV is 1,069,700
|
$32.16
-1.83%
|
10/27/2011
|
$26.44
|
PP = $28.37
|
|
MB = $29.79
|
Most Recent Note - 12/20/2011 2:14:48 PM
G - Gapped up today and it is challenging its all-time high with no resistance remaining. It is extended from its prior base. Prior highs in the $27-28 area acted as support during the recent pullback.
>>> The latest Featured Stock Update with an annotated graph appeared on 11/30/2011. Click here.
View all notes |
Alert me of new notes |
CANSLIM.net Company Profile |
SEC |
Zacks Reports |
StockTalk |
News |
Chart |
Request a new note
C
A N
S L
I M
|
ISRG
-
NASDAQ
Intuitive Surgical Inc
HEALTH SERVICES - Medical Appliances and Equipment
|
$457.66
|
+9.80
2.19% |
$458.74
|
265,005
76.39% of 50 DAV
50 DAV is 346,900
|
$450.00
1.70%
|
12/20/2011
|
$442.43
|
PP = $449.16
|
|
MB = $471.62
|
Most Recent Note - 12/22/2011 5:47:09 PM
Y - Gain today on below average volume, finishing within close striking distance of new high territory. Color code was changed to yellow with new pivot point cited based on its 52-week high plus 10 cents. Volume driven gains above its pivot point may trigger a new (or add-on) technical buy signal. Important support is defined by its 50 DMA line.
>>> The latest Featured Stock Update with an annotated graph appeared on 12/13/2011. Click here.
View all notes |
Alert me of new notes |
CANSLIM.net Company Profile |
SEC |
Zacks Reports |
StockTalk |
News |
Chart |
Request a new note
C
A N
S L
I M
|
MELI
-
NASDAQ
Mercadolibre Inc
INTERNET - Internet Software and; Services
|
$82.40
|
-1.18
-1.41% |
$84.00
|
328,874
46.16% of 50 DAV
50 DAV is 712,400
|
$95.48
-13.70%
|
12/5/2011
|
$91.08
|
PP = $92.83
|
|
MB = $97.47
|
Most Recent Note - 12/22/2011 5:48:06 PM
G - Up today with below average volume after slumping near its 50 DMA line and prior lows defining chart support near the $80 area. It stalled after volume-driven gains to new all-time highs in early-December, yet it has not encountered heavy distributional pressure.
>>> The latest Featured Stock Update with an annotated graph appeared on 12/5/2011. Click here.
View all notes |
Alert me of new notes |
CANSLIM.net Company Profile |
SEC |
Zacks Reports |
StockTalk |
News |
Chart |
Request a new note
C
A N
S L
I M
|
MG
-
NYSE
Mistras Group Inc
DIVERSIFIED SERVICES - Bulding and Faci;ity Management Services
|
$24.72
|
+0.34
1.39% |
$25.17
|
95,870
61.46% of 50 DAV
50 DAV is 156,000
|
$25.28
-2.22%
|
10/28/2011
|
$22.49
|
PP = $23.61
|
|
MB = $24.79
|
Most Recent Note - 12/21/2011 1:19:01 PM
Y - Trading back above its previously cited pivot point today. Prior highs in the $23 area define chart support along with its 50 DMA line.
>>> The latest Featured Stock Update with an annotated graph appeared on 12/8/2011. Click here.
View all notes |
Alert me of new notes |
CANSLIM.net Company Profile |
SEC |
Zacks Reports |
StockTalk |
News |
Chart |
Request a new note
C
A N
S L
I M
|
Symbol/Exchange
Company Name
Industry Group |
PRICE |
CHANGE
(%Change) |
Day High |
Volume
(% DAV)
(% 50 day avg vol) |
52 Wk Hi
% From Hi |
Featured
Date |
Price
Featured |
Pivot Featured |
|
Max Buy |
MKTX
-
NASDAQ
Marketaxess Holdings Inc
FINANCIAL SERVICES - Investment Brokerage - Nationa
|
$29.47
|
-0.04
-0.14% |
$29.92
|
82,664
42.20% of 50 DAV
50 DAV is 195,900
|
$31.59
-6.71%
|
10/28/2011
|
$29.79
|
PP = $31.05
|
|
MB = $32.60
|
Most Recent Note - 12/21/2011 11:09:42 AM
Y - Gapped down today, abruptly reversing back into the prior base while promptly encountering distributional pressure similar to its abrupt reversal on 11/04/11. See the latest FSU analysis for more details and an annotated graph.
>>> The latest Featured Stock Update with an annotated graph appeared on 12/20/2011. Click here.
View all notes |
Alert me of new notes |
CANSLIM.net Company Profile |
SEC |
Zacks Reports |
StockTalk |
News |
Chart |
Request a new note
C
A N
S L
I M
|
OSIS
-
NASDAQ
O S I Systems Inc
ELECTRONICS - Semiconductor Equipment and Mate
|
$48.52
|
+0.37
0.77% |
$48.89
|
39,756
34.36% of 50 DAV
50 DAV is 115,700
|
$49.04
-1.06%
|
11/1/2011
|
$42.07
|
PP = $45.57
|
|
MB = $47.85
|
Most Recent Note - 12/20/2011 2:00:44 PM
Y - Considerable gain today has it rallying within striking distance of a best-ever close. It found support above its 50 DMA line but made no progress since its gap gain with +44% above average volume on 11/30/11 triggered a technical buy signal.
>>> The latest Featured Stock Update with an annotated graph appeared on 11/28/2011. Click here.
View all notes |
Alert me of new notes |
CANSLIM.net Company Profile |
SEC |
Zacks Reports |
StockTalk |
News |
Chart |
Request a new note
C
A N
S L
I M
|
PRGO
-
NASDAQ
Perrigo Co
DRUGS - Drug Related Products
|
$100.96
|
+0.18
0.18% |
$101.44
|
753,097
56.53% of 50 DAV
50 DAV is 1,332,100
|
$104.70
-3.57%
|
12/9/2011
|
$99.54
|
PP = $101.56
|
|
MB = $106.64
|
Most Recent Note - 12/20/2011 2:02:31 PM
Y - Gapped up today and it is rallying within striking distance of a best-ever close. Found impressive support while consolidating above its 50 DMA line recently. Insider buying was recently reported while perched near all-time highs, which is a reassuring sign. It has formed a late-stage base, however disciplined investors would watch for confirming gains to trigger a proper new technical buy signal. Chart readers may note that its Relative Strength line peaked in September and did not recently lead the way confirming new highs.
>>> The latest Featured Stock Update with an annotated graph appeared on 12/9/2011. Click here.
View all notes |
Alert me of new notes |
CANSLIM.net Company Profile |
SEC |
Zacks Reports |
StockTalk |
News |
Chart |
Request a new note
C
A N
S L
I M
|
RAX
-
NYSE
Rackspace Hosting Inc
INTERNET - Internet Software and; Services
|
$43.31
|
+0.12
0.28% |
$43.51
|
1,023,577
64.02% of 50 DAV
50 DAV is 1,598,800
|
$46.50
-6.85%
|
11/8/2011
|
$44.28
|
PP = $46.27
|
|
MB = $48.58
|
Most Recent Note - 12/21/2011 12:39:22 PM
Y - Down considerably today, erasing the prior streak of 4 consecutive small gains, yet still perched within striking distance of its 52-week and all-time high. Its 50 DMA line defines near-term support to watch. That short-term moving average has risen since its positive crossover with the 200 DMA line shown on the graph in the latest FSU analysis dated 12/07/11.
>>> The latest Featured Stock Update with an annotated graph appeared on 12/7/2011. Click here.
View all notes |
Alert me of new notes |
CANSLIM.net Company Profile |
SEC |
Zacks Reports |
StockTalk |
News |
Chart |
Request a new note
C
A N
S L
I M
|
SWI
-
NYSE
Solarwinds Inc
COMPUTER SOFTWARE and SERVICES - Application Software
|
$28.68
|
-0.24
-0.83% |
$28.94
|
510,519
39.94% of 50 DAV
50 DAV is 1,278,300
|
$33.68
-14.85%
|
10/27/2011
|
$27.78
|
PP = $25.62
|
|
MB = $26.90
|
Most Recent Note - 12/21/2011 11:17:57 AM
G - Considerable loss today has it trading below its 50 DMA line (now $29.04) raising some concerns. Subsequent deterioration below its 12/14/11 low ($28.50) may trigger a more worrisome technical sell signal leading to a deeper consolidation including a possible revisit to prior chart highs in the $25-26 area or its 200 DMA line.
>>> The latest Featured Stock Update with an annotated graph appeared on 12/19/2011. Click here.
View all notes |
Alert me of new notes |
CANSLIM.net Company Profile |
SEC |
Zacks Reports |
StockTalk |
News |
Chart |
Request a new note
C
A N
S L
I M
|
Symbol/Exchange
Company Name
Industry Group |
PRICE |
CHANGE
(%Change) |
Day High |
Volume
(% DAV)
(% 50 day avg vol) |
52 Wk Hi
% From Hi |
Featured
Date |
Price
Featured |
Pivot Featured |
|
Max Buy |
TDG
-
NYSE
Transdigm Group Inc
AEROSPACE/DEFENSE - Aerospace/Defense Products and; Services
|
$98.45
|
+1.20
1.23% |
$98.50
|
97,848
26.81% of 50 DAV
50 DAV is 365,000
|
$102.73
-4.17%
|
11/9/2011
|
$98.45
|
PP = $95.14
|
|
MB = $99.90
|
Most Recent Note - 12/20/2011 2:26:25 PM
Y - Small gap up gain today on lighter volume while perched within striking distance of a best-ever close. Its 50 DMA line defines near-term support above recent lows where subsequent violations would trigger technical sell signals.
>>> The latest Featured Stock Update with an annotated graph appeared on 12/6/2011. Click here.
View all notes |
Alert me of new notes |
CANSLIM.net Company Profile |
SEC |
Zacks Reports |
StockTalk |
News |
Chart |
Request a new note
C
A N
S L
I M
|
V
-
NYSE
Visa Inc Cl A
DIVERSIFIED SERVICES - Business/Management Services
|
$102.48
|
+1.94
1.93% |
$102.50
|
1,950,777
45.60% of 50 DAV
50 DAV is 4,277,600
|
$101.97
0.50%
|
10/24/2011
|
$94.21
|
PP = $94.85
|
|
MB = $99.59
|
Most Recent Note - 12/23/2011 6:24:30 PM
G - Gain today with light volume helped it rally further into new all-time high territory. It is extended from its prior base and trading above its "max buy" level. Prior highs in the $95 area and its 50 DMA line define chart support to watch on pullbacks.
>>> The latest Featured Stock Update with an annotated graph appeared on 12/15/2011. Click here.
View all notes |
Alert me of new notes |
CANSLIM.net Company Profile |
SEC |
Zacks Reports |
StockTalk |
News |
Chart |
Request a new note
C
A N
S L
I M
|
|
|
|
THESE ARE NOT BUY RECOMMENDATIONS!
Comments contained in the body of this report are technical
opinions only. The material herein has been obtained
from sources believed to be reliable and accurate, however,
its accuracy and completeness cannot be guaranteed.
This site is not an investment advisor, hence it does
not endorse or recommend any securities or other investments.
Any recommendation contained in this report may not
be suitable for all investors and it is not to be deemed
an offer or solicitation on our part with respect to
the purchase or sale of any securities. All trademarks,
service marks and trade names appearing in this report
are the property of their respective owners, and are
likewise used for identification purposes only.
This report is a service available
only to active Paid Premium Members.
You may opt-out of receiving report notifications
at any time. Questions or comments may be submitted
by writing to Premium Membership Services 665 S.E. 10 Street, Suite 201 Deerfield Beach, FL 33441-5634 or by calling 1-800-965-8307
or 954-785-1121.
|
|
|

