You are not logged in.
This means you
CAN ONLY VIEW reports that were published prior to Monday, April 7, 2025.
You
MUST UPGRADE YOUR MEMBERSHIP if you want to see any current reports.
AFTER MARKET UPDATE - THURSDAY, DECEMBER 11TH, 2014
Previous After Market Report Next After Market Report >>>
|
|
|
|
DOW |
+63.19 |
17,596.34 |
+0.36% |
|
Volume |
804,942,110 |
-10% |
|
Volume |
1,708,896,620 |
-0% |
|
NASDAQ |
+24.13 |
4,708.16 |
+0.52% |
|
Advancers |
1,793 |
56% |
|
Advancers |
1,892 |
62% |
|
S&P 500 |
+9.19 |
2,035.33 |
+0.45% |
|
Decliners |
1,307 |
41% |
|
Decliners |
1,096 |
36% |
|
Russell 2000 |
+5.09 |
1,166.96 |
+0.44% |
|
52 Wk Highs |
108 |
|
|
52 Wk Highs |
93 |
|
|
S&P 600 |
+2.31 |
672.79 |
+0.34% |
|
52 Wk Lows |
218 |
|
|
52 Wk Lows |
112 |
|
|
 |
Major Averages Posted Gains Without Great Volume Conviction
Kenneth J. Gruneisen - Passed the CAN SLIM® Master's Exam
Stocks advanced on Thursday's session. The Dow rose 63 points to 17,596. The S&P 500 gained 9 points to 2,035. The NASDAQ finished 24 points higher at 4,708. The volume was reported lighter on the NYSE and near the prior session total on the Nasdaq exchange. Breadth was positive as advancers led decliners by almost a 3-2 margin on the NYSE and on the Nasdaq exchange. There were 40 high-ranked companies from the CANSLIM.net Leaders List that made new 52-week highs and appeared on the CANSLIM.net BreakOuts Page, down from the prior session total of 44 stocks. New 52-week lows again outnumbered new 52-week highs on the NYSE and on the Nasdaq exchange. There were 10 gainers among the 12 high-ranked companies currently on the Featured Stocks Page. Recent weakness has put the uptrend under pressure. The market (M criteria) rally was noted in this daily Market Commentary since 10/21/14. Disciplined investors should be especially watchful for technical sell signals in individual issues until fresh strength appears in the broader market.
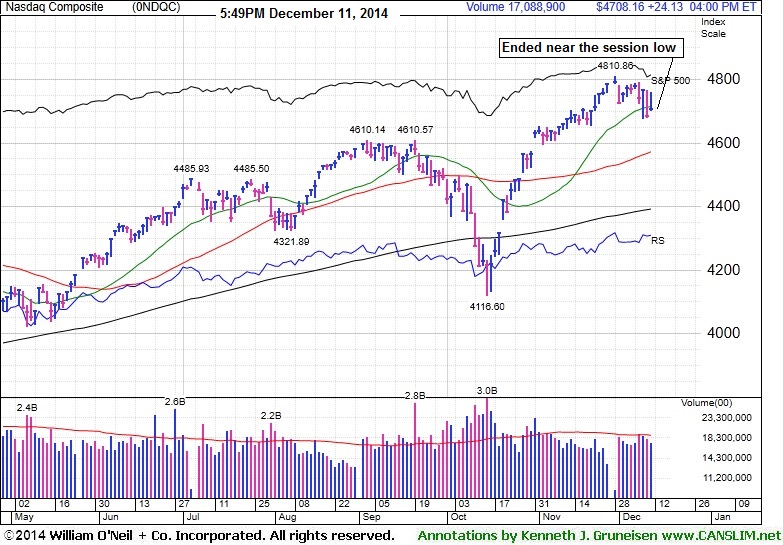
PICTURED: The Nasdaq Composite Index posted a gain but ended near the session low with volume near the prior session's below average total.
The major averages snapped a three-day decline following encouraging readings on the U.S. economy. Retail sales grew +0.7% in November, topping projections for a +0.4% increase. Weekly jobless claims edged down 3,000 to 294,000 versus the consensus projection to hold steady at 297,000. The market pared gains as oil fell to a five-month low and renewed concerns of possible government shutdown.
Consumer discretionary paced the market higher led by retailers. Lululemon (LULU +9.11%) rallied after the yoga apparel maker's quarterly results exceeded analyst forecasts. Utilities and tech also outperformed as Dominion Resources (D +2.07%) and Hewlett-Packard (HPQ +2.97%) posted solid gains. The energy sector gave back its gains to finish lower on the session. Transocean (RIG -2.13%) fell as WTI crude oil fell -2.5% to $59.44/barrel on the NYMEX. Materials were the worst performing group with miner Freeport McMoRan (FCX -4.09%) falling.
Treasuries were mostly lower following the positive retail sales figure. The 10-year note was down 2/32 to yield 2.17%. The 30-year bond gained 12/32 to yield 2.81% as a fresh $13 billion sale of the security drew solid demand. In commodities, COMEX gold futures fell -0.4% to $1,223.90/ounce.
Disciplined investors know that new buying efforts may be made under the fact-based investment system only in stocks meeting all key criteria. The Featured Stocks Page shows the most action-worthy candidates and their latest notes and a Headline Link directs members to the latest detailed analysis with data-packed graphs annotated by a Certified expert along with links to additional resources. The Premium Member Homepage includes "dynamic archives" to all prior pay reports published.
|
 Kenneth J. Gruneisen started out as a licensed stockbroker in August 1987, a couple of months prior to the historic stock market crash that took the Dow Jones Industrial Average down -22.6% in a single day. He has published daily fact-based fundamental and technical analysis on high-ranked stocks online for two decades. Through FACTBASEDINVESTING.COM, Kenneth provides educational articles, news, market commentary, and other information regarding proven investment systems that work in good times and bad.
Comments contained in the body of this report are technical opinions only and are not necessarily those of Gruneisen Growth Corp. The material herein has been obtained from sources believed to be reliable and accurate, however, its accuracy and completeness cannot be guaranteed. Our firm, employees, and customers may effect transactions, including transactions contrary to any recommendation herein, or have positions in the securities mentioned herein or options with respect thereto. Any recommendation contained in this report may not be suitable for all investors and it is not to be deemed an offer or solicitation on our part with respect to the purchase or sale of any securities. |
|
 |
Retail, Tech and Financial Gains Buoyed Major Averages
Kenneth J. Gruneisen - Passed the CAN SLIM® Master's Exam
The Networking Index ($NWX +1.13%) and Semiconductor Index ($SOX +0.47%) led the tech sector higher while the Biotechnology Index ($BTK +0.07%) finished flat. A solid gain from the Retail Index ($RLX +1.01%) underpinned the major averages' gains on Thursday while financial groups including the Bank Index ($BKX +0.22%) and Broker/Dealer Index ($XBD +0.35%) also posted modest gains. Energy-linked groups were mixed and little changed with the Oil Services Index ($OSX +0.22%) edging higher and the Integrated Oil Index ($XOI -0.29%) ending slightly lower. The Gold & Silver Index ($XAU -1.46%) fell.
Charts courtesy www.stockcharts.com
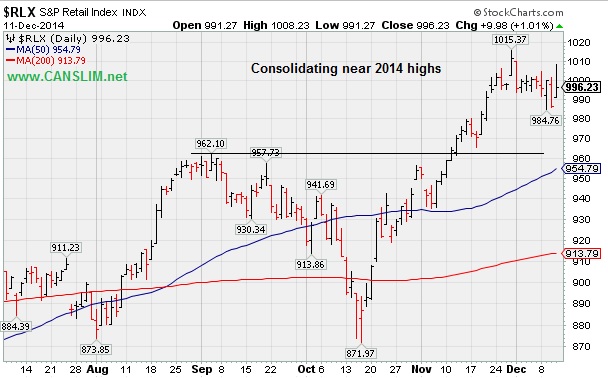
PICTURED: The Retail Index ($RLX +1.01%) is consolidating near its 2014 highs.
| Oil Services |
$OSX |
199.20 |
+0.43 |
+0.22% |
-29.12% |
| Integrated Oil |
$XOI |
1,266.05 |
-3.65 |
-0.29% |
-15.77% |
| Semiconductor |
$SOX |
683.15 |
+3.18 |
+0.47% |
+27.68% |
| Networking |
$NWX |
345.45 |
+3.86 |
+1.13% |
+6.64% |
| Broker/Dealer |
$XBD |
182.17 |
+0.64 |
+0.35% |
+13.46% |
| Retail |
$RLX |
996.23 |
+9.98 |
+1.01% |
+6.00% |
| Gold & Silver |
$XAU |
69.96 |
-1.04 |
-1.46% |
-16.86% |
| Bank |
$BKX |
73.14 |
+0.16 |
+0.22% |
+5.60% |
| Biotech |
$BTK |
3,466.47 |
+2.55 |
+0.07% |
+48.75% |
|
|
|
 |
Close in Lower Third of Intra-day Range Indicates Disributional Pressure
Kenneth J. Gruneisen - Passed the CAN SLIM® Master's Exam
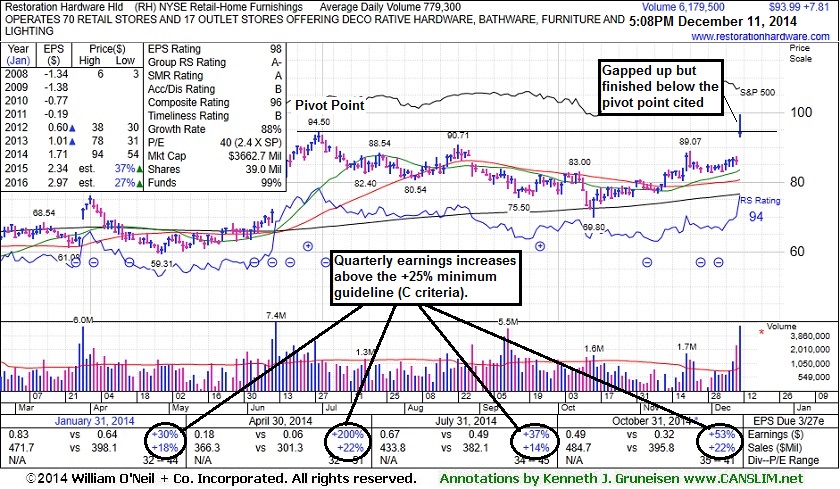
Restoration Hardware Hld (RH +$7.81 or +9.06% to $93.99) was highlighted in yellow with a pivot point cited based on its 6/30/14 high plus 10 cents in the earlier mid-day report (read here). It gapped up today and rallied to a new 52-week high and best-ever close with considerable volume +693% above average. However, it is worth noting that it closed in the lower third of its intra-day range and below the pivot point cited, a sign it was encountering distributional pressure near prior highs. Therefore, more convincing volume-driven gains in the days ahead are needed to help clinch a convincing technical buy signal.
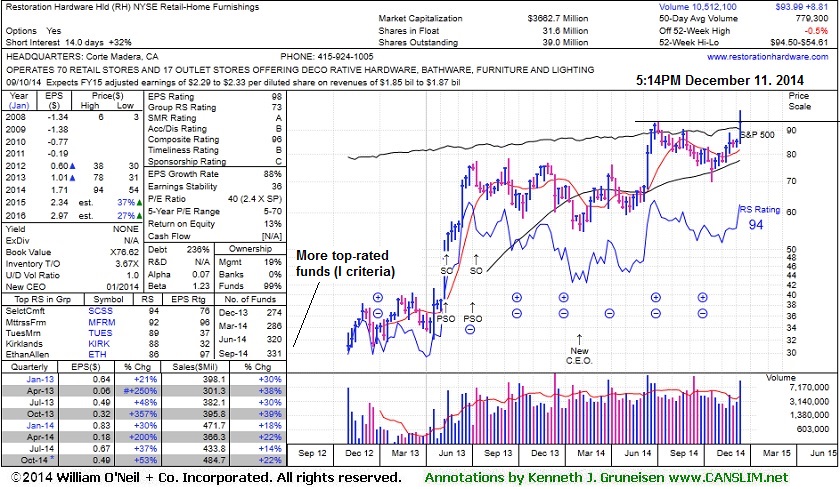
Volume and volatility often increase near earnings news. It reported that Oct '14 earnings rose +53% on +22% sales revenues versus the year ago period, continuing its streak of strong quarterly earnings above the +25% minimum guideline (C criteria). Its annual earnings (A criteria) growth has been very strong since reorganization and trading began on 11/02/12. It completed a Secondary Offering 7/12/13 and named a new CEO 1/31/14. The number of top-rated funds owning its shares rose from 274 in Dec '13 to 331 in Sep '14, a reassuring sign of increasing institutional interest (I criteria).
|
|
|
Color Codes Explained :
Y - Better candidates highlighted by our
staff of experts.
G - Previously featured
in past reports as yellow but may no longer be buyable under the
guidelines.
***Last / Change / Volume data in this table is the closing quote data***
Symbol/Exchange
Company Name
Industry Group |
PRICE |
CHANGE
(%Change) |
Day High |
Volume
(% DAV)
(% 50 day avg vol) |
52 Wk Hi
% From Hi |
Featured
Date |
Price
Featured |
Pivot Featured |
|
Max Buy |
ACT
-
NYSE
Actavis plc
Medical-Generic Drugs
|
$263.00
|
+4.19
1.62% |
$265.10
|
2,731,794
86.34% of 50 DAV
50 DAV is 3,164,000
|
$272.75
-3.57%
|
6/20/2014
|
$216.53
|
PP = $230.87
|
|
MB = $242.41
|
Most Recent Note - 12/8/2014 6:21:28 PM
G - Still consolidating after spiking to new 52-week highs with volume-driven gains following news it plans to acquire Allergan (AGN) for $66 Billion. Did not form a sound base, and it is extended from prior highs in the $249 area defining near-term support.
>>> FEATURED STOCK ARTICLE : Perched at Highs Following Spike on Acquisition Plans - 11/24/2014
View all notes |
Set NEW NOTE alert |
CANSLIM.net Company Profile |
SEC
News |
Chart |
Request a new note
C
A N
S L
I M


|
AFSI
-
NASDAQ
Amtrust Financial Svcs
INSURANCE - Property and; Casualty Insurance
|
$57.45
|
-0.32
-0.55% |
$58.59
|
876,946
81.50% of 50 DAV
50 DAV is 1,076,000
|
$57.78
-0.57%
|
10/17/2014
|
$45.24
|
PP = $46.02
|
|
MB = $48.32
|
Most Recent Note - 12/10/2014 6:50:39 PM
G - Hit a new 52-week high with a 4th consecutive gain, rising from a brief consolidation, not a sound base. Its 50 DMA line defines important near-term support. See the latest FSU analysis for more details and new annotated graphs.
>>> FEATURED STOCK ARTICLE : Extended From Sound Base Pattern Identified Earlier - 12/10/2014
View all notes |
Set NEW NOTE alert |
CANSLIM.net Company Profile |
SEC
News |
Chart |
Request a new note
C
A N
S L
I M
|
ALXN
-
NASDAQ
Alexion Pharmaceuticals
DRUGS - Drug Manufacturers - Other
|
$191.62
|
+0.18
0.09% |
$197.32
|
1,038,443
92.06% of 50 DAV
50 DAV is 1,128,000
|
$203.30
-5.75%
|
10/23/2014
|
$184.01
|
PP = $185.53
|
|
MB = $194.81
|
Most Recent Note - 12/10/2014 6:22:43 PM
G - Ended near the session low with a loss on above average volume, action indicative of distributional pressure. Recent lows near $185 define initial support to watch above its 50 DMA line.
>>> FEATURED STOCK ARTICLE : Quietly Consolidating Near All-Time High - 11/28/2014
View all notes |
Set NEW NOTE alert |
CANSLIM.net Company Profile |
SEC
News |
Chart |
Request a new note
C
A N
S L
I M
|
BIDU
-
NASDAQ
Baidu Inc Ads
INTERNET - Internet Information Providers
|
$229.23
|
+4.11
1.83% |
$233.74
|
3,032,108
82.02% of 50 DAV
50 DAV is 3,697,000
|
$251.99
-9.03%
|
10/30/2014
|
$234.08
|
PP = $231.51
|
|
MB = $243.09
|
Most Recent Note - 12/10/2014 6:25:25 PM
G - Quietly slumped below its 50 DMA line raising concerns and its color code is changed to green. Additional damaging losses would trigger more worrisome technical sell signals.
>>> FEATURED STOCK ARTICLE : Consolidating Near Prior Highs and Above 50-Day Average - 12/3/2014
View all notes |
Set NEW NOTE alert |
CANSLIM.net Company Profile |
SEC
News |
Chart |
Request a new note
C
A N
S L
I M
|
EPAM
-
NYSE
Epam Systems Inc
COMPUTER SOFTWARE and SERVICES - Information Technology Service
|
$51.23
|
+2.22
4.53% |
$52.89
|
408,159
95.81% of 50 DAV
50 DAV is 426,000
|
$52.73
-2.84%
|
10/23/2014
|
$45.21
|
PP = $46.09
|
|
MB = $48.39
|
 Most Recent Note - 12/11/2014 6:05:02 PM
G - Finished near the middle of its intra-day range after gapping up and touching a new 52-week high, and today's gain was backed by below average volume. Its 50 DMA line ($46.89) defines important near-term support to watch.
>>> FEATURED STOCK ARTICLE : Quiet Gain For New High Close - 11/26/2014
View all notes |
Set NEW NOTE alert |
CANSLIM.net Company Profile |
SEC
News |
Chart |
Request a new note
C
A N
S L
I M
|
Symbol/Exchange
Company Name
Industry Group |
PRICE |
CHANGE
(%Change) |
Day High |
Volume
(% DAV)
(% 50 day avg vol) |
52 Wk Hi
% From Hi |
Featured
Date |
Price
Featured |
Pivot Featured |
|
Max Buy |
FB
-
NASDAQ
Facebook Inc Cl A
INTERNET
|
$77.73
|
+1.55
2.03% |
$78.52
|
33,467,785
94.98% of 50 DAV
50 DAV is 35,238,000
|
$81.16
-4.23%
|
9/9/2014
|
$76.67
|
PP = $76.84
|
|
MB = $80.68
|
Most Recent Note - 12/10/2014 6:20:51 PM
Y - Reversed an early gain today and pulled back on higher (but below average) volume, ending near the session lows and 50 DMA line ($75.80). Prior lows in the $72 area define the next chart support level above its 200 DMA line.
>>> FEATURED STOCK ARTICLE : Gains Above 50-Day Moving Average Needed for Outlook to Improve - 12/4/2014
View all notes |
Set NEW NOTE alert |
CANSLIM.net Company Profile |
SEC
News |
Chart |
Request a new note
C
A N
S L
I M
|
FLT
-
NYSE
Fleetcor Technologies
DIVERSIFIED SERVICES - Business/Management Services
|
$142.98
|
-0.92
-0.64% |
$145.78
|
485,323
65.58% of 50 DAV
50 DAV is 740,000
|
$160.40
-10.86%
|
10/31/2014
|
$148.50
|
PP = $146.29
|
|
MB = $153.60
|
Most Recent Note - 12/8/2014 6:12:31 PM
Y - Recently enduring distributional pressure and testing support at prior highs in the $146-149 area along with its 50 DMA line. More damaging losses may trigger a worrisome technical sell signal. See the latest FSU analysis for more details and new annotated graphs.
>>> FEATURED STOCK ARTICLE : Testing Support While Encountering Recent Distributional Pressure - 12/8/2014
View all notes |
Set NEW NOTE alert |
CANSLIM.net Company Profile |
SEC
News |
Chart |
Request a new note
C
A N
S L
I M
|
ILMN
-
NASDAQ
Illumina Inc
DRUGS - Biotechnology
|
$186.83
|
+2.97
1.62% |
$188.19
|
819,609
66.63% of 50 DAV
50 DAV is 1,230,000
|
$197.37
-5.34%
|
10/22/2014
|
$188.77
|
PP = $182.27
|
|
MB = $191.38
|
Most Recent Note - 12/8/2014 6:24:07 PM
Y - Holding its ground while consolidating well above prior highs near $182 and above its 50 DMA line. Damaging losses below those levels would raise concerns and trigger technical sell signals.
>>> FEATURED STOCK ARTICLE : Quietly Consolidating Back Below "Max Buy" Level - 11/25/2014
View all notes |
Set NEW NOTE alert |
CANSLIM.net Company Profile |
SEC
News |
Chart |
Request a new note
C
A N
S L
I M
|
PANW
-
NYSE
Palo Alto Networks
Computer Sftwr-Security
|
$118.91
|
+1.77
1.51% |
$120.41
|
1,126,746
56.85% of 50 DAV
50 DAV is 1,982,000
|
$123.22
-3.50%
|
7/30/2014
|
$84.21
|
PP = $85.88
|
|
MB = $90.17
|
Most Recent Note - 12/8/2014 6:25:54 PM
G - Quietly consolidating near all-time highs. It did not form a sound base, and the 50 DMA line defines near-term support to watch. Reported earnings +88% on +50% sales revenues for the Oct '14 quarter.
>>> FEATURED STOCK ARTICLE : Under Accumulation But Extended From Sound Base - 12/1/2014
View all notes |
Set NEW NOTE alert |
CANSLIM.net Company Profile |
SEC
News |
Chart |
Request a new note
C
A N
S L
I M
|
RH
-
NYSE
Restoration Hardware Hld
RETAIL - Home Furnishing Stores
|
$93.99
|
+7.81
9.06% |
$99.44
|
6,180,719
793.42% of 50 DAV
50 DAV is 779,000
|
$94.50
-0.54%
|
12/11/2014
|
$98.66
|
PP = $94.60
|
|
MB = $99.33
|
Most Recent Note - 12/11/2014 5:59:40 PM
Y - Hit a new 52-week high but encountered distributional pressure after highlighted in yellow with pivot point cited based on its 6/30/14 high plus 10 cents in the earlier mid-day report (read here). Volume and volatility often increase near earnings news. It reported Oct '14 earnings rose +53% on +22% sales revenues versus the year ago period, continuing its streak of strong quarterly earnings above the +25% minimum guideline (C criteria). See the latest FSU analysis for more details and new annotated graphs.
>>> FEATURED STOCK ARTICLE : Close in Lower Third of Intra-day Range Indicates Disributional Pressure - 12/11/2014
View all notes |
Set NEW NOTE alert |
CANSLIM.net Company Profile |
SEC
News |
Chart |
Request a new note
C
A N
S L
I M
|
Symbol/Exchange
Company Name
Industry Group |
PRICE |
CHANGE
(%Change) |
Day High |
Volume
(% DAV)
(% 50 day avg vol) |
52 Wk Hi
% From Hi |
Featured
Date |
Price
Featured |
Pivot Featured |
|
Max Buy |
STRT
-
NASDAQ
Strattec Security Corp
AUTOMOTIVE - Auto Parts
|
$97.90
|
+0.26
0.27% |
$99.66
|
22,515
86.60% of 50 DAV
50 DAV is 26,000
|
$110.96
-11.77%
|
11/20/2014
|
$105.76
|
PP = $109.54
|
|
MB = $115.02
|
Most Recent Note - 12/10/2014 6:27:33 PM
Y - Endured more distributional pressure today slumping near its 50 DMA line ($95.41). Subsequent losses leading to a violation may trigger a technical sell signal. See the latest FSU analysis for more details and annotated graphs.
>>> FEATURED STOCK ARTICLE : Little Overhead Supply in Thinly Traded Company - 12/9/2014
View all notes |
Set NEW NOTE alert |
CANSLIM.net Company Profile |
SEC
News |
Chart |
Request a new note
C
A N
S L
I M
|
UIHC
-
NASDAQ
United Insurance Holding
Insurance-Prop/Cas/Titl
|
$19.99
|
+0.01
0.05% |
$20.40
|
235,760
99.90% of 50 DAV
50 DAV is 236,000
|
$22.32
-10.44%
|
12/5/2014
|
$20.64
|
PP = $20.31
|
|
MB = $21.33
|
Most Recent Note - 12/10/2014 1:29:26 PM
G - Gapped down today, abruptly retreating from its 52-week high following 6 consecutive gains marked by volume. Prior highs near $20 define initial support to watch on pullbacks.
>>> FEATURED STOCK ARTICLE : Technical Breakout Indicative of Institutional Demand - 12/5/2014
View all notes |
Set NEW NOTE alert |
CANSLIM.net Company Profile |
SEC
News |
Chart |
Request a new note
C
A N
S L
I M
|
|
|
|
THESE ARE NOT BUY RECOMMENDATIONS!
Comments contained in the body of this report are technical
opinions only. The material herein has been obtained
from sources believed to be reliable and accurate, however,
its accuracy and completeness cannot be guaranteed.
This site is not an investment advisor, hence it does
not endorse or recommend any securities or other investments.
Any recommendation contained in this report may not
be suitable for all investors and it is not to be deemed
an offer or solicitation on our part with respect to
the purchase or sale of any securities. All trademarks,
service marks and trade names appearing in this report
are the property of their respective owners, and are
likewise used for identification purposes only.
This report is a service available
only to active Paid Premium Members.
You may opt-out of receiving report notifications
at any time. Questions or comments may be submitted
by writing to Premium Membership Services 665 S.E. 10 Street, Suite 201 Deerfield Beach, FL 33441-5634 or by calling 1-800-965-8307
or 954-785-1121.
|
|
|

