You are not logged in.
This means you
CAN ONLY VIEW reports that were published prior to Monday, April 7, 2025.
You
MUST UPGRADE YOUR MEMBERSHIP if you want to see any current reports.
AFTER MARKET UPDATE - FRIDAY, DECEMBER 12TH, 2014
Previous After Market Report Next After Market Report >>>
|
|
|
|
DOW |
-315.51 |
17,280.83 |
-1.79% |
|
Volume |
940,268,110 |
+17% |
|
Volume |
1,766,474,220 |
+3% |
|
NASDAQ |
-54.56 |
4,653.60 |
-1.16% |
|
Advancers |
649 |
20% |
|
Advancers |
820 |
27% |
|
S&P 500 |
-33.00 |
2,002.33 |
-1.62% |
|
Decliners |
2,499 |
78% |
|
Decliners |
2,122 |
70% |
|
Russell 2000 |
-14.51 |
1,152.45 |
-1.24% |
|
52 Wk Highs |
55 |
|
|
52 Wk Highs |
55 |
|
|
S&P 600 |
-8.59 |
664.20 |
-1.28% |
|
52 Wk Lows |
365 |
|
|
52 Wk Lows |
179 |
|
|
 |
Major Averages Faced Greater Distributional Pressure
Kenneth J. Gruneisen - Passed the CAN SLIM® Master's Exam
With Friday's losses, the Dow ended the week down -3.8%. The S&P 500 dropped -3.5% and the NASDAQ Composite declined -2.7%. The volume was reported higher on the NYSE and on the Nasdaq exchange, a sign of distributional pressure from the institutional crowd. Breadth was negative as decliners led advancers by almost a 4-1 margin on the NYSE and 11-4 on the Nasdaq exchange. There were 15 high-ranked companies from the CANSLIM.net Leaders List that made new 52-week highs and appeared on the CANSLIM.net BreakOuts Page, down from the prior session total of 40 stocks. The new 52-week lows totals swelled again an outnumbered new 52-week highs on the NYSE and on the Nasdaq exchange. There were only 2 gainers among the 12 high-ranked companies currently on the Featured Stocks Page. Recent weakness was noted as the uptrend came under pressure, and Friday's action gave it the look of a more serious "correction". The market (M criteria) rally was noted in this daily Market Commentary since 10/21/14. Disciplined investors should be especially watchful for technical sell signals in individual issues until fresh strength appears in the broader market.
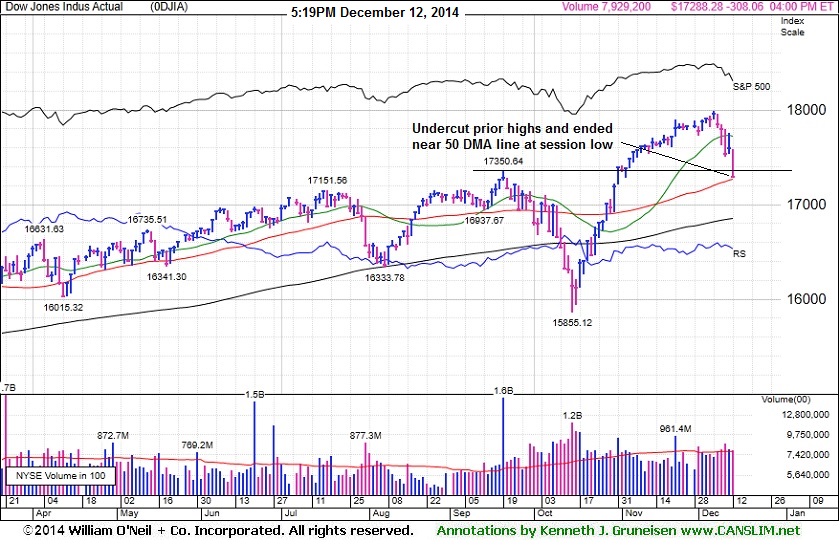
PICTURED: The Dow Jones Industrial Average retreated 315 points to 17,280, undercutting prior highs and finishing near the session low, testing support at its 50-day moving average (DMA) line.
Stocks fell sharply on Friday's session. The S&P 500 lost 33 points to close at 2,002. The NASDAQ slumped 55 points to finish at 4,653.
The major averages ended the week firmly in negative territory as oil extended its slide after the IEA cut its demand forecast for next year. Global growth concerns also provided a market headwind after China's industrial production data came in below projections. On the U.S. economic front, wholesale prices fell 0.2% in November due to a decline in energy cost. The University of Michigan's preliminary December confidence reading showed consumer sentiment improved more than anticipated.
Energy and materials paced the market’s decline today. Exxon (XOM -2.9%) as WTI crude fell to its lowest level since May 2009. Chemical maker Lyondell (LYB -6.2%). Retailers were a bright spot on the session with Walgreen's (WAG +2%) gaining. Adobe (ADBE +9.1%) was the best performing stock in the S&P 500, rallying following its positive earnings release Thursday night.
Treasuries advanced with the benchmark 10-year note gaining 22/32 to yield 2.08%. WTI crude dropped -3.9% to $57.63/barrel on the NYMEX. Gold slipped -0.3% to $1,222.00/ounce on the COMEX.
Disciplined investors know that new buying efforts may be made under the fact-based investment system only in stocks meeting all key criteria. The Featured Stocks Page shows the most action-worthy candidates and their latest notes and a Headline Link directs members to the latest detailed analysis with data-packed graphs annotated by a Certified expert along with links to additional resources. The Premium Member Homepage includes "dynamic archives" to all prior pay reports published.
|
 Kenneth J. Gruneisen started out as a licensed stockbroker in August 1987, a couple of months prior to the historic stock market crash that took the Dow Jones Industrial Average down -22.6% in a single day. He has published daily fact-based fundamental and technical analysis on high-ranked stocks online for two decades. Through FACTBASEDINVESTING.COM, Kenneth provides educational articles, news, market commentary, and other information regarding proven investment systems that work in good times and bad.
Comments contained in the body of this report are technical opinions only and are not necessarily those of Gruneisen Growth Corp. The material herein has been obtained from sources believed to be reliable and accurate, however, its accuracy and completeness cannot be guaranteed. Our firm, employees, and customers may effect transactions, including transactions contrary to any recommendation herein, or have positions in the securities mentioned herein or options with respect thereto. Any recommendation contained in this report may not be suitable for all investors and it is not to be deemed an offer or solicitation on our part with respect to the purchase or sale of any securities. |
|
 |
Financial, Tech, and Commodity-Linked Groups Fell
Kenneth J. Gruneisen - Passed the CAN SLIM® Master's Exam
Financial shares were weak as the Broker/Dealer Index ($XBD -2.61%) and Bank Index ($BKX -1.86%) both lost ground on Friday. Energy-related shares sank as the Oil Services Index ($OSX -1.98%) and the Integrated Oil Index ($XOI -1.92%) both fell. The Gold & Silver Index ($XAU -1.83%) also ended lower. The tech sector saw unanimous losses from the Semiconductor Index ($SOX -1.73%), Biotechnology Index ($BTK -1.32%), and the The Retail Index ($RLX -0.30%) held its ground better than most groups but also finished with a small loss on the widely negative session.
Charts courtesy www.stockcharts.com
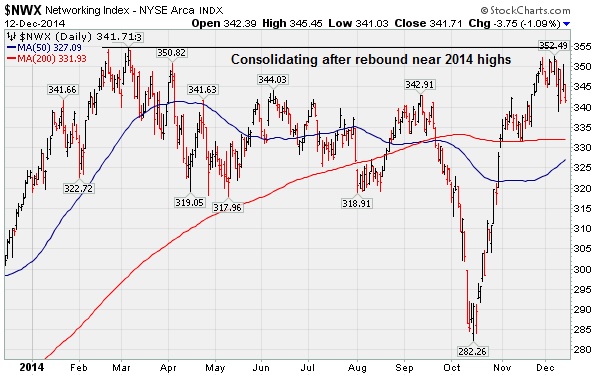
PICTURED: The Networking Index ($NWX -1.09%) is consolidating after rebounding near its 2014.
| Oil Services |
$OSX |
195.26 |
-3.94 |
-1.98% |
-30.52% |
| Integrated Oil |
$XOI |
1,241.74 |
-24.31 |
-1.92% |
-17.39% |
| Semiconductor |
$SOX |
671.33 |
-11.82 |
-1.73% |
+25.48% |
| Networking |
$NWX |
341.71 |
-3.75 |
-1.09% |
+5.48% |
| Broker/Dealer |
$XBD |
177.41 |
-4.76 |
-2.61% |
+10.49% |
| Retail |
$RLX |
993.23 |
-3.00 |
-0.30% |
+5.69% |
| Gold & Silver |
$XAU |
68.68 |
-1.28 |
-1.83% |
-18.38% |
| Bank |
$BKX |
71.78 |
-1.36 |
-1.86% |
+3.64% |
| Biotech |
$BTK |
3,420.65 |
-45.82 |
-1.32% |
+46.78% |
|
|
|
 |
Consolidating After Rally on Acquisition Plans
Kenneth J. Gruneisen - Passed the CAN SLIM® Master's Exam
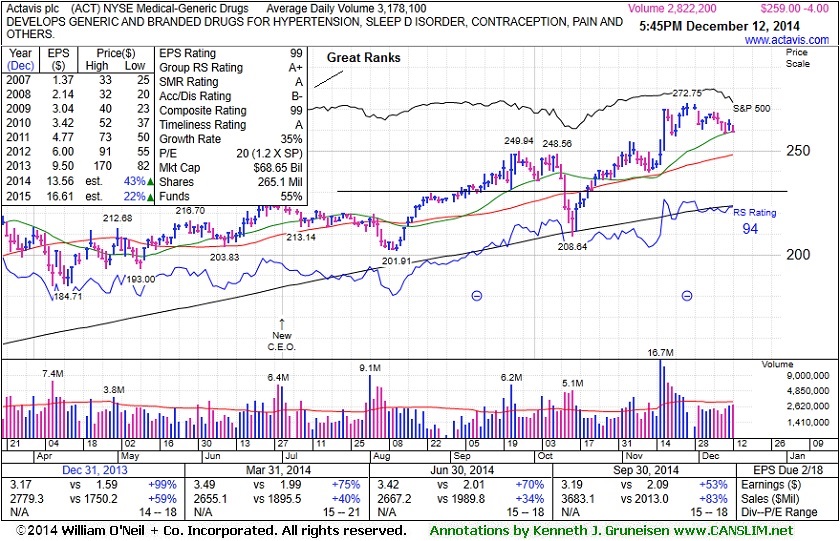
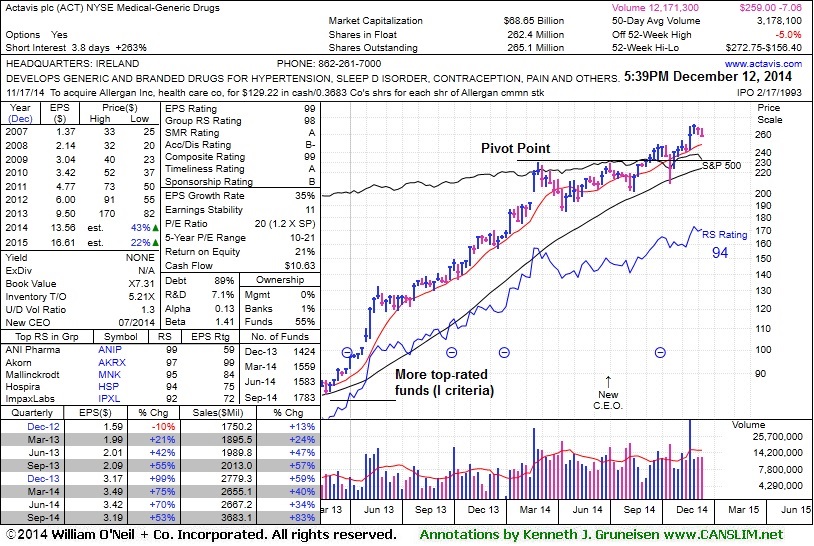
Actavis plc (ACT -$4.00 or -1.52% to $259.00) has been consolidating after spiking to new 52-week highs with volume-driven gains following news it plans to acquire Allergan (AGN) for $66 Billion. It did not form a sound base recently, and it is extended from prior highs in the $249 area defining near-term support. It was last shown in this FSU section on 11/24/14 with annotated graphs under the headline, "Perched at Highs Following Spike on Acquisition Plans".
ACT was first highlighted in yellow in the 6/20/14 mid-day report (read here) with a pivot point based on its 2/26/14 high plus 10 cents. The Medical - Generic Drugs industry group currently has a 98 Group Relative Strength Rating. Leadership from other issues in the group is also a reassuring sign concerning the L criteria. It reported earnings +53% on +83% sales revenues for the Sep '14 quarter, and its strong record satisfies the C criteria. Its annual earnings (A criteria) history has also been strong. The number of top-rated funds owning its shares has been on the rise, up from 1,219 in Sep '13 to 1,783 in Sep '14, a reassuring sign concerning the I criteria.
|
|
|
Color Codes Explained :
Y - Better candidates highlighted by our
staff of experts.
G - Previously featured
in past reports as yellow but may no longer be buyable under the
guidelines.
***Last / Change / Volume data in this table is the closing quote data***
Symbol/Exchange
Company Name
Industry Group |
PRICE |
CHANGE
(%Change) |
Day High |
Volume
(% DAV)
(% 50 day avg vol) |
52 Wk Hi
% From Hi |
Featured
Date |
Price
Featured |
Pivot Featured |
|
Max Buy |
ACT
-
NYSE
Actavis plc
Medical-Generic Drugs
|
$259.00
|
-4.00
-1.52% |
$262.39
|
2,822,284
88.81% of 50 DAV
50 DAV is 3,178,000
|
$272.75
-5.04%
|
6/20/2014
|
$216.53
|
PP = $230.87
|
|
MB = $242.41
|
 Most Recent Note - 12/12/2014 6:10:43 PM
G - Consolidating near its 52-week high following volume-driven gains on news it plans to acquire Allergan (AGN) for $66 Billion. Extended from prior highs in the $249 area defining near-term support. See the latest FSU analysis for more details and new annotated graphs.
>>> FEATURED STOCK ARTICLE : Consolidating After Rally on Acquisition Plans - 12/12/2014
View all notes |
Set NEW NOTE alert |
CANSLIM.net Company Profile |
SEC
News |
Chart |
Request a new note
C
A N
S L
I M


|
AFSI
-
NASDAQ
Amtrust Financial Svcs
INSURANCE - Property and; Casualty Insurance
|
$56.87
|
-0.58
-1.01% |
$57.84
|
657,545
61.28% of 50 DAV
50 DAV is 1,073,000
|
$58.59
-2.93%
|
10/17/2014
|
$45.24
|
PP = $46.02
|
|
MB = $48.32
|
Most Recent Note - 12/10/2014 6:50:39 PM
G - Hit a new 52-week high with a 4th consecutive gain, rising from a brief consolidation, not a sound base. Its 50 DMA line defines important near-term support. See the latest FSU analysis for more details and new annotated graphs.
>>> FEATURED STOCK ARTICLE : Extended From Sound Base Pattern Identified Earlier - 12/10/2014
View all notes |
Set NEW NOTE alert |
CANSLIM.net Company Profile |
SEC
News |
Chart |
Request a new note
C
A N
S L
I M
|
ALXN
-
NASDAQ
Alexion Pharmaceuticals
DRUGS - Drug Manufacturers - Other
|
$186.90
|
-4.72
-2.46% |
$191.96
|
1,041,028
92.62% of 50 DAV
50 DAV is 1,124,000
|
$203.30
-8.07%
|
10/23/2014
|
$184.01
|
PP = $185.53
|
|
MB = $194.81
|
Most Recent Note - 12/12/2014 6:17:05 PM
G - Ended near the session low testing its 50 DMA with a loss today on average volume. Recent lows near $185 help define support to watch, and a violation of its 50 DMA line would raise concerns and trigger a technical sell signal.
>>> FEATURED STOCK ARTICLE : Quietly Consolidating Near All-Time High - 11/28/2014
View all notes |
Set NEW NOTE alert |
CANSLIM.net Company Profile |
SEC
News |
Chart |
Request a new note
C
A N
S L
I M
|
BIDU
-
NASDAQ
Baidu Inc Ads
INTERNET - Internet Information Providers
|
$229.32
|
+0.09
0.04% |
$233.69
|
2,550,015
69.28% of 50 DAV
50 DAV is 3,681,000
|
$251.99
-9.00%
|
10/30/2014
|
$234.08
|
PP = $231.51
|
|
MB = $243.09
|
Most Recent Note - 12/10/2014 6:25:25 PM
G - Quietly slumped below its 50 DMA line raising concerns and its color code is changed to green. Additional damaging losses would trigger more worrisome technical sell signals.
>>> FEATURED STOCK ARTICLE : Consolidating Near Prior Highs and Above 50-Day Average - 12/3/2014
View all notes |
Set NEW NOTE alert |
CANSLIM.net Company Profile |
SEC
News |
Chart |
Request a new note
C
A N
S L
I M
|
EPAM
-
NYSE
Epam Systems Inc
COMPUTER SOFTWARE and SERVICES - Information Technology Service
|
$50.90
|
-0.33
-0.64% |
$51.60
|
246,880
57.95% of 50 DAV
50 DAV is 426,000
|
$52.89
-3.76%
|
10/23/2014
|
$45.21
|
PP = $46.09
|
|
MB = $48.39
|
Most Recent Note - 12/11/2014 6:05:02 PM
G - Finished near the middle of its intra-day range after gapping up and touching a new 52-week high, and today's gain was backed by below average volume. Its 50 DMA line ($46.89) defines important near-term support to watch.
>>> FEATURED STOCK ARTICLE : Quiet Gain For New High Close - 11/26/2014
View all notes |
Set NEW NOTE alert |
CANSLIM.net Company Profile |
SEC
News |
Chart |
Request a new note
C
A N
S L
I M
|
Symbol/Exchange
Company Name
Industry Group |
PRICE |
CHANGE
(%Change) |
Day High |
Volume
(% DAV)
(% 50 day avg vol) |
52 Wk Hi
% From Hi |
Featured
Date |
Price
Featured |
Pivot Featured |
|
Max Buy |
FB
-
NASDAQ
Facebook Inc Cl A
INTERNET
|
$77.83
|
+0.10
0.13% |
$78.88
|
28,056,851
80.61% of 50 DAV
50 DAV is 34,806,000
|
$81.16
-4.10%
|
9/9/2014
|
$76.67
|
PP = $76.84
|
|
MB = $80.68
|
Most Recent Note - 12/10/2014 6:20:51 PM
Y - Reversed an early gain today and pulled back on higher (but below average) volume, ending near the session lows and 50 DMA line ($75.80). Prior lows in the $72 area define the next chart support level above its 200 DMA line.
>>> FEATURED STOCK ARTICLE : Gains Above 50-Day Moving Average Needed for Outlook to Improve - 12/4/2014
View all notes |
Set NEW NOTE alert |
CANSLIM.net Company Profile |
SEC
News |
Chart |
Request a new note
C
A N
S L
I M
|
FLT
-
NYSE
Fleetcor Technologies
DIVERSIFIED SERVICES - Business/Management Services
|
$138.33
|
-4.65
-3.25% |
$141.55
|
1,260,406
171.72% of 50 DAV
50 DAV is 734,000
|
$160.40
-13.76%
|
10/31/2014
|
$148.50
|
PP = $146.29
|
|
MB = $153.60
|
Most Recent Note - 12/12/2014 6:05:10 PM
G - Violated its 50 DMA line with a damaging volume-driven loss today triggering a worrisome technical sell signal. Only a prompt rebound above the 50 DMA line would help its outlook improve.
>>> FEATURED STOCK ARTICLE : Testing Support While Encountering Recent Distributional Pressure - 12/8/2014
View all notes |
Set NEW NOTE alert |
CANSLIM.net Company Profile |
SEC
News |
Chart |
Request a new note
C
A N
S L
I M
|
ILMN
-
NASDAQ
Illumina Inc
DRUGS - Biotechnology
|
$184.30
|
-2.53
-1.35% |
$187.27
|
660,751
54.12% of 50 DAV
50 DAV is 1,221,000
|
$197.37
-6.62%
|
10/22/2014
|
$188.77
|
PP = $182.27
|
|
MB = $191.38
|
Most Recent Note - 12/12/2014 6:07:30 PM
G - Slumped below its 50 DMA line with a loss on light volume raising concerns and its color code is changed to green. More damaging losses would raise greater concerns and trigger a more worrisome technical sell signal.
>>> FEATURED STOCK ARTICLE : Quietly Consolidating Back Below "Max Buy" Level - 11/25/2014
View all notes |
Set NEW NOTE alert |
CANSLIM.net Company Profile |
SEC
News |
Chart |
Request a new note
C
A N
S L
I M
|
PANW
-
NYSE
Palo Alto Networks
Computer Sftwr-Security
|
$118.07
|
-0.84
-0.71% |
$119.75
|
795,805
40.73% of 50 DAV
50 DAV is 1,954,000
|
$123.22
-4.18%
|
7/30/2014
|
$84.21
|
PP = $85.88
|
|
MB = $90.17
|
Most Recent Note - 12/8/2014 6:25:54 PM
G - Quietly consolidating near all-time highs. It did not form a sound base, and the 50 DMA line defines near-term support to watch. Reported earnings +88% on +50% sales revenues for the Oct '14 quarter.
>>> FEATURED STOCK ARTICLE : Under Accumulation But Extended From Sound Base - 12/1/2014
View all notes |
Set NEW NOTE alert |
CANSLIM.net Company Profile |
SEC
News |
Chart |
Request a new note
C
A N
S L
I M
|
RH
-
NYSE
Restoration Hardware Hld
RETAIL - Home Furnishing Stores
|
$93.59
|
-0.40
-0.43% |
$98.39
|
2,604,277
296.95% of 50 DAV
50 DAV is 877,000
|
$99.44
-5.88%
|
12/11/2014
|
$98.66
|
PP = $94.60
|
|
MB = $99.33
|
Most Recent Note - 12/12/2014 12:41:18 PM
Y - Up today with above average volume. On the prior session it hit a new 52-week high but encountered distributional pressure after highlighted in yellow with pivot point cited based on its 6/30/14 high plus 10 cents in the mid-day report (read here). Volume and volatility often increase near earnings news. It reported Oct '14 earnings rose +53% on +22% sales revenues versus the year ago period, continuing its streak of strong quarterly earnings above the +25% minimum guideline (C criteria). See the latest FSU analysis for more details and annotated graphs.
>>> FEATURED STOCK ARTICLE : Close in Lower Third of Intra-day Range Indicates Disributional Pressure - 12/11/2014
View all notes |
Set NEW NOTE alert |
CANSLIM.net Company Profile |
SEC
News |
Chart |
Request a new note
C
A N
S L
I M
|
Symbol/Exchange
Company Name
Industry Group |
PRICE |
CHANGE
(%Change) |
Day High |
Volume
(% DAV)
(% 50 day avg vol) |
52 Wk Hi
% From Hi |
Featured
Date |
Price
Featured |
Pivot Featured |
|
Max Buy |
STRT
-
NASDAQ
Strattec Security Corp
AUTOMOTIVE - Auto Parts
|
$94.72
|
-3.18
-3.25% |
$97.65
|
19,110
73.50% of 50 DAV
50 DAV is 26,000
|
$110.96
-14.64%
|
11/20/2014
|
$105.76
|
PP = $109.54
|
|
MB = $115.02
|
Most Recent Note - 12/12/2014 6:13:50 PM
G - Slumped on light volume to a close below its 50 DMA line triggering a technical sell signal and its color code is changed to green. Only a prompt rebound above its 50 DMA line would help its outlook improve.
>>> FEATURED STOCK ARTICLE : Little Overhead Supply in Thinly Traded Company - 12/9/2014
View all notes |
Set NEW NOTE alert |
CANSLIM.net Company Profile |
SEC
News |
Chart |
Request a new note
C
A N
S L
I M
|
UIHC
-
NASDAQ
United Insurance Holding
Insurance-Prop/Cas/Titl
|
$19.96
|
-0.03
-0.15% |
$20.45
|
144,490
61.22% of 50 DAV
50 DAV is 236,000
|
$22.32
-10.57%
|
12/5/2014
|
$20.64
|
PP = $20.31
|
|
MB = $21.33
|
Most Recent Note - 12/10/2014 1:29:26 PM
G - Gapped down today, abruptly retreating from its 52-week high following 6 consecutive gains marked by volume. Prior highs near $20 define initial support to watch on pullbacks.
>>> FEATURED STOCK ARTICLE : Technical Breakout Indicative of Institutional Demand - 12/5/2014
View all notes |
Set NEW NOTE alert |
CANSLIM.net Company Profile |
SEC
News |
Chart |
Request a new note
C
A N
S L
I M
|
|
|
|
THESE ARE NOT BUY RECOMMENDATIONS!
Comments contained in the body of this report are technical
opinions only. The material herein has been obtained
from sources believed to be reliable and accurate, however,
its accuracy and completeness cannot be guaranteed.
This site is not an investment advisor, hence it does
not endorse or recommend any securities or other investments.
Any recommendation contained in this report may not
be suitable for all investors and it is not to be deemed
an offer or solicitation on our part with respect to
the purchase or sale of any securities. All trademarks,
service marks and trade names appearing in this report
are the property of their respective owners, and are
likewise used for identification purposes only.
This report is a service available
only to active Paid Premium Members.
You may opt-out of receiving report notifications
at any time. Questions or comments may be submitted
by writing to Premium Membership Services 665 S.E. 10 Street, Suite 201 Deerfield Beach, FL 33441-5634 or by calling 1-800-965-8307
or 954-785-1121.
|
|
|

