You are not logged in.
This means you
CAN ONLY VIEW reports that were published prior to Tuesday, April 8, 2025.
You
MUST UPGRADE YOUR MEMBERSHIP if you want to see any current reports.
AFTER MARKET UPDATE - WEDNESDAY, DECEMBER 10TH, 2014
Previous After Market Report Next After Market Report >>>
|
|
|
|
DOW |
-268.05 |
17,533.15 |
-1.51% |
|
Volume |
893,771,630 |
+10% |
|
Volume |
1,709,112,200 |
-4% |
|
NASDAQ |
-82.44 |
4,684.03 |
-1.73% |
|
Advancers |
560 |
18% |
|
Advancers |
483 |
16% |
|
S&P 500 |
-33.68 |
2,026.14 |
-1.64% |
|
Decliners |
2,584 |
81% |
|
Decliners |
2,430 |
81% |
|
Russell 2000 |
-26.19 |
1,161.86 |
-2.20% |
|
52 Wk Highs |
107 |
|
|
52 Wk Highs |
88 |
|
|
S&P 600 |
-15.61 |
670.48 |
-2.28% |
|
52 Wk Lows |
262 |
|
|
52 Wk Lows |
118 |
|
|
 |
Breadth Clearly Negative as Indices Face Distributional Pressure
Kenneth J. Gruneisen - Passed the CAN SLIM® Master's Exam
Stocks finished sharply lower on Wednesday. The Dow Jones Industrial Average dropped 268 points to 17,533. The S&P 500 Index lost 34 points to close at 2,026. The NASDAQ Composite Index fell 82 points to 4,684. The volume totals were reported higher on the NYSE and lighter on the Nasdaq exchange. Breadth was negative as decliners led advancers by nearly a 5-1 margin on the NYSE and on the Nasdaq exchange. There were 44 high-ranked companies from the CANSLIM.net Leaders List that made new 52-week highs and appeared on the CANSLIM.net BreakOuts Page, down from the prior session total of 49 stocks. New 52-week lows outnumbered new 52-week highs on the NYSE and on the Nasdaq exchange. There was only 1 gainer among the 11 high-ranked companies currently on the Featured Stocks Page. Recent weakness has put the uptrend under pressure. The market (M criteria) rally was noted in this daily Market Commentary since 10/21/14. Disciplined investors should be especially watchful for technical sell signals in individual issues until fresh strength appears in the broader market.
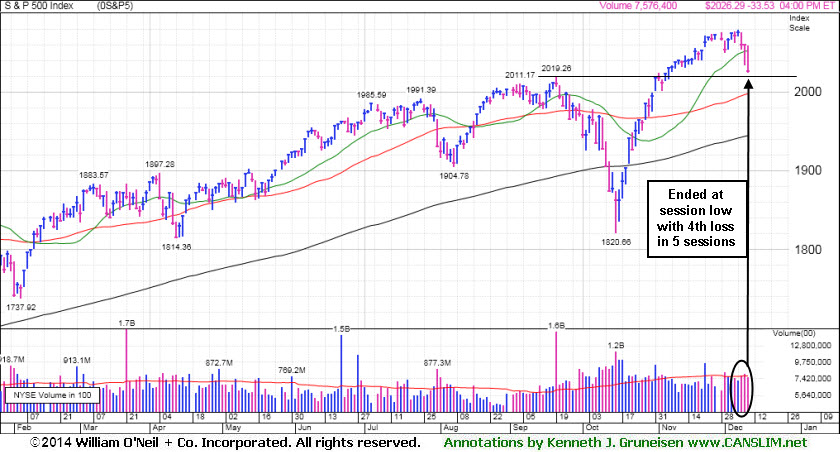
PICTURED: The S&P 500 Index ended near the session low, with its 4th loss in the span of 5 sessions. That leaves the benchmark index just above its September highs which may act as a support level.
The major averages declined amid further weakness in the energy sector after OPEC cut its 2015 demand forecast and a report showed weekly U.S. inventories rose. An index of companies in the S&P 500 slid 3% prompted by a 3.8% slump in NYMEX WTI crude oil to $61.37/barrel. Exxon (XOM -2.97%) and Oneok (OKE -7.79%). Airline stocks advanced, benefiting crude oil’s retreat and a report forecasting record industry profits next year. Shares of Southwest (LUV +1.84%) and American Airlines (AAL +1.3%) rose.
A new economic release showed the U.S. budget deficit declined to $56.8 billion in November from $135.2 billion a year ago. On the earnings front, Broadcom (BRCM +0.07%) held its ground as profits topped consensus estimates. Costco (COST -1.95%) fell despite quarterly results exceeding analyst projections. YUM! Brands (YUM -6.24%) fell after the owner of Taco Bell cut its full-year guidance.
Treasuries advanced attributed to investors seeking perceived safety in U.S. government debt. The 10-year note rose 13/32 to yield 2.16% amid strong demand for the latest $21 billion auction of the benchmark security. In commodities, COMEX gold futures declined 0.2% to $1228.90/ounce.
Disciplined investors know that new buying efforts may be made under the fact-based investment system only in stocks meeting all key criteria. The Featured Stocks Page shows the most action-worthy candidates and their latest notes and a Headline Link directs members to the latest detailed analysis with data-packed graphs annotated by a Certified expert along with links to additional resources. The Premium Member Homepage includes "dynamic archives" to all prior pay reports published.
|
 Kenneth J. Gruneisen started out as a licensed stockbroker in August 1987, a couple of months prior to the historic stock market crash that took the Dow Jones Industrial Average down -22.6% in a single day. He has published daily fact-based fundamental and technical analysis on high-ranked stocks online for two decades. Through FACTBASEDINVESTING.COM, Kenneth provides educational articles, news, market commentary, and other information regarding proven investment systems that work in good times and bad.
Comments contained in the body of this report are technical opinions only and are not necessarily those of Gruneisen Growth Corp. The material herein has been obtained from sources believed to be reliable and accurate, however, its accuracy and completeness cannot be guaranteed. Our firm, employees, and customers may effect transactions, including transactions contrary to any recommendation herein, or have positions in the securities mentioned herein or options with respect thereto. Any recommendation contained in this report may not be suitable for all investors and it is not to be deemed an offer or solicitation on our part with respect to the purchase or sale of any securities. |
|
 |
Tech, Financial, Retail, and Commodity-Linked Groups Fell
Kenneth J. Gruneisen - Passed the CAN SLIM® Master's Exam
The Retail Index ($RLX -1.34%) and financial groups fell as the Bank Index ($BKX -2.09%) and the Broker/Dealer Index ($XBD -1.91%) both lost ground. The Gold & Silver Index ($XAU -3.15%) and energy-related shares declined as the Oil Services Index ($OSX -3.59%) and Integrated Oil Index ($XOI -3.30%) also suffered large losses Wednesday. The tech sector saw unanimous losses for the Networking Index ($NWX -2.17%), Biotechnology Index ($BTK -2.09%), and the Semiconductor Index ($SOX -1.86%) on the widely negative session.
Charts courtesy www.stockcharts.com
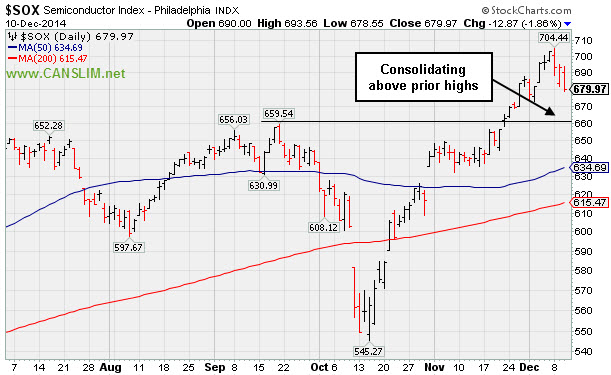
PICTURED: The Semiconductor Index ($SOX -1.86%) is consolidating above prior highs. From its October low to the recent high the chip index rallied +29%.
| Oil Services |
$OSX |
198.77 |
-7.40 |
-3.59% |
-29.27% |
| Integrated Oil |
$XOI |
1,269.70 |
-43.28 |
-3.30% |
-15.53% |
| Semiconductor |
$SOX |
679.97 |
-12.87 |
-1.86% |
+27.09% |
| Networking |
$NWX |
341.59 |
-7.56 |
-2.17% |
+5.45% |
| Broker/Dealer |
$XBD |
181.53 |
-3.54 |
-1.91% |
+13.06% |
| Retail |
$RLX |
986.25 |
-13.40 |
-1.34% |
+4.94% |
| Gold & Silver |
$XAU |
71.00 |
-2.31 |
-3.15% |
-15.63% |
| Bank |
$BKX |
72.98 |
-1.56 |
-2.09% |
+5.37% |
| Biotech |
$BTK |
3,463.93 |
-74.09 |
-2.09% |
+48.64% |
|
|
|
 |
Extended From Sound Base Pattern Identified Earlier
Kenneth J. Gruneisen - Passed the CAN SLIM® Master's Exam
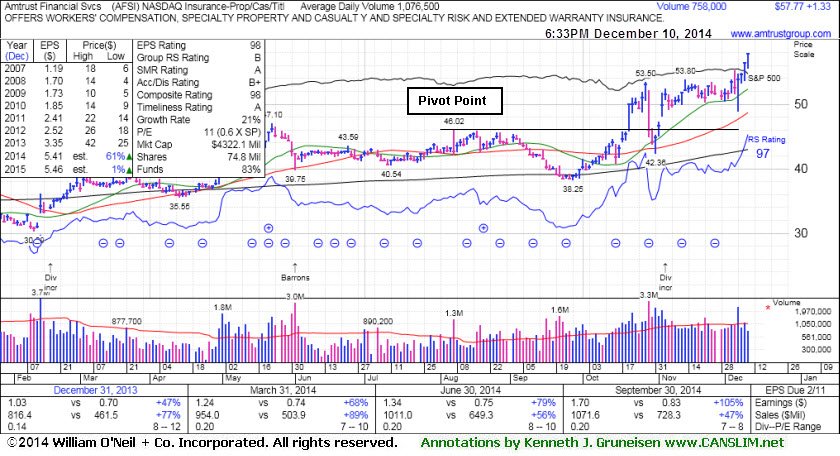
Amtrust Financial Services' (AFSI +$1.33 or +2.36% to $57.77) posted a 4th consecutive gain today on lighter volume, hitting a new 52-week high. It faces no resistance due to overhead supply. The brief consolidation in recent weeks was not noted as a sound base pattern. Its 50-day moving average (DMA) line ($48.70) defines important near-term support to watch on pullbacks.
The high-ranked Insurance - Property/Casualty/Title firm was last shown in this FSU section on 11/21/14 with annotated graphs under the headline, "No Sound Base Formed, Yet Little Resistance Remains". It found prompt support at its 50-day moving average (DMA) line when abruptly retreating after an analyst downgraded the stock in late-October. AFSI was highlighted in yellow with new pivot point cited based on its 8/07/14 high in the 10/17/14 mid-day report (read here) and subsequent volume-driven gains above the pivot point triggered a technical buy signal.
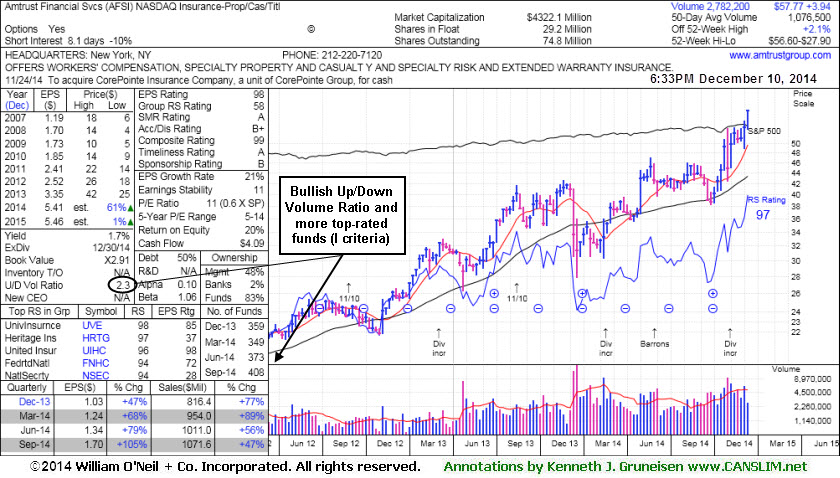
The number of top-rated funds owning an interest rose from 349 in Mar '14 to 408 in Sep '14, a reassuring sign concerning the I criteria. It reported earnings +105% on +47% sales revenues for the quarter ended Sep '14 quarter versus the year ago period, its 9th consecutive comparison above the +25% minimum earnings guideline (C criteria). It has a great annual earnings (A criteria) history and it has earned an impressive 98 Earnings Per Share rating, well above the 80+ minimum rating for buy candidates. Its Relative Strength Rating is currently 97, above the 80+ minimum guideline for buy candidates.
|
|
|
Color Codes Explained :
Y - Better candidates highlighted by our
staff of experts.
G - Previously featured
in past reports as yellow but may no longer be buyable under the
guidelines.
***Last / Change / Volume data in this table is the closing quote data***
Symbol/Exchange
Company Name
Industry Group |
PRICE |
CHANGE
(%Change) |
Day High |
Volume
(% DAV)
(% 50 day avg vol) |
52 Wk Hi
% From Hi |
Featured
Date |
Price
Featured |
Pivot Featured |
|
Max Buy |
ACT
-
NYSE
Actavis plc
Medical-Generic Drugs
|
$258.81
|
-4.92
-1.87% |
$263.73
|
2,411,958
76.72% of 50 DAV
50 DAV is 3,144,000
|
$272.75
-5.11%
|
6/20/2014
|
$216.53
|
PP = $230.87
|
|
MB = $242.41
|
Most Recent Note - 12/8/2014 6:21:28 PM
G - Still consolidating after spiking to new 52-week highs with volume-driven gains following news it plans to acquire Allergan (AGN) for $66 Billion. Did not form a sound base, and it is extended from prior highs in the $249 area defining near-term support.
>>> FEATURED STOCK ARTICLE : Perched at Highs Following Spike on Acquisition Plans - 11/24/2014
View all notes |
Set NEW NOTE alert |
CANSLIM.net Company Profile |
SEC
News |
Chart |
Request a new note
C
A N
S L
I M


|
AFSI
-
NASDAQ
Amtrust Financial Svcs
INSURANCE - Property and; Casualty Insurance
|
$57.77
|
+1.33
2.36% |
$57.78
|
758,031
70.78% of 50 DAV
50 DAV is 1,071,000
|
$56.60
2.07%
|
10/17/2014
|
$45.24
|
PP = $46.02
|
|
MB = $48.32
|
 Most Recent Note - 12/10/2014 6:50:39 PM
G - Hit a new 52-week high with a 4th consecutive gain, rising from a brief consolidation, not a sound base. Its 50 DMA line defines important near-term support. See the latest FSU analysis for more details and new annotated graphs.
>>> FEATURED STOCK ARTICLE : Extended From Sound Base Pattern Identified Earlier - 12/10/2014
View all notes |
Set NEW NOTE alert |
CANSLIM.net Company Profile |
SEC
News |
Chart |
Request a new note
C
A N
S L
I M
|
ALXN
-
NASDAQ
Alexion Pharmaceuticals
DRUGS - Drug Manufacturers - Other
|
$191.44
|
-8.34
-4.17% |
$198.71
|
1,480,708
131.97% of 50 DAV
50 DAV is 1,122,000
|
$203.30
-5.83%
|
10/23/2014
|
$184.01
|
PP = $185.53
|
|
MB = $194.81
|
Most Recent Note - 12/10/2014 6:22:43 PM
G - Ended near the session low with a loss on above average volume, action indicative of distributional pressure. Recent lows near $185 define initial support to watch above its 50 DMA line.
>>> FEATURED STOCK ARTICLE : Quietly Consolidating Near All-Time High - 11/28/2014
View all notes |
Set NEW NOTE alert |
CANSLIM.net Company Profile |
SEC
News |
Chart |
Request a new note
C
A N
S L
I M
|
BIDU
-
NASDAQ
Baidu Inc Ads
INTERNET - Internet Information Providers
|
$225.12
|
-4.78
-2.08% |
$229.82
|
2,245,799
60.40% of 50 DAV
50 DAV is 3,718,000
|
$251.99
-10.66%
|
10/30/2014
|
$234.08
|
PP = $231.51
|
|
MB = $243.09
|
Most Recent Note - 12/10/2014 6:25:25 PM
G - Quietly slumped below its 50 DMA line raising concerns and its color code is changed to green. Additional damaging losses would trigger more worrisome technical sell signals.
>>> FEATURED STOCK ARTICLE : Consolidating Near Prior Highs and Above 50-Day Average - 12/3/2014
View all notes |
Set NEW NOTE alert |
CANSLIM.net Company Profile |
SEC
News |
Chart |
Request a new note
C
A N
S L
I M
|
EPAM
-
NYSE
Epam Systems Inc
COMPUTER SOFTWARE and SERVICES - Information Technology Service
|
$49.01
|
-2.94
-5.66% |
$51.65
|
357,942
83.63% of 50 DAV
50 DAV is 428,000
|
$52.73
-7.05%
|
10/23/2014
|
$45.21
|
PP = $46.09
|
|
MB = $48.39
|
Most Recent Note - 12/10/2014 6:15:50 PM
G - Retreated from its 52-week high with today's loss on higher (but below average) volume. Its 50 DMA line ($46.73) defines important near-term support to watch.
>>> FEATURED STOCK ARTICLE : Quiet Gain For New High Close - 11/26/2014
View all notes |
Set NEW NOTE alert |
CANSLIM.net Company Profile |
SEC
News |
Chart |
Request a new note
C
A N
S L
I M
|
Symbol/Exchange
Company Name
Industry Group |
PRICE |
CHANGE
(%Change) |
Day High |
Volume
(% DAV)
(% 50 day avg vol) |
52 Wk Hi
% From Hi |
Featured
Date |
Price
Featured |
Pivot Featured |
|
Max Buy |
FB
-
NASDAQ
Facebook Inc Cl A
INTERNET
|
$76.18
|
-0.66
-0.86% |
$77.55
|
32,182,483
90.69% of 50 DAV
50 DAV is 35,485,000
|
$81.16
-6.14%
|
9/9/2014
|
$76.67
|
PP = $76.84
|
|
MB = $80.68
|
Most Recent Note - 12/10/2014 6:20:51 PM
Y - Reversed an early gain today and pulled back on higher (but below average) volume, ending near the session lows and 50 DMA line ($75.80). Prior lows in the $72 area define the next chart support level above its 200 DMA line.
>>> FEATURED STOCK ARTICLE : Gains Above 50-Day Moving Average Needed for Outlook to Improve - 12/4/2014
View all notes |
Set NEW NOTE alert |
CANSLIM.net Company Profile |
SEC
News |
Chart |
Request a new note
C
A N
S L
I M
|
FLT
-
NYSE
Fleetcor Technologies
DIVERSIFIED SERVICES - Business/Management Services
|
$143.90
|
-4.80
-3.23% |
$148.29
|
594,011
78.99% of 50 DAV
50 DAV is 752,000
|
$160.40
-10.29%
|
10/31/2014
|
$148.50
|
PP = $146.29
|
|
MB = $153.60
|
Most Recent Note - 12/8/2014 6:12:31 PM
Y - Recently enduring distributional pressure and testing support at prior highs in the $146-149 area along with its 50 DMA line. More damaging losses may trigger a worrisome technical sell signal. See the latest FSU analysis for more details and new annotated graphs.
>>> FEATURED STOCK ARTICLE : Testing Support While Encountering Recent Distributional Pressure - 12/8/2014
View all notes |
Set NEW NOTE alert |
CANSLIM.net Company Profile |
SEC
News |
Chart |
Request a new note
C
A N
S L
I M
|
ILMN
-
NASDAQ
Illumina Inc
DRUGS - Biotechnology
|
$183.86
|
-3.45
-1.84% |
$188.87
|
947,626
77.29% of 50 DAV
50 DAV is 1,226,000
|
$197.37
-6.85%
|
10/22/2014
|
$188.77
|
PP = $182.27
|
|
MB = $191.38
|
Most Recent Note - 12/8/2014 6:24:07 PM
Y - Holding its ground while consolidating well above prior highs near $182 and above its 50 DMA line. Damaging losses below those levels would raise concerns and trigger technical sell signals.
>>> FEATURED STOCK ARTICLE : Quietly Consolidating Back Below "Max Buy" Level - 11/25/2014
View all notes |
Set NEW NOTE alert |
CANSLIM.net Company Profile |
SEC
News |
Chart |
Request a new note
C
A N
S L
I M
|
PANW
-
NYSE
Palo Alto Networks
Computer Sftwr-Security
|
$117.14
|
-1.70
-1.43% |
$119.50
|
1,155,183
57.93% of 50 DAV
50 DAV is 1,994,000
|
$123.22
-4.93%
|
7/30/2014
|
$84.21
|
PP = $85.88
|
|
MB = $90.17
|
Most Recent Note - 12/8/2014 6:25:54 PM
G - Quietly consolidating near all-time highs. It did not form a sound base, and the 50 DMA line defines near-term support to watch. Reported earnings +88% on +50% sales revenues for the Oct '14 quarter.
>>> FEATURED STOCK ARTICLE : Under Accumulation But Extended From Sound Base - 12/1/2014
View all notes |
Set NEW NOTE alert |
CANSLIM.net Company Profile |
SEC
News |
Chart |
Request a new note
C
A N
S L
I M
|
STRT
-
NASDAQ
Strattec Security Corp
AUTOMOTIVE - Auto Parts
|
$97.64
|
-3.32
-3.29% |
$101.75
|
52,642
210.57% of 50 DAV
50 DAV is 25,000
|
$110.96
-12.00%
|
11/20/2014
|
$105.76
|
PP = $109.54
|
|
MB = $115.02
|
Most Recent Note - 12/10/2014 6:27:33 PM
Y - Endured more distributional pressure today slumping near its 50 DMA line ($95.41). Subsequent losses leading to a violation may trigger a technical sell signal. See the latest FSU analysis for more details and annotated graphs.
>>> FEATURED STOCK ARTICLE : Little Overhead Supply in Thinly Traded Company - 12/9/2014
View all notes |
Set NEW NOTE alert |
CANSLIM.net Company Profile |
SEC
News |
Chart |
Request a new note
C
A N
S L
I M
|
Symbol/Exchange
Company Name
Industry Group |
PRICE |
CHANGE
(%Change) |
Day High |
Volume
(% DAV)
(% 50 day avg vol) |
52 Wk Hi
% From Hi |
Featured
Date |
Price
Featured |
Pivot Featured |
|
Max Buy |
UIHC
-
NASDAQ
United Insurance Holding
Insurance-Prop/Cas/Titl
|
$19.98
|
-2.23
-10.04% |
$21.68
|
421,780
183.38% of 50 DAV
50 DAV is 230,000
|
$22.32
-10.48%
|
12/5/2014
|
$20.64
|
PP = $20.31
|
|
MB = $21.33
|
Most Recent Note - 12/10/2014 1:29:26 PM
G - Gapped down today, abruptly retreating from its 52-week high following 6 consecutive gains marked by volume. Prior highs near $20 define initial support to watch on pullbacks.
>>> FEATURED STOCK ARTICLE : Technical Breakout Indicative of Institutional Demand - 12/5/2014
View all notes |
Set NEW NOTE alert |
CANSLIM.net Company Profile |
SEC
News |
Chart |
Request a new note
C
A N
S L
I M
|
|
|
|
THESE ARE NOT BUY RECOMMENDATIONS!
Comments contained in the body of this report are technical
opinions only. The material herein has been obtained
from sources believed to be reliable and accurate, however,
its accuracy and completeness cannot be guaranteed.
This site is not an investment advisor, hence it does
not endorse or recommend any securities or other investments.
Any recommendation contained in this report may not
be suitable for all investors and it is not to be deemed
an offer or solicitation on our part with respect to
the purchase or sale of any securities. All trademarks,
service marks and trade names appearing in this report
are the property of their respective owners, and are
likewise used for identification purposes only.
This report is a service available
only to active Paid Premium Members.
You may opt-out of receiving report notifications
at any time. Questions or comments may be submitted
by writing to Premium Membership Services 665 S.E. 10 Street, Suite 201 Deerfield Beach, FL 33441-5634 or by calling 1-800-965-8307
or 954-785-1121.
|
|
|

