You are not logged in.
This means you
CAN ONLY VIEW reports that were published prior to Tuesday, April 8, 2025.
You
MUST UPGRADE YOUR MEMBERSHIP if you want to see any current reports.
AFTER MARKET UPDATE - TUESDAY, DECEMBER 9TH, 2014
Previous After Market Report Next After Market Report >>>
|
|
|
|
DOW |
-51.28 |
17,801.20 |
-0.29% |
|
Volume |
814,039,060 |
+3% |
|
Volume |
1,788,199,910 |
-1% |
|
NASDAQ |
+25.78 |
4,766.47 |
+0.54% |
|
Advancers |
1,889 |
59% |
|
Advancers |
1,927 |
65% |
|
S&P 500 |
-0.49 |
2,059.82 |
-0.02% |
|
Decliners |
1,244 |
39% |
|
Decliners |
967 |
32% |
|
Russell 2000 |
+20.85 |
1,188.06 |
+1.79% |
|
52 Wk Highs |
105 |
|
|
52 Wk Highs |
84 |
|
|
S&P 600 |
+11.83 |
686.09 |
+1.75% |
|
52 Wk Lows |
253 |
|
|
52 Wk Lows |
168 |
|
|
 |
Major Averages Found Support Following Early Weakness
Kenneth J. Gruneisen - Passed the CAN SLIM® Master's Exam
Stocks pared losses to finish mixed on Tuesday. The Dow recovered from down 222 points to close off 51 at 17,801. The S&P 500 was less than a point lower at 2,059. The NASDAQ Composite rallied from a 66 point decline to up 26 at 4,766. The volume totals were reported mixed, higher on the NYSE and lighter on the Nasdaq exchange. Breadth was positive as advancers led decliners by a 3-2 margin on the NYSE and 2-1 margin on the Nasdaq exchange. There were 49 high-ranked companies from the CANSLIM.net Leaders List that made new 52-week highs and appeared on the CANSLIM.net BreakOuts Page, matching the prior session total of 49 stocks. New 52-week lows outnumbered new 52-week highs on the NYSE and on the Nasdaq exchange. There were 9 gainers among the 11 high-ranked companies currently on the Featured Stocks Page. A "confirmed uptrend" for the market (M criteria) has been repeatedly noted in this daily Market Commentary since large gains were noted on 10/21/14 backed by higher volume totals as leadership (stocks hitting new 52-week highs) expanded.
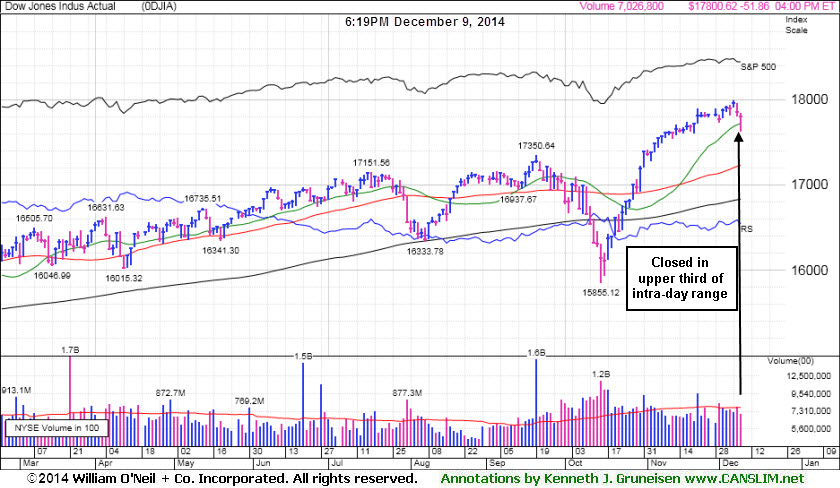
PICTURED: The Dow Jones Industrial Average lost ground but finished in the upper third of its intra-day range, a sign that the market was finding decent support.
The U.S. equity market tempered an early retreat that was prompted by selloff in global equities. Growth and liquidity concerns in China and political uncertainty in Greece were cited as reasons for investors to take profits after seven consecutive weekly gains by the major averages. On the U.S. economic front, small business sentiment improved more than expected in November. Additional readings showed wholesale inventories rose 0.4% and pace of job openings increased in October.
Gains in tech and energy helped offset overseas concerns. Apple (AAPL +1.53%) rose. Diamond Offshore (DO +8.05%) rallied as WTI crude oil rebounded +1.2% off its five-year low to $63.79/barrel. In the consumer discretionary space, AutoZone (AZO +4.26%) rose after its earnings results beat consensus estimates. Telecom was the worst performing group on the session. Verizon (VZ -4.05%) was lower after saying discounts would negatively impact profits in its wireless business.
Treasuries were higher as a fresh $25 billion three-year note auction drew stronger-than-expected demand. The benchmark 10-year rose 11/32 to yield 2.22%. In commodities, COMEX gold futures climbed +2.9% to $1,228.90/ounce.
Disciplined investors know that new buying efforts may be made under the fact-based investment system only in stocks meeting all key criteria. The Featured Stocks Page shows the most action-worthy candidates and their latest notes and a Headline Link directs members to the latest detailed analysis with data-packed graphs annotated by a Certified expert along with links to additional resources. The Premium Member Homepage includes "dynamic archives" to all prior pay reports published.
|
 Kenneth J. Gruneisen started out as a licensed stockbroker in August 1987, a couple of months prior to the historic stock market crash that took the Dow Jones Industrial Average down -22.6% in a single day. He has published daily fact-based fundamental and technical analysis on high-ranked stocks online for two decades. Through FACTBASEDINVESTING.COM, Kenneth provides educational articles, news, market commentary, and other information regarding proven investment systems that work in good times and bad.
Comments contained in the body of this report are technical opinions only and are not necessarily those of Gruneisen Growth Corp. The material herein has been obtained from sources believed to be reliable and accurate, however, its accuracy and completeness cannot be guaranteed. Our firm, employees, and customers may effect transactions, including transactions contrary to any recommendation herein, or have positions in the securities mentioned herein or options with respect thereto. Any recommendation contained in this report may not be suitable for all investors and it is not to be deemed an offer or solicitation on our part with respect to the purchase or sale of any securities. |
|
 |
Commodity-Linked Groups Posted Standout Gains
Kenneth J. Gruneisen - Passed the CAN SLIM® Master's Exam
The Networking Index ($NWX +1.03%) led the tech sector and the Biotechnology Index ($BTK +0.41%) also edged higher, but the Semiconductor Index ($SOX -0.02%) ended unchanged on Tuesday. The Broker/Dealer Index ($XBD +0.68%) had a positive bias while the Bank Index ($BKX -0.01%) was unchanged. Commodity-linked groups were big gainers. The Oil Services Index ($OSX +2.61%) outpaced the Integrated Oil Index ($XOI +0.38%).
Charts courtesy www.stockcharts.com
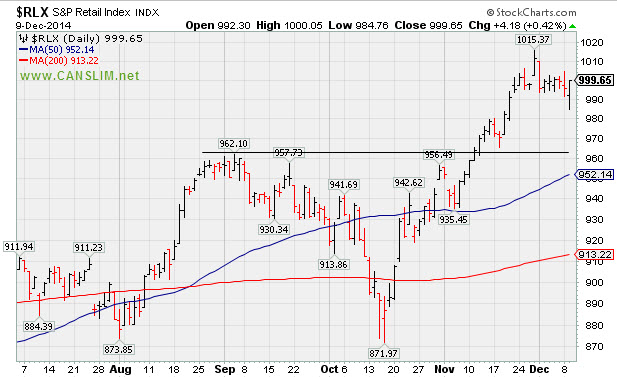
PICTURED 1: The Retail Index ($RLX +0.42%) posted a modest gain. It has been consolidating well above its September highs.
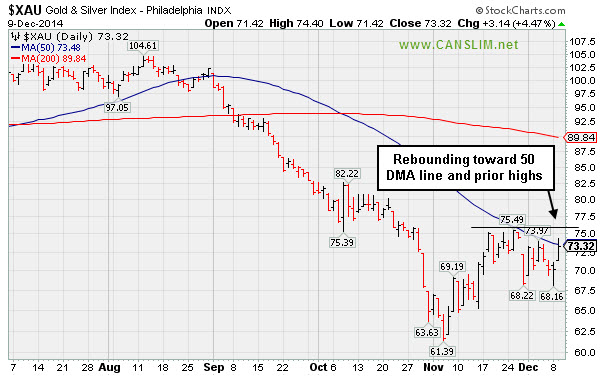
PICTURED 2: Rebounding from multi-year lows, the Gold & Silver Index ($XAU +4.46%) was a standout gainer while challenging its 50-day moving average (DMA) line and also challenging recent highs.
| Oil Services |
$OSX |
206.17 |
+5.24 |
+2.61% |
-26.64% |
| Integrated Oil |
$XOI |
1,312.98 |
+4.96 |
+0.38% |
-12.65% |
| Semiconductor |
$SOX |
692.84 |
-0.16 |
-0.02% |
+29.50% |
| Networking |
$NWX |
349.15 |
+3.55 |
+1.03% |
+7.78% |
| Broker/Dealer |
$XBD |
185.06 |
+1.26 |
+0.68% |
+15.26% |
| Retail |
$RLX |
999.65 |
+4.18 |
+0.42% |
+6.37% |
| Gold & Silver |
$XAU |
73.31 |
+3.13 |
+4.46% |
-12.88% |
| Bank |
$BKX |
74.54 |
-0.01 |
-0.01% |
+7.62% |
| Biotech |
$BTK |
3,538.02 |
+14.32 |
+0.41% |
+51.82% |
|
|
|
 |
Little Overhead Supply in Thinly Traded Company
Kenneth J. Gruneisen - Passed the CAN SLIM® Master's Exam
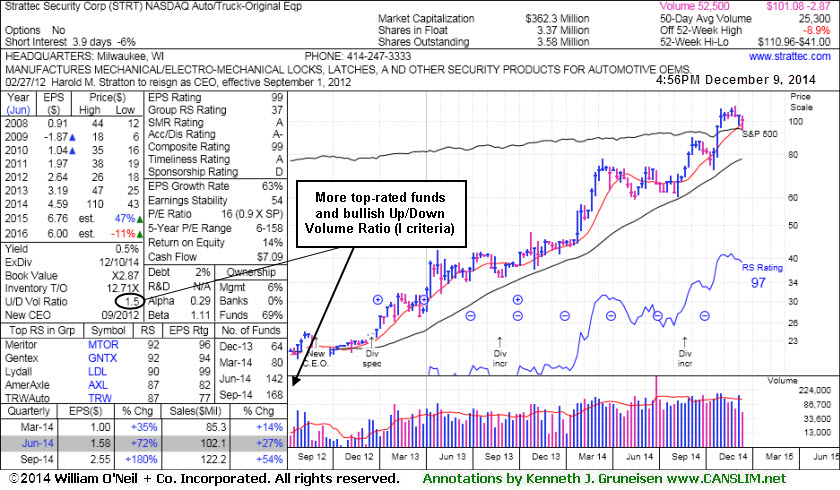
Strattec Security Corp (STRT +$0.52 or +0.52% to $101.08) managed a "positive reversal" today after testing support at its 50-day moving average (DMA) line. After forming an advanced "3-weeks tight" base it has not produced the volume-driven gains for new highs needed to trigger a new (or add-on) technical buy signal. Prior highs in the $89 area define the next important near-term support to watch below its 50 DMA line. Subsequent violations would raise concerns and trigger technical sell signals. The thinly-traded stock has a small supply (S criteria) of only 3.37 million shares in the public float which can contribute to greater price volatility in the event of institutional buying or selling.
STRT was last shown in this FSU section on 11/20/14 with annotated graphs under the headline, "Formed New Advanced '3-Weeks Tight' Base". The pivot point cited was based on its 10/28/14 high plus 10 cents. The Auto/Truck - Original Equipment firm has created a little resistance due to overhead supply up through the $110 level while recently consolidating.
It has traded up as much as +55.25% since first highlighted in yellow at $71.47 with pivot point based on its 6/06/14 high plus 10 cents in the 8/22/14 mid-day report (read here). Quarterly earnings increases through Sep '14 were above the +25% minimum guideline satisfy the C criteria and its annual earnings (A criteria) history has been strong.
Increasing ownership by top-rated funds (I criteria) is a reassuring sign. The number of top-rated funds owning its shares rose from 59 in Sep '14 to 168 in Sep '14, a very reassuring sign concerning the I criteria. Its current Up/Down Volume Ratio of 1.4 is an unbiased indication its shares have been under accumulation over the past 50 days.

|
|
|
Color Codes Explained :
Y - Better candidates highlighted by our
staff of experts.
G - Previously featured
in past reports as yellow but may no longer be buyable under the
guidelines.
***Last / Change / Volume data in this table is the closing quote data***
Symbol/Exchange
Company Name
Industry Group |
PRICE |
CHANGE
(%Change) |
Day High |
Volume
(% DAV)
(% 50 day avg vol) |
52 Wk Hi
% From Hi |
Featured
Date |
Price
Featured |
Pivot Featured |
|
Max Buy |
ACT
-
NYSE
Actavis plc
Medical-Generic Drugs
|
$263.73
|
-1.84
-0.69% |
$263.88
|
1,977,938
62.91% of 50 DAV
50 DAV is 3,144,000
|
$272.75
-3.31%
|
6/20/2014
|
$216.53
|
PP = $230.87
|
|
MB = $242.41
|
Most Recent Note - 12/8/2014 6:21:28 PM
G - Still consolidating after spiking to new 52-week highs with volume-driven gains following news it plans to acquire Allergan (AGN) for $66 Billion. Did not form a sound base, and it is extended from prior highs in the $249 area defining near-term support.
>>> FEATURED STOCK ARTICLE : Perched at Highs Following Spike on Acquisition Plans - 11/24/2014
View all notes |
Set NEW NOTE alert |
CANSLIM.net Company Profile |
SEC
News |
Chart |
Request a new note
C
A N
S L
I M


|
AFSI
-
NASDAQ
Amtrust Financial Svcs
INSURANCE - Property and; Casualty Insurance
|
$56.44
|
+1.79
3.28% |
$56.60
|
1,132,099
105.70% of 50 DAV
50 DAV is 1,071,000
|
$55.30
2.06%
|
10/17/2014
|
$45.24
|
PP = $46.02
|
|
MB = $48.32
|
Most Recent Note - 12/8/2014 6:40:19 PM
G - Gain today on light volume helped it finish at a best-ever close. At its 52-week high, rising from a brief consolidation, not a sound base. Prior highs near $46 coincide with its 50 DMA line defining important near-term support.
>>> FEATURED STOCK ARTICLE : No Sound Base Formed, Yet Little Resistance Remains - 11/21/2014
View all notes |
Set NEW NOTE alert |
CANSLIM.net Company Profile |
SEC
News |
Chart |
Request a new note
C
A N
S L
I M
|
ALXN
-
NASDAQ
Alexion Pharmaceuticals
DRUGS - Drug Manufacturers - Other
|
$199.78
|
+2.65
1.34% |
$200.06
|
1,027,132
91.54% of 50 DAV
50 DAV is 1,122,000
|
$203.30
-1.73%
|
10/23/2014
|
$184.01
|
PP = $185.53
|
|
MB = $194.81
|
Most Recent Note - 12/8/2014 6:33:17 PM
G - Encountering mild distributional pressure while consolidating near its 52-week high, extended from its previously noted. Recent lows near $185 define initial support to watch above its 50 DMA line.
>>> FEATURED STOCK ARTICLE : Quietly Consolidating Near All-Time High - 11/28/2014
View all notes |
Set NEW NOTE alert |
CANSLIM.net Company Profile |
SEC
News |
Chart |
Request a new note
C
A N
S L
I M
|
BIDU
-
NASDAQ
Baidu Inc Ads
INTERNET - Internet Information Providers
|
$229.90
|
+2.23
0.98% |
$231.33
|
3,001,232
80.72% of 50 DAV
50 DAV is 3,718,000
|
$251.99
-8.77%
|
10/30/2014
|
$234.08
|
PP = $231.51
|
|
MB = $243.09
|
Most Recent Note - 12/8/2014 6:34:54 PM
Y - Tested support at its 50 DMA line with above average volume behind today's loss. More damaging losses would raise greater concerns and trigger technical sell signals.
>>> FEATURED STOCK ARTICLE : Consolidating Near Prior Highs and Above 50-Day Average - 12/3/2014
View all notes |
Set NEW NOTE alert |
CANSLIM.net Company Profile |
SEC
News |
Chart |
Request a new note
C
A N
S L
I M
|
EPAM
-
NYSE
Epam Systems Inc
COMPUTER SOFTWARE and SERVICES - Information Technology Service
|
$51.95
|
+1.74
3.47% |
$52.73
|
309,294
72.26% of 50 DAV
50 DAV is 428,000
|
$52.29
-0.65%
|
10/23/2014
|
$45.21
|
PP = $46.09
|
|
MB = $48.39
|
 Most Recent Note - 12/9/2014 7:20:29 PM
G - Hit a new 52-week high but today's gain was backed by light volume. Its 50 DMA line ($46.63) defines near-term support to watch on pullbacks.
>>> FEATURED STOCK ARTICLE : Quiet Gain For New High Close - 11/26/2014
View all notes |
Set NEW NOTE alert |
CANSLIM.net Company Profile |
SEC
News |
Chart |
Request a new note
C
A N
S L
I M
|
Symbol/Exchange
Company Name
Industry Group |
PRICE |
CHANGE
(%Change) |
Day High |
Volume
(% DAV)
(% 50 day avg vol) |
52 Wk Hi
% From Hi |
Featured
Date |
Price
Featured |
Pivot Featured |
|
Max Buy |
FB
-
NASDAQ
Facebook Inc Cl A
INTERNET
|
$76.84
|
+0.32
0.42% |
$76.93
|
25,336,951
71.40% of 50 DAV
50 DAV is 35,485,000
|
$81.16
-5.32%
|
9/9/2014
|
$76.67
|
PP = $76.84
|
|
MB = $80.68
|
Most Recent Note - 12/8/2014 6:38:07 PM
Y - Posted quiet gains to get back above the 50 DMA line helping its outlook to improve and its color code is changed to yellow yet no new pivot point has been cited.
>>> FEATURED STOCK ARTICLE : Gains Above 50-Day Moving Average Needed for Outlook to Improve - 12/4/2014
View all notes |
Set NEW NOTE alert |
CANSLIM.net Company Profile |
SEC
News |
Chart |
Request a new note
C
A N
S L
I M
|
FLT
-
NYSE
Fleetcor Technologies
DIVERSIFIED SERVICES - Business/Management Services
|
$148.70
|
+0.59
0.40% |
$148.88
|
430,409
57.24% of 50 DAV
50 DAV is 752,000
|
$160.40
-7.29%
|
10/31/2014
|
$148.50
|
PP = $146.29
|
|
MB = $153.60
|
Most Recent Note - 12/8/2014 6:12:31 PM
Y - Recently enduring distributional pressure and testing support at prior highs in the $146-149 area along with its 50 DMA line. More damaging losses may trigger a worrisome technical sell signal. See the latest FSU analysis for more details and new annotated graphs.
>>> FEATURED STOCK ARTICLE : Testing Support While Encountering Recent Distributional Pressure - 12/8/2014
View all notes |
Set NEW NOTE alert |
CANSLIM.net Company Profile |
SEC
News |
Chart |
Request a new note
C
A N
S L
I M
|
ILMN
-
NASDAQ
Illumina Inc
DRUGS - Biotechnology
|
$187.31
|
-2.58
-1.36% |
$188.45
|
736,249
60.05% of 50 DAV
50 DAV is 1,226,000
|
$197.37
-5.10%
|
10/22/2014
|
$188.77
|
PP = $182.27
|
|
MB = $191.38
|
Most Recent Note - 12/8/2014 6:24:07 PM
Y - Holding its ground while consolidating well above prior highs near $182 and above its 50 DMA line. Damaging losses below those levels would raise concerns and trigger technical sell signals.
>>> FEATURED STOCK ARTICLE : Quietly Consolidating Back Below "Max Buy" Level - 11/25/2014
View all notes |
Set NEW NOTE alert |
CANSLIM.net Company Profile |
SEC
News |
Chart |
Request a new note
C
A N
S L
I M
|
PANW
-
NYSE
Palo Alto Networks
Computer Sftwr-Security
|
$118.84
|
+1.98
1.69% |
$119.45
|
1,364,824
68.45% of 50 DAV
50 DAV is 1,994,000
|
$123.22
-3.55%
|
7/30/2014
|
$84.21
|
PP = $85.88
|
|
MB = $90.17
|
Most Recent Note - 12/8/2014 6:25:54 PM
G - Quietly consolidating near all-time highs. It did not form a sound base, and the 50 DMA line defines near-term support to watch. Reported earnings +88% on +50% sales revenues for the Oct '14 quarter.
>>> FEATURED STOCK ARTICLE : Under Accumulation But Extended From Sound Base - 12/1/2014
View all notes |
Set NEW NOTE alert |
CANSLIM.net Company Profile |
SEC
News |
Chart |
Request a new note
C
A N
S L
I M
|
STRT
-
NASDAQ
Strattec Security Corp
AUTOMOTIVE - Auto Parts
|
$101.08
|
+0.52
0.52% |
$101.10
|
35,399
141.60% of 50 DAV
50 DAV is 25,000
|
$110.96
-8.90%
|
11/20/2014
|
$105.76
|
PP = $109.54
|
|
MB = $115.02
|
Most Recent Note - 12/9/2014 7:14:38 PM
Y - Managed a "positive reversal" today after testing support at its 50 DMA line. See the latest FSU analysis for more details and new annotated graphs.
>>> FEATURED STOCK ARTICLE : Little Overhead Supply in Thinly Traded Company - 12/9/2014
View all notes |
Set NEW NOTE alert |
CANSLIM.net Company Profile |
SEC
News |
Chart |
Request a new note
C
A N
S L
I M
|
Symbol/Exchange
Company Name
Industry Group |
PRICE |
CHANGE
(%Change) |
Day High |
Volume
(% DAV)
(% 50 day avg vol) |
52 Wk Hi
% From Hi |
Featured
Date |
Price
Featured |
Pivot Featured |
|
Max Buy |
UIHC
-
NASDAQ
United Insurance Holding
Insurance-Prop/Cas/Titl
|
$22.21
|
+0.69
3.21% |
$22.32
|
395,045
171.76% of 50 DAV
50 DAV is 230,000
|
$21.76
2.09%
|
12/5/2014
|
$20.64
|
PP = $20.31
|
|
MB = $21.33
|
Most Recent Note - 12/9/2014 7:19:03 PM
G - Rallied further beyond its "max buy" level with above average volume behind today's 6th consecutive gain. Prior highs near $20 define initial support to watch on pullbacks.
>>> FEATURED STOCK ARTICLE : Technical Breakout Indicative of Institutional Demand - 12/5/2014
View all notes |
Set NEW NOTE alert |
CANSLIM.net Company Profile |
SEC
News |
Chart |
Request a new note
C
A N
S L
I M
|
|
|
|
THESE ARE NOT BUY RECOMMENDATIONS!
Comments contained in the body of this report are technical
opinions only. The material herein has been obtained
from sources believed to be reliable and accurate, however,
its accuracy and completeness cannot be guaranteed.
This site is not an investment advisor, hence it does
not endorse or recommend any securities or other investments.
Any recommendation contained in this report may not
be suitable for all investors and it is not to be deemed
an offer or solicitation on our part with respect to
the purchase or sale of any securities. All trademarks,
service marks and trade names appearing in this report
are the property of their respective owners, and are
likewise used for identification purposes only.
This report is a service available
only to active Paid Premium Members.
You may opt-out of receiving report notifications
at any time. Questions or comments may be submitted
by writing to Premium Membership Services 665 S.E. 10 Street, Suite 201 Deerfield Beach, FL 33441-5634 or by calling 1-800-965-8307
or 954-785-1121.
|
|
|

