You are not logged in.
This means you
CAN ONLY VIEW reports that were published prior to Tuesday, April 15, 2025.
You
MUST UPGRADE YOUR MEMBERSHIP if you want to see any current reports.
AFTER MARKET UPDATE - WEDNESDAY, NOVEMBER 30TH, 2011
Previous After Market Report Next After Market Report >>>
|
|
|
|
DOW |
+490.05 |
12,045.68 |
+4.24% |
|
Volume |
1,667,232,870 |
+82% |
|
Volume |
2,367,168,680 |
+52% |
|
NASDAQ |
+104.83 |
2,620.34 |
+4.17% |
|
Advancers |
2,835 |
81% |
|
Advancers |
2,237 |
76% |
|
S&P 500 |
+51.77 |
1,246.96 |
+4.33% |
|
Decliners |
518 |
15% |
|
Decliners |
565 |
19% |
|
Russell 2000 |
+41.32 |
737.42 |
+5.94% |
|
52 Wk Highs |
106 |
|
|
52 Wk Highs |
61 |
|
|
S&P 600 |
+22.67 |
410.48 |
+5.85% |
|
52 Wk Lows |
27 |
|
|
52 Wk Lows |
62 |
|
|
 |
Major Indices Rise Above 50-Day Moving Average Lines
Kenneth J. Gruneisen - Passed the CAN SLIM® Master's Exam
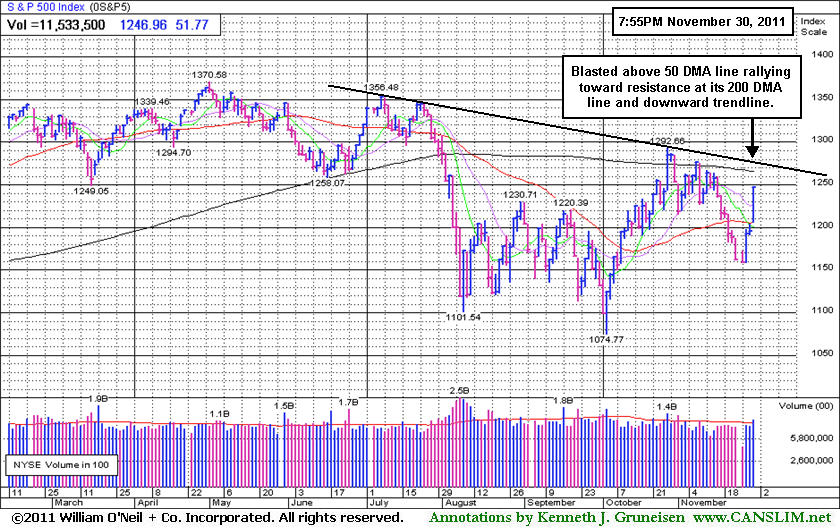
The Dow Jones Industrial Average, S&P 500 Index and the Nasdaq Composite Index have collectively rallied above their 50-day moving average (DMA) line. Wednesday's big gains helped their technical stance, however the Dow is currently the only one of the 3 major indices trading above its longer-term 200 DMA line. Advancers beat decliners by 7-1 on the NYSE and by 5-1 on the Nasdaq exchange. Volume totals increased substantially on the NYSE and on the Nasdaq exchange as the indices tallied big gains, indicating an enthusiastic surge of heavy buying demand from the institutional crowd. New 52-week highs outnumbered new 52-week lows on the NYSE, meanwhile the highs/lows totals were evenly matched on the Nasdaq exchange. There were 56 high-ranked company from the CANSLIM.net Leaders List that made a new 52-week high and appeared on the CANSLIM.net BreakOuts Page, up substantially from the prior session total of 16 stocks. There were gains for all 15 of the high-ranked companies currently included on the Featured Stocks Page.
Bulls were in full force on Wall Street, sending markets to their biggest three-day gains since August. Stocks were sharply higher due to efforts by central banks to ease the increasing strains on the global financial system. The world's major central banks agreed to joint actions by providing cheap, emergency U.S. dollar loans to banks in Europe. Meanwhile, China loosened its monetary policy by lowering the reserve requirement ratio for banks. The 10-year note closed off 25/32 to yield 2.08%, pushing the yield higher for a fourth straight day in the longest stretch of increases this month.
Economic data added to the optimism. The number of pending home sales rose the most in more than a year and companies added more private-sector workers than anticipated in November. In addition, business activity in the Midwest grew faster than expected as orders surged. The Fed's Beige Book also helped as it showed that economic activity in most major U.S. regions increased at a moderate pace over the last two months.
Our monthly newsletter CANSLIM.net News will be published soon with an informative review of current market conditions, leading groups, and best buy candidates. Via the Premium Member Homepage links to all prior reports and webcasts are always available.
PICTURED: The S&P 500 Index is in healthier shape based on its gain above its 50 DMA line.
|
 Kenneth J. Gruneisen started out as a licensed stockbroker in August 1987, a couple of months prior to the historic stock market crash that took the Dow Jones Industrial Average down -22.6% in a single day. He has published daily fact-based fundamental and technical analysis on high-ranked stocks online for two decades. Through FACTBASEDINVESTING.COM, Kenneth provides educational articles, news, market commentary, and other information regarding proven investment systems that work in good times and bad.
Comments contained in the body of this report are technical opinions only and are not necessarily those of Gruneisen Growth Corp. The material herein has been obtained from sources believed to be reliable and accurate, however, its accuracy and completeness cannot be guaranteed. Our firm, employees, and customers may effect transactions, including transactions contrary to any recommendation herein, or have positions in the securities mentioned herein or options with respect thereto. Any recommendation contained in this report may not be suitable for all investors and it is not to be deemed an offer or solicitation on our part with respect to the purchase or sale of any securities. |
|
 |
Bank Index Rallied Above 50-Day Average
Kenneth J. Gruneisen - Passed the CAN SLIM® Master's Exam
Financial stocks were a positive influence on the major averages as the Broker/Dealer Index ($XBD +6.55%) and Bank Index ($BKX +7.21%) spiked higher. Commodity-linked groups also tallied large gains as the Gold & Silver Index ($XAU +6.89%), Oil Services Index ($OSX +6.16%), and Integrated Oil Index ($XOI +5.20%) surged. The Healthcare Index ($HMO +4.53%) produced a healthy-sized gains and the tech sector saw unanimous gains from the Internet Index ($IIX +3.85%), Biotechnology Index ($BTK +4.03%), Networking Index ($NWX +5.73%), and the Semiconductor Index ($SOX +5.87%) produced solid gains. The Retail Index ($RLX +1.58%) was a relative laggard, yet it still finished the broadly positive session with a good gain.
Charts courtesy www.stockcharts.com
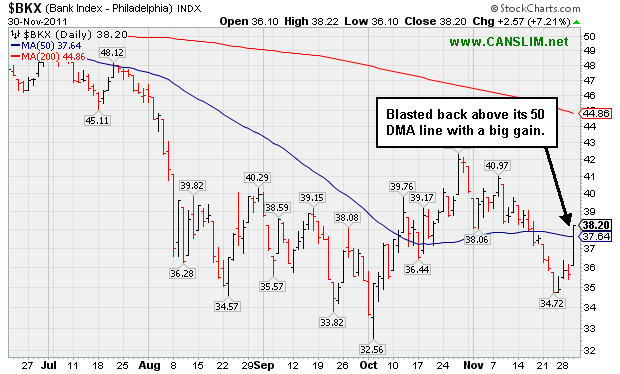
PICTURED: The Bank Index ($BKX +7.21%) blasted above its 50-day moving average (DMA) line.
| Oil Services |
$OSX |
231.01 |
+13.41 |
+6.16% |
-5.76% |
| Healthcare |
$HMO |
2,325.84 |
+100.70 |
+4.53% |
+37.46% |
| Integrated Oil |
$XOI |
1,232.75 |
+60.92 |
+5.20% |
+1.61% |
| Semiconductor |
$SOX |
373.32 |
+20.70 |
+5.87% |
-9.35% |
| Networking |
$NWX |
226.39 |
+12.27 |
+5.73% |
-19.31% |
| Internet |
$IIX |
286.84 |
+10.64 |
+3.85% |
-6.79% |
| Broker/Dealer |
$XBD |
83.98 |
+5.16 |
+6.55% |
-30.89% |
| Retail |
$RLX |
527.43 |
+8.22 |
+1.58% |
+3.75% |
| Gold & Silver |
$XAU |
208.30 |
+13.43 |
+6.89% |
-8.07% |
| Bank |
$BKX |
38.20 |
+2.57 |
+7.21% |
-26.83% |
| Biotech |
$BTK |
1,076.74 |
+41.68 |
+4.03% |
-17.02% |
|
|
|
 |
Rallied Above "Max Buy" Level Following Consolidation
Kenneth J. Gruneisen - Passed the CAN SLIM® Master's Exam
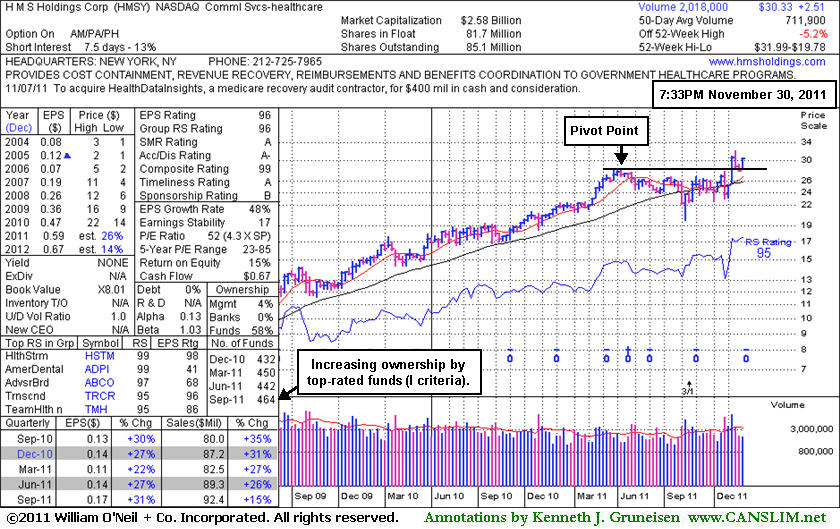
H M S Holdings Corp (HMSY +$1.35 or +4.66% to $30.33) gapped up today for another solid gain with slightly above average volume, and its color code was changed to green after rising back above its "max buy" level. Prior highs in the $27-28 area acted as support during the recent pullback. Its last appearance in this FSU section was on 11/04/11 with an annotated graph under the headline, "Recent Damage Needs Repair For Outlook to Improve." On the very next session it not only repaired the damage, it confirmed a technical buy signal with a solid volume-driven gain into new high territory.
It reported earnings +31% on +15% sales revenues for the quarter ended September 30, 2011 versus the year ago period. This Commercial Services - Healthcare firm has maintained a solid sales revenues and earnings growth history that still satisfies the C and A criteria. The number of top-rated funds owning its shares has risen from 432 in Dec '10 to 464 in Sep '11, a reassuring sign concerning the I criteria.
|
|
|
Color Codes Explained :
Y - Better candidates highlighted by our
staff of experts.
G - Previously featured
in past reports as yellow but may no longer be buyable under the
guidelines.
***Last / Change / Volume data in this table is the closing quote data***
Symbol/Exchange
Company Name
Industry Group |
PRICE |
CHANGE
(%Change) |
Day High |
Volume
(% DAV)
(% 50 day avg vol) |
52 Wk Hi
% From Hi |
Featured
Date |
Price
Featured |
Pivot Featured |
|
Max Buy |
ADS
-
NYSE
Alliance Data Sys Corp
COMPUTER SOFTWARE and SERVICES - Information and Delivery Service
|
$102.41
|
+5.03
5.17% |
$102.52
|
1,153,236
121.41% of 50 DAV
50 DAV is 949,900
|
$107.18
-4.45%
|
10/21/2011
|
$97.94
|
PP = $101.15
|
|
MB = $106.21
|
 Most Recent Note - 11/30/2011 11:54:10 AM
Y - Rebounding back above its 50 DMA line and rising toward prior highs. Color code is changed to yellow (no new pivot point cited) based on its resilience and another gap up today.
>>> The latest Featured Stock Update with an annotated graph appeared on 11/17/2011. Click here.
View all notes |
Alert me of new notes |
CANSLIM.net Company Profile |
SEC |
Zacks Reports |
StockTalk |
News |
Chart |
Request a new note
C
A N
S L
I M


|
ALXN
-
NASDAQ
Alexion Pharmaceuticals
DRUGS - Drug Manufacturers - Other
|
$68.66
|
+2.69
4.08% |
$68.71
|
1,474,789
96.94% of 50 DAV
50 DAV is 1,521,300
|
$70.42
-2.50%
|
11/30/2011
|
$68.66
|
PP = $70.52
|
|
MB = $74.05
|
Most Recent Note - 11/30/2011 7:18:01 PM
Y - Rallied within close striking distance of its 52 week high with today's gain on average volume. A new pivot point is cited based on its 52-week high plus ten cents after forming an orderly flat base pattern. Volume-driven gains are needed to trigger a new (or add-on) technical buy signal.
>>> The latest Featured Stock Update with an annotated graph appeared on 11/14/2011. Click here.
View all notes |
Alert me of new notes |
CANSLIM.net Company Profile |
SEC |
Zacks Reports |
StockTalk |
News |
Chart |
Request a new note
C
A N
S L
I M
|
CELG
-
NASDAQ
Celgene Corp
DRUGS - Drug Manufacturers - Major
|
$63.08
|
+1.85
3.02% |
$63.12
|
3,540,122
92.15% of 50 DAV
50 DAV is 3,841,700
|
$68.25
-7.58%
|
9/16/2011
|
$61.21
|
PP = $62.59
|
|
MB = $65.72
|
Most Recent Note - 11/30/2011 7:20:30 PM
G - Today's gain helped it in rebounding toward its 50 DMA line which may now act as resistance, meanwhile gains above it are needed for its outlook to improve.
>>> The latest Featured Stock Update with an annotated graph appeared on 11/7/2011. Click here.
View all notes |
Alert me of new notes |
CANSLIM.net Company Profile |
SEC |
Zacks Reports |
StockTalk |
News |
Chart |
Request a new note
C
A N
S L
I M
|
FEIC
-
NASDAQ
F E I Co
ELECTRONICS - Diversified Electronics
|
$40.36
|
+2.69
7.14% |
$40.38
|
468,065
107.13% of 50 DAV
50 DAV is 436,900
|
$42.25
-4.47%
|
10/28/2011
|
$40.31
|
PP = $40.88
|
|
MB = $42.92
|
Most Recent Note - 11/30/2011 11:45:16 AM
G - Gapped up today, rebounding toward prior highs. It faces resistance due to overhead supply up through the $42 area.
>>> The latest Featured Stock Update with an annotated graph appeared on 11/25/2011. Click here.
View all notes |
Alert me of new notes |
CANSLIM.net Company Profile |
SEC |
Zacks Reports |
StockTalk |
News |
Chart |
Request a new note
C
A N
S L
I M
|
GNC
-
NYSE
G N C Holdings Inc
RETAIL - Drug Stores
|
$27.27
|
+0.04
0.15% |
$27.97
|
5,731,430
446.27% of 50 DAV
50 DAV is 1,284,300
|
$28.50
-4.32%
|
10/26/2011
|
$24.60
|
PP = $24.80
|
|
MB = $26.04
|
Most Recent Note - 11/30/2011 7:23:05 PM
G - Today it traded heavy volume but didn't make meaningful price progress while churning near its all-time high. Prior chart highs in the $25-26 area define initial support to watch on pullbacks.
>>> The latest Featured Stock Update with an annotated graph appeared on 11/21/2011. Click here.
View all notes |
Alert me of new notes |
CANSLIM.net Company Profile |
SEC |
Zacks Reports |
StockTalk |
News |
Chart |
Request a new note
C
A N
S L
I M
|
Symbol/Exchange
Company Name
Industry Group |
PRICE |
CHANGE
(%Change) |
Day High |
Volume
(% DAV)
(% 50 day avg vol) |
52 Wk Hi
% From Hi |
Featured
Date |
Price
Featured |
Pivot Featured |
|
Max Buy |
HMSY
-
NASDAQ
H M S Holdings Corp
COMPUTER SOFTWARE and SERVICES - Healthcare Information Service
|
$30.33
|
+1.35
4.66% |
$30.39
|
848,318
125.01% of 50 DAV
50 DAV is 678,600
|
$31.99
-5.19%
|
10/27/2011
|
$26.44
|
PP = $28.37
|
|
MB = $29.79
|
Most Recent Note - 11/30/2011 7:49:55 PM
G - Gapped up today for another solid gain with slightly above average volume, and its color code is changed to green after rising above its "max buy" level. Prior highs in the $27-28 area acted as support during the recent pullback. See the latest FSU analysis for more details and a new annotated weekly graph.
>>> The latest Featured Stock Update with an annotated graph appeared on 11/30/2011. Click here.
View all notes |
Alert me of new notes |
CANSLIM.net Company Profile |
SEC |
Zacks Reports |
StockTalk |
News |
Chart |
Request a new note
C
A N
S L
I M
|
ISRG
-
NASDAQ
Intuitive Surgical Inc
HEALTH SERVICES - Medical Appliances and Equipment
|
$434.21
|
+11.59
2.74% |
$437.98
|
485,358
117.61% of 50 DAV
50 DAV is 412,700
|
$449.06
-3.31%
|
10/19/2011
|
$424.69
|
PP = $415.29
|
|
MB = $436.05
|
Most Recent Note - 11/30/2011 7:26:55 PM
Y - Gapped up again today for a solid gain on above average. Found support recently well above its 50 DMA line near prior chart highs.
>>> The latest Featured Stock Update with an annotated graph appeared on 11/15/2011. Click here.
View all notes |
Alert me of new notes |
CANSLIM.net Company Profile |
SEC |
Zacks Reports |
StockTalk |
News |
Chart |
Request a new note
C
A N
S L
I M
|
MG
-
NYSE
Mistras Group Inc
DIVERSIFIED SERVICES - Bulding and Faci;ity Management Services
|
$23.53
|
+0.87
3.84% |
$24.01
|
227,585
109.89% of 50 DAV
50 DAV is 207,100
|
$23.51
0.09%
|
10/28/2011
|
$22.49
|
PP = $23.61
|
|
MB = $24.79
|
Most Recent Note - 11/30/2011 11:49:01 AM
Y - Gapped up again today, rallying above its pivot point, and a strong close with sufficient volume may trigger a proper technical buy signal. Its 50 DMA line and prior highs acted as support.
>>> The latest Featured Stock Update with an annotated graph appeared on 11/11/2011. Click here.
View all notes |
Alert me of new notes |
CANSLIM.net Company Profile |
SEC |
Zacks Reports |
StockTalk |
News |
Chart |
Request a new note
C
A N
S L
I M
|
MKTX
-
NASDAQ
Marketaxess Holdings Inc
FINANCIAL SERVICES - Investment Brokerage - Nationa
|
$28.94
|
+1.09
3.91% |
$28.95
|
267,439
110.47% of 50 DAV
50 DAV is 242,100
|
$31.45
-7.98%
|
10/28/2011
|
$29.79
|
PP = $31.05
|
|
MB = $32.60
|
Most Recent Note - 11/30/2011 7:12:48 PM
G - Gapped up today and posted a gain with slightly above average volume. It still faces previously stubborn resistance in the $31 area.
>>> The latest Featured Stock Update with an annotated graph appeared on 11/23/2011. Click here.
View all notes |
Alert me of new notes |
CANSLIM.net Company Profile |
SEC |
Zacks Reports |
StockTalk |
News |
Chart |
Request a new note
C
A N
S L
I M
|
OSIS
-
NASDAQ
O S I Systems Inc
ELECTRONICS - Semiconductor Equipment and Mate
|
$47.81
|
+2.83
6.29% |
$47.83
|
214,229
144.36% of 50 DAV
50 DAV is 148,400
|
$47.39
0.89%
|
11/1/2011
|
$42.07
|
PP = $45.57
|
|
MB = $47.85
|
Most Recent Note - 11/30/2011 7:03:06 PM
Y - Gapped up today and rallied with +44% above average volume for a close above its previously cited pivot point for a new high, confirming a technical buy signal. The recent lows ($42.20 on 11/25/11) defines an important support level to watch. See the latest FSU analysis for more details and a new annotated graph.
>>> The latest Featured Stock Update with an annotated graph appeared on 11/28/2011. Click here.
View all notes |
Alert me of new notes |
CANSLIM.net Company Profile |
SEC |
Zacks Reports |
StockTalk |
News |
Chart |
Request a new note
C
A N
S L
I M
|
Symbol/Exchange
Company Name
Industry Group |
PRICE |
CHANGE
(%Change) |
Day High |
Volume
(% DAV)
(% 50 day avg vol) |
52 Wk Hi
% From Hi |
Featured
Date |
Price
Featured |
Pivot Featured |
|
Max Buy |
RAX
-
NYSE
Rackspace Hosting Inc
INTERNET - Internet Software and; Services
|
$43.38
|
+1.71
4.10% |
$43.46
|
1,639,362
103.07% of 50 DAV
50 DAV is 1,590,600
|
$46.50
-6.70%
|
11/8/2011
|
$44.28
|
PP = $46.27
|
|
MB = $48.58
|
Most Recent Note - 11/30/2011 7:08:06 PM
Y - Gapped up today for a 3rd consecutive gain with average volume, rallying from support at its closely coinciding 50 and 200 DMA lines. Subsequent violations would trigger damaging technical sell signals. Its color code is changed to yellow based on its resilience, however it still faces previously stubborn resistance in the $45 area.
>>> The latest Featured Stock Update with an annotated graph appeared on 11/10/2011. Click here.
View all notes |
Alert me of new notes |
CANSLIM.net Company Profile |
SEC |
Zacks Reports |
StockTalk |
News |
Chart |
Request a new note
C
A N
S L
I M
|
SWI
-
NYSE
Solarwinds Inc
COMPUTER SOFTWARE and SERVICES - Application Software
|
$32.79
|
+2.15
7.02% |
$33.06
|
1,664,682
142.01% of 50 DAV
50 DAV is 1,172,200
|
$31.69
3.47%
|
10/27/2011
|
$27.78
|
PP = $25.62
|
|
MB = $26.90
|
Most Recent Note - 11/30/2011 11:43:10 AM
G - Gapped up today for a considerable gain and a new all-time high, getting extended from its prior base. Prior highs in the $25-26 area define initial chart support to watch on pullbacks.
>>> The latest Featured Stock Update with an annotated graph appeared on 11/22/2011. Click here.
View all notes |
Alert me of new notes |
CANSLIM.net Company Profile |
SEC |
Zacks Reports |
StockTalk |
News |
Chart |
Request a new note
C
A N
S L
I M
|
TDG
-
NYSE
Transdigm Group Inc
AEROSPACE/DEFENSE - Aerospace/Defense Products and; Services
|
$96.42
|
+3.85
4.16% |
$96.58
|
1,515,410
366.93% of 50 DAV
50 DAV is 413,000
|
$102.73
-6.14%
|
11/9/2011
|
$98.45
|
PP = $95.14
|
|
MB = $99.90
|
Most Recent Note - 11/30/2011 11:57:21 AM
Y - Gapped up today, and it stayed well above its 50 DMA line during its recent consolidation. A subsequent slump below the recent low and its 50 DMA line would trigger technical sell signals.
>>> The latest Featured Stock Update with an annotated graph appeared on 11/9/2011. Click here.
View all notes |
Alert me of new notes |
CANSLIM.net Company Profile |
SEC |
Zacks Reports |
StockTalk |
News |
Chart |
Request a new note
C
A N
S L
I M
|
UA
-
NYSE
Under Armour Inc Cl A
CONSUMER NON-DURABLES - Textile - Apparel Clothing
|
$81.33
|
+3.02
3.86% |
$83.00
|
2,265,170
170.52% of 50 DAV
50 DAV is 1,328,400
|
$87.40
-6.95%
|
10/25/2011
|
$82.43
|
PP = $80.80
|
|
MB = $84.84
|
Most Recent Note - 11/30/2011 12:00:32 PM
G - Gapped up today rallying toward prior highs. Subsequent weakness exceeding the recent low ($73.55 on 11/21/11) would raise concerns and trigger a technical sell signal.
>>> The latest Featured Stock Update with an annotated graph appeared on 11/29/2011. Click here.
View all notes |
Alert me of new notes |
CANSLIM.net Company Profile |
SEC |
Zacks Reports |
StockTalk |
News |
Chart |
Request a new note
C
A N
S L
I M
|
V
-
NYSE
Visa Inc Cl A
DIVERSIFIED SERVICES - Business/Management Services
|
$96.97
|
+4.07
4.38% |
$97.03
|
5,376,242
101.34% of 50 DAV
50 DAV is 5,305,100
|
$95.87
1.15%
|
10/24/2011
|
$94.21
|
PP = $94.85
|
|
MB = $99.59
|
Most Recent Note - 11/30/2011 12:48:14 PM
Y - Gapped up today challenging its 52-week high without great volume conviction helping it rally. Proof of serious institutional demand requires at least +50% heavier than average volume behind a meaningful gain.
>>> The latest Featured Stock Update with an annotated graph appeared on 11/18/2011. Click here.
View all notes |
Alert me of new notes |
CANSLIM.net Company Profile |
SEC |
Zacks Reports |
StockTalk |
News |
Chart |
Request a new note
C
A N
S L
I M
|
Symbol/Exchange
Company Name
Industry Group |
PRICE |
CHANGE
(%Change) |
Day High |
Volume
(% DAV)
(% 50 day avg vol) |
52 Wk Hi
% From Hi |
Featured
Date |
Price
Featured |
Pivot Featured |
|
Max Buy |
|
|
|
THESE ARE NOT BUY RECOMMENDATIONS!
Comments contained in the body of this report are technical
opinions only. The material herein has been obtained
from sources believed to be reliable and accurate, however,
its accuracy and completeness cannot be guaranteed.
This site is not an investment advisor, hence it does
not endorse or recommend any securities or other investments.
Any recommendation contained in this report may not
be suitable for all investors and it is not to be deemed
an offer or solicitation on our part with respect to
the purchase or sale of any securities. All trademarks,
service marks and trade names appearing in this report
are the property of their respective owners, and are
likewise used for identification purposes only.
This report is a service available
only to active Paid Premium Members.
You may opt-out of receiving report notifications
at any time. Questions or comments may be submitted
by writing to Premium Membership Services 665 S.E. 10 Street, Suite 201 Deerfield Beach, FL 33441-5634 or by calling 1-800-965-8307
or 954-785-1121.
|
|
|

