You are not logged in.
This means you
CAN ONLY VIEW reports that were published prior to Tuesday, April 8, 2025.
You
MUST UPGRADE YOUR MEMBERSHIP if you want to see any current reports.
AFTER MARKET UPDATE - MONDAY, NOVEMBER 25TH, 2024
Previous After Market Report Next After Market Report >>>
|
|
|
|
DOW |
+440.06 |
44,736.57 |
+0.99% |
|
Volume |
1,860,079,184 |
+91% |
|
Volume |
8,213,582,500 |
+20% |
|
NASDAQ |
+51.18 |
19,054.84 |
+0.27% |
|
Advancers |
2,023 |
74% |
|
Advancers |
2,925 |
67% |
|
S&P 500 |
+18.03 |
5,987.37 |
+0.30% |
|
Decliners |
725 |
26% |
|
Decliners |
1,431 |
33% |
|
Russell 2000 |
+35.36 |
2,442.03 |
+1.47% |
|
52 Wk Highs |
451 |
|
|
52 Wk Highs |
547 |
|
|
S&P 600 |
+27.32 |
1,544.66 |
+1.80% |
|
52 Wk Lows |
17 |
|
|
52 Wk Lows |
77 |
|
|
 |
Major Indices Posted Solid Gains With Greater Leadership
Kenneth J. Gruneisen - Passed the CAN SLIM® Master's Exam
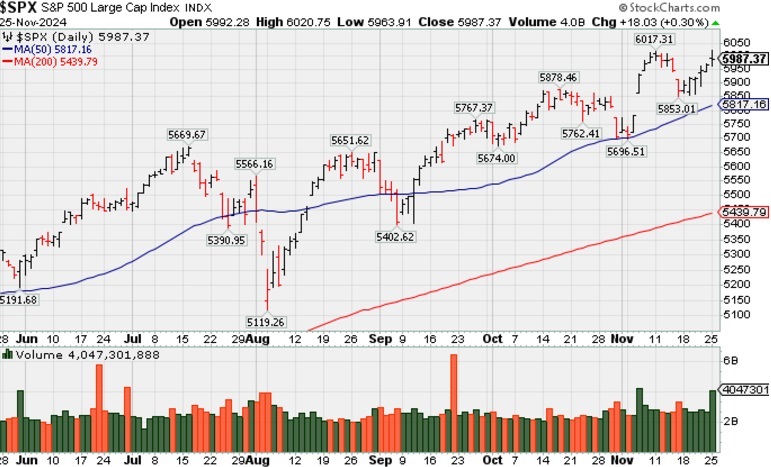
The Dow Jones Industrial Average (+1.0%), Russell 2000 (+1.5%), and S&P Mid Cap 400 (+1.5%) posted solid gains while the S&P 500 (+0.3%) and Nasdaq Composite (+0.3%) both posted smaller gains Volume totals reported were higher than the prior session total on the NYSE and on the Nasdaq exchange, action indicative of heavier institutional buying demand. Advancers led decliners by almost a 3-1 margin on the NYSE and by more than a 2-1 margin on the Nasdaq exchange. Leadership expanded as there were 202 high-ranked companies from the Leaders List that hit new 52-week highs and were listed on the BreakOuts Page, versus the total of 129 on the prior session. New 52-week highs totals expanded and outnumbered shrinking new 52-week lows on the NYSE and on the Nasdaq exchange. The major indices are in a confirmed uptrend (M criteria). Disciplined investors know that new buying efforts are only to be made in stocks meeting all key criteria of the fact-based investment system.
PICTURED: The S&P 500 Index hit a new all-time high with its 6th consecutive gain backed by higher volume.
Nine of the 11 S&P 500 sectors higher led by real estate (+1.3%), which reacted to the drop in rates. The consumer discretionary sector was the next best performer, gaining +1.0%. The energy sector was the weakest performer, dropped -2.0% as oil prices slid following news that Israel and Hezbollah could be nearing a ceasefire agreement. WTI crude futures settled -3.3% lower at $68.93/bbl. NVIDIA (NVDA -4.2%) and Tesla (TSLA -4.0%) were hit with profit-taking pressure.
Stocks reacted favorably to President-elect Trump’s nomination of Scott Bessent for Treasury Secretary, perceived as a "market-friendly" choice due to his background as a hedge fund manager. According to The Wall Street Journal, Bessent has expressed his priority to advance the Trump administration tax-cut proposals. Mr. Bessent will also focus on reducing the national debt, cutting the budget deficit to 3% of GDP, and advocating for a more gradual approach to tariffs in order to prevent runaway inflation.
The 10-yr yield dropped 15 basis points to 4.27% and the 2-yr yield dropped ten basis points to 4.27%. Also, the U.S. Treasury saw stellar demand for a fresh $69 billion 2-yr note offering.
|
 Kenneth J. Gruneisen started out as a licensed stockbroker in August 1987, a couple of months prior to the historic stock market crash that took the Dow Jones Industrial Average down -22.6% in a single day. He has published daily fact-based fundamental and technical analysis on high-ranked stocks online for two decades. Through FACTBASEDINVESTING.COM, Kenneth provides educational articles, news, market commentary, and other information regarding proven investment systems that work in good times and bad.
Comments contained in the body of this report are technical opinions only and are not necessarily those of Gruneisen Growth Corp. The material herein has been obtained from sources believed to be reliable and accurate, however, its accuracy and completeness cannot be guaranteed. Our firm, employees, and customers may effect transactions, including transactions contrary to any recommendation herein, or have positions in the securities mentioned herein or options with respect thereto. Any recommendation contained in this report may not be suitable for all investors and it is not to be deemed an offer or solicitation on our part with respect to the purchase or sale of any securities. |
|
 |
Retail, Tech, and Financial Indexes Rose
Kenneth J. Gruneisen - Passed the CAN SLIM® Master's Exam
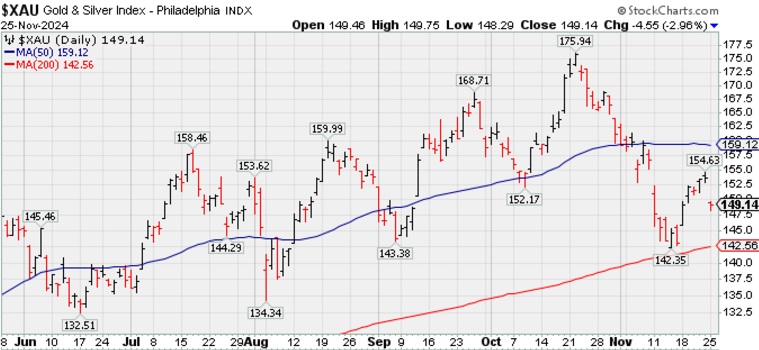
The Retail Index ($RLX +2.36%) posted a standout gain while the Bank Index ($BKX +0.99%) and the Broker/Dealer Index ($XBD +0.79%) both posted smaller gains. The tech sector was had a positive bias as the Biotech Index ($BTK +1.25%) outpaced the Networking Index ($NWX +0.86%) and the Semiconductor Index ($SOX +0.65%). The Gold & Silver Index ($XAU -2.96%) and the Integrated Oil Index ($XOI -1.99%) both lost ground while the Oil Services Index ($OSX -0.11%) was little changed.
PICTURED: The Gold & Silver Index ($XAU -2.96%) gapped down today suffering as big loss.
| Oil Services |
$OSX |
81.14 |
-0.09 |
-0.11% |
-3.27% |
| Integrated Oil |
$XOI |
1,934.28 |
-39.28 |
-1.99% |
+3.86% |
| Semiconductor |
$SOX |
4,987.92 |
+32.13 |
+0.65% |
+19.46% |
| Networking |
$NWX |
1,207.46 |
+10.27 |
+0.86% |
+44.99% |
| Broker/Dealer |
$XBD |
854.95 |
+6.69 |
+0.79% |
+53.41% |
| Retail Index |
$RLX |
4,862.64 |
+8.87 |
+0.18% |
+25.04% |
| Gold & Silver |
$XAU |
149.14 |
-4.55 |
-2.96% |
+18.66% |
| Bank |
$BKX |
138.78 |
+1.36 |
+0.99% |
+44.53% |
| Biotech |
$BTK |
5,897.78 |
+72.98 |
+1.25% |
+8.84% |
|
|
|
 |
Featured Stocks
Kenneth J. Gruneisen - Passed the CAN SLIM® Master's Exam
Symbol/Exchange
Company Name
Industry Group | PRICE | CHANGE
(%Change) | Day High | Volume
(% DAV)
(% 50 day avg vol) | 52 Wk Hi
% From Hi | Featured
Date | Price
Featured | Pivot Featured | | Max Buy |  USLM - NASDAQ USLM - NASDAQ
U.S. Lime & Minerals
Bldg-Cement/Concrt/Ag | $148.55 | -1.18
-0.79% | $153.91 | 95,357
123.84% of 50 DAV
50 DAV is 77,000 | $151.47
-1.93%
| 9/17/2024 | $71.26 | PP = $87.23 | | MB = $91.59 | Most Recent Note - 11/21/2024 1:52:06 PM
G - Hitting yet another new all-time high with today''s big gain. Held its ground stubbornly following a noted spurt of volume-driven gains. Its 50 DMA line ($109) defines important near-term support to watch on pullbacks.
>>> FEATURED STOCK ARTICLE : Extended From Any Sound Base After Impressive Rally - 11/12/2024 | View all notes | Set NEW NOTE alert | Company Profile | SEC News | Chart | Request a new note C A S I | GVA - NYSE
Granite Construction
Bldg-Heavy Construction | $99.13 | -0.16
-0.16% | $100.57 | 820,384
119.24% of 50 DAV
50 DAV is 688,000 | $99.72
-0.59%
| 6/11/2024 | $59.76 | PP = $64.33 | | MB = $67.55 | Most Recent Note - 11/19/2024 3:46:29 PM
G - On track today for a 2nd consecutive gain with light volume. Perched near its all-time high, stubbornly holding its ground while very extended from any sound base. Bullish action has come after it reported Sep '24 quarterly earnings +19% on +14% sales revenues versus the year-ago period, below the +25% minimum guideline (C criteria) of the fact-based investment system.
>>> FEATURED STOCK ARTICLE : Extended From Base After Streak of Gains for New Highs - 11/8/2024 | View all notes | Set NEW NOTE alert | Company Profile | SEC News | Chart | Request a new note C A S I | TXRH - NASDAQ
Texas Roadhouse
Retail-Restaurants | $202.12 | +7.22
3.70% | $203.03 | 876,948
122.14% of 50 DAV
50 DAV is 718,000 | $203.32
-0.59%
| 7/26/2024 | $173.08 | PP = $175.82 | | MB = $184.61 |  Most Recent Note - 11/25/2024 8:56:30 PM Most Recent Note - 11/25/2024 8:56:30 PM
G - Posted a solid gain today with +22% above-average volume for a best-ever close. Its 50 DMA line ($184.26) defines important support to watch on pullbacks.
>>> FEATURED STOCK ARTICLE : Hovering Near High After Recent Volume-driven Gains - 11/15/2024 | View all notes | Set NEW NOTE alert | Company Profile | SEC News | Chart | Request a new note C A S I | HWM - NYSE
Howmet Aerospace
Aerospace/Defense | $115.84 | -2.60
-2.20% | $118.34 | 2,907,489
123.78% of 50 DAV
50 DAV is 2,349,000 | $119.28
-2.88%
| 7/30/2024 | $93.95 | PP = $85.52 | | MB = $89.80 | Most Recent Note - 11/25/2024 8:50:31 PM
G - Pulled back from its all-time high with today''s loss on average volume following recent volume-driven gains, It is extended from any sound base. Its prior high ($106.93 on 10/21/24) and 50 DMA line ($105) define near-term support levels to watch on pullbacks. Fundamentals remain strong.
>>> FEATURED STOCK ARTICLE : Found Support at 50-Day Moving Average Line Before Earnings Report - 11/5/2024 | View all notes | Set NEW NOTE alert | Company Profile | SEC News | Chart | Request a new note C A S I | NGVC - NYSE
Natural Grocers
Retail-Super/Mini Mkts | $46.98 | +1.38
3.03% | $47.32 | 241,373
241.37% of 50 DAV
50 DAV is 100,000 | $45.61
3.00%
| 11/5/2024 | $30.57 | PP = $30.42 | | MB = $31.94 | Most Recent Note - 11/25/2024 8:51:28 PM
G - Powered to another new all-time high with today's 7th consecutive volume-driven gain, getting very extended from any sound base. Bullish action came after it reported Sep '24 quarterly earnings +50% on +9% sales revenues versus the year-ago period. Prior high in the $30 area defines initial support to watch above its 50 DMA line.
>>> FEATURED STOCK ARTICLE : New High After 6th Consecutive Gain - 11/11/2024 | View all notes | Set NEW NOTE alert | Company Profile | SEC News | Chart | Request a new note C A S I | Symbol/Exchange
Company Name
Industry Group | PRICE | CHANGE
(%Change) | Day High | Volume
(% DAV)
(% 50 day avg vol) | 52 Wk Hi
% From Hi | Featured
Date | Price
Featured | Pivot Featured | | Max Buy | CLS - NYSE
Celestica
Elec-Contract Mfg | $85.60 | -3.56
-3.99% | $91.32 | 2,445,884
105.38% of 50 DAV
50 DAV is 2,321,000 | $93.15
-8.11%
| 10/11/2024 | $57.62 | PP = $63.59 | | MB = $66.77 | Most Recent Note - 11/25/2024 8:48:45 PM
G - Pulled back today for a 2nd consecutive loss from its all-time high. It i very extended from any sound base. Its 50 DMA line ($65.74) and prior highs in the $63 area define initial support to watch on pullbacks.
>>> FEATURED STOCK ARTICLE : Pulling Back After Considerable Rally - 11/13/2024 | View all notes | Set NEW NOTE alert | Company Profile | SEC News | Chart | Request a new note C A S I | PAY - NYSE
Paymentus Holdings
Finance-CrdtCard/PmtPr | $37.81 | +1.37
3.76% | $37.90 | 379,410
116.03% of 50 DAV
50 DAV is 327,000 | $37.00
2.19%
| 10/17/2024 | $26.15 | PP = $25.31 | | MB = $26.58 | Most Recent Note - 11/25/2024 8:53:00 PM
G - Extended from any sound base and today it hit a new 52-week high with another gain backed by average volume. Bullish action came after it reported Sep '24 quarterly earnings +67% on +52% sales revenues versus the year-ago period.
>>> FEATURED STOCK ARTICLE : Extended From Prior Base After Considerable Spike Higher - 11/14/2024 | View all notes | Set NEW NOTE alert | Company Profile | SEC News | Chart | Request a new note C A S I | RMD - NYSE
ResMed
Medical-Products | $249.56 | +5.78
2.37% | $249.77 | 1,708,448
165.55% of 50 DAV
50 DAV is 1,032,000 | $260.49
-4.20%
| 10/25/2024 | $256.64 | PP = $255.28 | | MB = $268.04 | Most Recent Note - 11/25/2024 8:54:57 PM
Y - Color code was changed to yellow while rebounding above its 50 DMA line ($242) with above average volume behind a solid gain. Little resistance remains due to overhead supply.
>>> FEATURED STOCK ARTICLE : Recent Slump Below 50-Day Moving Average Raised Concerns - 11/18/2024 | View all notes | Set NEW NOTE alert | Company Profile | SEC News | Chart | Request a new note C A S I | ATGE - NYSE
Adtalem Global Education
Consumer Svcs-Education | $91.57 | +1.49
1.65% | $92.91 | 463,693
125.32% of 50 DAV
50 DAV is 370,000 | $92.93
-1.46%
| 10/30/2024 | $83.34 | PP = $80.28 | | MB = $84.29 | Most Recent Note - 11/21/2024 1:53:05 PM
G - Posting a gain today with light volume. Prior highs in the $80 area define initial support to watch on pullbacks. Fundamentals remain strong.
>>> FEATURED STOCK ARTICLE : Holding Ground Following Recent Technical Breakout - 11/4/2024 | View all notes | Set NEW NOTE alert | Company Profile | SEC News | Chart | Request a new note C A S I | TW - NASDAQ
Tradeweb Markets
Financial Svcs-Specialty | $135.00 | -0.99
-0.73% | $138.25 | 1,144,754
136.93% of 50 DAV
50 DAV is 836,000 | $137.44
-1.78%
| 11/19/2024 | $134.41 | PP = $136.23 | | MB = $143.04 | Most Recent Note - 11/19/2024 9:00:56 PM
Y - Finished strong today with above average volume behind its 4th consecutive gain. Color code was changed to yellow with pivot point cited based on its 10/15/24 high plus 10 cents. Found support recently at its 50 DMA line ($127.73). Subsequent volume-driven gains above the pivot point may trigger a proper technical buy signal. Reported earnings +36% on +37% sales revenues for the Sep '24 quarter versus the year ago period, its 4th quarterly comparison above the +25% minimum earnings guideline (C criteria). Annual earnings history has been strong since its $27 IPO on 4/04/19 and an additional Public Offerings on 10/17/19 and 4/24/20. See the latest FSU analysis for more details and a new annotated graph.
>>> FEATURED STOCK ARTICLE : Tradeweb Markets Perched Near High - 11/19/2024 | View all notes | Set NEW NOTE alert | Company Profile | SEC News | Chart | Request a new note C A S I | Symbol/Exchange
Company Name
Industry Group | PRICE | CHANGE
(%Change) | Day High | Volume
(% DAV)
(% 50 day avg vol) | 52 Wk Hi
% From Hi | Featured
Date | Price
Featured | Pivot Featured | | Max Buy |
|
|
|
Color Codes Explained :
Y - Better candidates highlighted by our
staff of experts.
G - Previously featured
in past reports as yellow but may no longer be buyable under the
guidelines.
***Last / Change / Volume data in this table is the closing quote data***
Symbol/Exchange
Company Name
Industry Group |
PRICE |
CHANGE
(%Change) |
Day High |
Volume
(% DAV)
(% 50 day avg vol) |
52 Wk Hi
% From Hi |
Featured
Date |
Price
Featured |
Pivot Featured |
|
Max Buy |
 USLM
-
NASDAQ
USLM
-
NASDAQ
U.S. Lime & Minerals
Bldg-Cement/Concrt/Ag
|
$149.73
|
-0.55
-0.37% |
$150.24
|
85,750
112.83% of 50 DAV
50 DAV is 76,000
|
$151.47
-1.15%
|
9/17/2024
|
$71.26
|
PP = $87.23
|
|
MB = $91.59
|
Most Recent Note - 11/21/2024 1:52:06 PM
G - Hitting yet another new all-time high with today's big gain. Held its ground stubbornly following a noted spurt of volume-driven gains. Its 50 DMA line ($109) defines important near-term support to watch on pullbacks.
>>> FEATURED STOCK ARTICLE : Extended From Any Sound Base After Impressive Rally - 11/12/2024 |
View all notes |
Set NEW NOTE alert |
Company Profile |
SEC
News |
Chart |
Request a new note
C
A
S
I |
GVA
-
NYSE
Granite Construction
Bldg-Heavy Construction
|
$99.29
|
+1.08
1.10% |
$99.72
|
334,035
47.58% of 50 DAV
50 DAV is 702,000
|
$99.32
-0.03%
|
6/11/2024
|
$59.76
|
PP = $64.33
|
|
MB = $67.55
|
Most Recent Note - 11/19/2024 3:46:29 PM
G - On track today for a 2nd consecutive gain with light volume. Perched near its all-time high, stubbornly holding its ground while very extended from any sound base. Bullish action has come after it reported Sep '24 quarterly earnings +19% on +14% sales revenues versus the year-ago period, below the +25% minimum guideline (C criteria) of the fact-based investment system.
>>> FEATURED STOCK ARTICLE : Extended From Base After Streak of Gains for New Highs - 11/8/2024 |
View all notes |
Set NEW NOTE alert |
Company Profile |
SEC
News |
Chart |
Request a new note
C
A
S
I |
TXRH
-
NASDAQ
Texas Roadhouse
Retail-Restaurants
|
$194.90
|
+2.34
1.22% |
$196.15
|
829,436
115.84% of 50 DAV
50 DAV is 716,000
|
$203.32
-4.14%
|
7/26/2024
|
$173.08
|
PP = $175.82
|
|
MB = $184.61
|
Most Recent Note - 11/22/2024 1:19:24 PM
G - Pulled back from its all-time high with 6 consecutive small losses backed by below average volume. Its 50 DMA line ($183.49) and prior highs in the $177-180 area define important support to watch on pullbacks.
>>> FEATURED STOCK ARTICLE : Hovering Near High After Recent Volume-driven Gains - 11/15/2024 |
View all notes |
Set NEW NOTE alert |
Company Profile |
SEC
News |
Chart |
Request a new note
C
A
S
I |
HWM
-
NYSE
Howmet Aerospace
Aerospace/Defense
|
$118.44
|
+1.46
1.25% |
$118.80
|
5,093,495
221.17% of 50 DAV
50 DAV is 2,303,000
|
$119.28
-0.70%
|
7/30/2024
|
$93.95
|
PP = $85.52
|
|
MB = $89.80
|
Most Recent Note - 11/22/2024 12:27:53 PM
G - Hovering at its all-time high, extended from any sound base. Its prior high ($106.93 on 10/21/24) and 50 DMA line ($104.57) define near-term support levels to watch on pullbacks. Fundamentals remain strong.
>>> FEATURED STOCK ARTICLE : Found Support at 50-Day Moving Average Line Before Earnings Report - 11/5/2024 |
View all notes |
Set NEW NOTE alert |
Company Profile |
SEC
News |
Chart |
Request a new note
C
A
S
I |
NGVC
-
NYSE
Natural Grocers
Retail-Super/Mini Mkts
|
$45.60
|
+9.35
25.79% |
$45.61
|
405,026
430.88% of 50 DAV
50 DAV is 94,000
|
$36.29
25.65%
|
11/5/2024
|
$30.57
|
PP = $30.42
|
|
MB = $31.94
|
Most Recent Note - 11/22/2024 12:50:00 PM
G - Powering to a new all-time high with today's considerable gap up and volume-driven gain, getting very extended from any sound base. Bullish action came after it reported Sep '24 quarterly earnings +50% on +9% sales revenues versus the year-ago period. Prior high in the $30 area defines initial support to watch above its 50 DMA line.
>>> FEATURED STOCK ARTICLE : New High After 6th Consecutive Gain - 11/11/2024 |
View all notes |
Set NEW NOTE alert |
Company Profile |
SEC
News |
Chart |
Request a new note
C
A
S
I |
Symbol/Exchange
Company Name
Industry Group |
PRICE |
CHANGE
(%Change) |
Day High |
Volume
(% DAV)
(% 50 day avg vol) |
52 Wk Hi
% From Hi |
Featured
Date |
Price
Featured |
Pivot Featured |
|
Max Buy |
CLS
-
NYSE
Celestica
Elec-Contract Mfg
|
$89.16
|
-2.28
-2.49% |
$91.73
|
3,258,175
142.97% of 50 DAV
50 DAV is 2,279,000
|
$93.15
-4.28%
|
10/11/2024
|
$57.62
|
PP = $63.59
|
|
MB = $66.77
|
Most Recent Note - 11/21/2024 12:23:57 PM
G - Today's 4th consecutive gain has it hitting another new all-time high, very extended from any sound base. Its 50 DMA line ($64) and prior highs in the $63 area define initial support to watch on pullbacks.
>>> FEATURED STOCK ARTICLE : Pulling Back After Considerable Rally - 11/13/2024 |
View all notes |
Set NEW NOTE alert |
Company Profile |
SEC
News |
Chart |
Request a new note
C
A
S
I |
PAY
-
NYSE
Paymentus Holdings
Finance-CrdtCard/PmtPr
|
$36.44
|
+0.13
0.36% |
$36.97
|
309,851
95.05% of 50 DAV
50 DAV is 326,000
|
$37.00
-1.51%
|
10/17/2024
|
$26.15
|
PP = $25.31
|
|
MB = $26.58
|
Most Recent Note - 11/22/2024 1:21:44 PM
G - Extended from any sound base and stubbornly holding its ground perched at its 52-week high with volume totals cooling. Bullish action came after it reported Sep '24 quarterly earnings +67% on +52% sales revenues versus the year-ago period.
>>> FEATURED STOCK ARTICLE : Extended From Prior Base After Considerable Spike Higher - 11/14/2024 |
View all notes |
Set NEW NOTE alert |
Company Profile |
SEC
News |
Chart |
Request a new note
C
A
S
I |
RMD
-
NYSE
ResMed
Medical-Products
|
$243.78
|
+0.18
0.07% |
$243.89
|
551,442
52.67% of 50 DAV
50 DAV is 1,047,000
|
$260.49
-6.41%
|
10/25/2024
|
$256.64
|
PP = $255.28
|
|
MB = $268.04
|
Most Recent Note - 11/22/2024 1:17:21 PM
Y - Color code is changed to yellow while consolidating near its downward sloping 50 DMA line ($241.85) with volume totals cooling. Little resistance remains due to overhead supply.
>>> FEATURED STOCK ARTICLE : Recent Slump Below 50-Day Moving Average Raised Concerns - 11/18/2024 |
View all notes |
Set NEW NOTE alert |
Company Profile |
SEC
News |
Chart |
Request a new note
C
A
S
I |
ATGE
-
NYSE
Adtalem Global Education
Consumer Svcs-Education
|
$90.08
|
+1.26
1.42% |
$91.21
|
337,331
90.68% of 50 DAV
50 DAV is 372,000
|
$92.93
-3.07%
|
10/30/2024
|
$83.34
|
PP = $80.28
|
|
MB = $84.29
|
Most Recent Note - 11/21/2024 1:53:05 PM
G - Posting a gain today with light volume. Prior highs in the $80 area define initial support to watch on pullbacks. Fundamentals remain strong.
>>> FEATURED STOCK ARTICLE : Holding Ground Following Recent Technical Breakout - 11/4/2024 |
View all notes |
Set NEW NOTE alert |
Company Profile |
SEC
News |
Chart |
Request a new note
C
A
S
I |
TW
-
NASDAQ
Tradeweb Markets
Financial Svcs-Specialty
|
$135.99
|
+0.92
0.68% |
$136.23
|
814,912
98.30% of 50 DAV
50 DAV is 829,000
|
$137.44
-1.06%
|
11/19/2024
|
$134.41
|
PP = $136.23
|
|
MB = $143.04
|
Most Recent Note - 11/19/2024 9:00:56 PM
Y - Finished strong today with above average volume behind its 4th consecutive gain. Color code was changed to yellow with pivot point cited based on its 10/15/24 high plus 10 cents. Found support recently at its 50 DMA line ($127.73). Subsequent volume-driven gains above the pivot point may trigger a proper technical buy signal. Reported earnings +36% on +37% sales revenues for the Sep '24 quarter versus the year ago period, its 4th quarterly comparison above the +25% minimum earnings guideline (C criteria). Annual earnings history has been strong since its $27 IPO on 4/04/19 and an additional Public Offerings on 10/17/19 and 4/24/20. See the latest FSU analysis for more details and a new annotated graph.
>>> FEATURED STOCK ARTICLE : Tradeweb Markets Perched Near High - 11/19/2024 |
View all notes |
Set NEW NOTE alert |
Company Profile |
SEC
News |
Chart |
Request a new note
C
A
S
I |
Symbol/Exchange
Company Name
Industry Group |
PRICE |
CHANGE
(%Change) |
Day High |
Volume
(% DAV)
(% 50 day avg vol) |
52 Wk Hi
% From Hi |
Featured
Date |
Price
Featured |
Pivot Featured |
|
Max Buy |
|
|
|
THESE ARE NOT BUY RECOMMENDATIONS!
Comments contained in the body of this report are technical
opinions only. The material herein has been obtained
from sources believed to be reliable and accurate, however,
its accuracy and completeness cannot be guaranteed.
This site is not an investment advisor, hence it does
not endorse or recommend any securities or other investments.
Any recommendation contained in this report may not
be suitable for all investors and it is not to be deemed
an offer or solicitation on our part with respect to
the purchase or sale of any securities. All trademarks,
service marks and trade names appearing in this report
are the property of their respective owners, and are
likewise used for identification purposes only.
This report is a service available
only to active Paid Premium Members.
You may opt-out of receiving report notifications
at any time. Questions or comments may be submitted
by writing to Premium Membership Services 665 S.E. 10 Street, Suite 201 Deerfield Beach, FL 33441-5634 or by calling 1-800-965-8307
or 954-785-1121.
|
|
|