You are not logged in.
This means you
CAN ONLY VIEW reports that were published prior to Tuesday, April 8, 2025.
You
MUST UPGRADE YOUR MEMBERSHIP if you want to see any current reports.
AFTER MARKET UPDATE - TUESDAY, NOVEMBER 26TH, 2024
Previous After Market Report Next After Market Report >>>
|
|
|
|
DOW |
+123.74 |
44,860.31 |
+0.28% |
|
Volume |
914,384,256 |
-51% |
|
Volume |
6,648,200,900 |
-19% |
|
NASDAQ |
+120.74 |
19,175.58 |
+0.63% |
|
Advancers |
970 |
36% |
|
Advancers |
1,746 |
41% |
|
S&P 500 |
+34.26 |
6,021.63 |
+0.57% |
|
Decliners |
1,759 |
64% |
|
Decliners |
2,501 |
59% |
|
Russell 2000 |
-17.72 |
2,424.31 |
-0.73% |
|
52 Wk Highs |
350 |
|
|
52 Wk Highs |
417 |
|
|
S&P 600 |
-13.69 |
1,530.97 |
-0.89% |
|
52 Wk Lows |
38 |
|
|
52 Wk Lows |
109 |
|
|
 |
Major Indices Were Mixed as Decliners Outnumbered Advancers
Kenneth J. Gruneisen - Passed the CAN SLIM® Master's Exam
The S&P 500 (+0.6%), Nasdaq Composite (+0.6%), and Dow Jones Industrial Average (+0.3%) closed near their best levels of the day. The DJIA and S&P 500 also logged fresh record intraday highs. Meanwhile, the Russell 2000 (-0.7%) and S&P Mid Cap 400 (-0.4%) both closed lower. Volume totals reported were lighter than the prior session totals on the NYSE and on the Nasdaq exchange. Decliners outpaced advancers by a 2-to-1 ratio at the NYSE and a 3-to-2 margin at the Nasdaq. Leadership waned as there were 62 high-ranked companies from the Leaders List that hit new 52-week highs and were listed on the BreakOuts Page, versus the total of 202 on the prior session. New 52-week highs totals contracted yet solidly outnumbered new 52-week lows on the NYSE and on the Nasdaq exchange. The major indices are in a confirmed uptrend (M criteria). Disciplined investors know that new buying efforts are only to be made in stocks meeting all key criteria of the fact-based investment system.
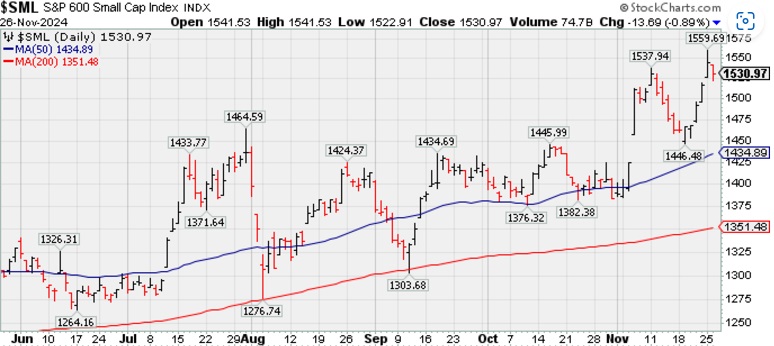
PICTURED: The S&P 600 Small Cap Index pulled back on Tuesday after hitting a new all-time high on the prior session.
President-elect Trump's announcement that he plans to impose tariffs raised concerns over inflationary pressures. The bond market saw the 10-yr yield settle four basis points higher at 4.30% while the 2-yr yield settled two basis points lower at 4.25%. A fresh $70 billion 5-yr note offering met solid demand.
Retailers that reported earnings faced pressure including Best Buy (BBY -4.9%), Kohl's (KSS -17.0%), and Abercrombie & Fitch (ANF -5.1%). Dow component Amgen (AMGN -4.8%) also fell after disappointing news from its Phase 2 trial update for the weight-loss drug MariTide.
|
 Kenneth J. Gruneisen started out as a licensed stockbroker in August 1987, a couple of months prior to the historic stock market crash that took the Dow Jones Industrial Average down -22.6% in a single day. He has published daily fact-based fundamental and technical analysis on high-ranked stocks online for two decades. Through FACTBASEDINVESTING.COM, Kenneth provides educational articles, news, market commentary, and other information regarding proven investment systems that work in good times and bad.
Comments contained in the body of this report are technical opinions only and are not necessarily those of Gruneisen Growth Corp. The material herein has been obtained from sources believed to be reliable and accurate, however, its accuracy and completeness cannot be guaranteed. Our firm, employees, and customers may effect transactions, including transactions contrary to any recommendation herein, or have positions in the securities mentioned herein or options with respect thereto. Any recommendation contained in this report may not be suitable for all investors and it is not to be deemed an offer or solicitation on our part with respect to the purchase or sale of any securities. |
|
 |
Retail and Biotech Indexes Led Group Gainers
Kenneth J. Gruneisen - Passed the CAN SLIM® Master's Exam
The Retail Index ($RLX +2.07%) posted a standout gain while the Bank Index ($BKX -0.29%) and the Broker/Dealer Index ($XBD -0.68%) both fell. The tech sector was mixed as the Biotech Index ($BTK +0.84%) outpaced the Networking Index ($NWX +0.20%), meanwhile the Semiconductor Index ($SOX -1.21%) slumped. The Gold & Silver Index ($XAU +0.45%) edged higher while the Integrated Oil Index ($XOI -0.27%) edged lower and the Oil Services Index ($OSX -1.81%) suffered a larger loss.
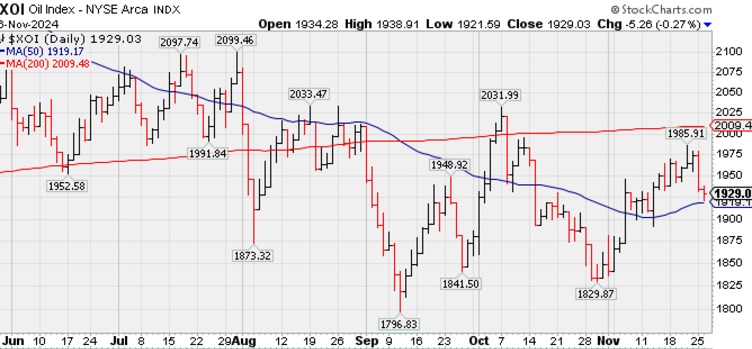
PICTURED: The Integrated Oil Index ($XOI -0.27%) was down for a 2nd consecutive session, sinking near its 50-day moving average (DMA) line.
| Oil Services |
$OSX |
79.67 |
-1.47 |
-1.81% |
-5.02% |
| Integrated Oil |
$XOI |
1,929.03 |
-5.26 |
-0.27% |
+3.57% |
| Semiconductor |
$SOX |
4,927.56 |
-60.36 |
-1.21% |
+18.01% |
| Networking |
$NWX |
1,209.92 |
+2.47 |
+0.20% |
+45.28% |
| Broker/Dealer |
$XBD |
850.00 |
-4.96 |
-0.58% |
+52.52% |
| Retail Index |
$RLX |
4,977.40 |
+114.76 |
+2.36% |
+27.99% |
| Gold & Silver |
$XAU |
149.82 |
+0.68 |
+0.45% |
+19.20% |
| Bank |
$BKX |
138.38 |
-0.40 |
-0.29% |
+44.11% |
| Biotech |
$BTK |
5,947.33 |
+49.55 |
+0.84% |
+9.75% |
|
|
|
 |
Featured Stocks
Kenneth J. Gruneisen - Passed the CAN SLIM® Master's Exam
|
|
|
Color Codes Explained :
Y - Better candidates highlighted by our
staff of experts.
G - Previously featured
in past reports as yellow but may no longer be buyable under the
guidelines.
***Last / Change / Volume data in this table is the closing quote data***
Symbol/Exchange
Company Name
Industry Group |
PRICE |
CHANGE
(%Change) |
Day High |
Volume
(% DAV)
(% 50 day avg vol) |
52 Wk Hi
% From Hi |
Featured
Date |
Price
Featured |
Pivot Featured |
|
Max Buy |
 USLM
-
NASDAQ
USLM
-
NASDAQ
U.S. Lime & Minerals
Bldg-Cement/Concrt/Ag
|
$157.45
|
+8.90
5.99% |
$159.53
|
252,479
327.89% of 50 DAV
50 DAV is 77,000
|
$153.91
2.30%
|
9/17/2024
|
$71.26
|
PP = $87.23
|
|
MB = $91.59
|
 Most Recent Note - 11/26/2024 7:10:38 PM
G - Very extended from any sound base, it hit yet another new all-time high with today's big volume-driven gain. Held its ground stubbornly following a noted spurt of volume-driven gains. Its 50 DMA line ($113) defines important near-term support to watch on pullbacks.
>>> FEATURED STOCK ARTICLE : Extended From Any Sound Base After Impressive Rally - 11/12/2024 |
View all notes |
Set NEW NOTE alert |
Company Profile |
SEC
News |
Chart |
Request a new note
C
A
S
I |
GVA
-
NYSE
Granite Construction
Bldg-Heavy Construction
|
$98.76
|
-0.37
-0.37% |
$99.65
|
494,711
70.77% of 50 DAV
50 DAV is 699,000
|
$100.57
-1.80%
|
6/11/2024
|
$59.76
|
PP = $64.33
|
|
MB = $67.55
|
Most Recent Note - 11/26/2024 7:05:12 PM
G - Hovering near its all-time high, stubbornly holding its ground, very extended from any sound base. Bullish action has come after it reported Sep '24 quarterly earnings +19% on +14% sales revenues versus the year-ago period, below the +25% minimum guideline (C criteria) of the fact-based investment system.
>>> FEATURED STOCK ARTICLE : Extended From Base After Streak of Gains for New Highs - 11/8/2024 |
View all notes |
Set NEW NOTE alert |
Company Profile |
SEC
News |
Chart |
Request a new note
C
A
S
I |
TXRH
-
NASDAQ
Texas Roadhouse
Retail-Restaurants
|
$204.71
|
+2.59
1.28% |
$204.94
|
739,243
102.96% of 50 DAV
50 DAV is 718,000
|
$203.32
0.68%
|
7/26/2024
|
$173.08
|
PP = $175.82
|
|
MB = $184.61
|
Most Recent Note - 11/26/2024 7:09:37 PM
G - Hit another new high with today's 3rd consecutive gain. Its 50 DMA line ($185) defines important support to watch on pullbacks.
>>> FEATURED STOCK ARTICLE : Hovering Near High After Recent Volume-driven Gains - 11/15/2024 |
View all notes |
Set NEW NOTE alert |
Company Profile |
SEC
News |
Chart |
Request a new note
C
A
S
I |
HWM
-
NYSE
Howmet Aerospace
Aerospace/Defense
|
$117.18
|
+1.34
1.16% |
$117.56
|
1,947,720
82.50% of 50 DAV
50 DAV is 2,361,000
|
$119.28
-1.76%
|
7/30/2024
|
$93.95
|
PP = $85.52
|
|
MB = $89.80
|
Most Recent Note - 11/25/2024 8:50:31 PM
G - Pulled back from its all-time high with today's loss on average volume following recent volume-driven gains, It is extended from any sound base. Its prior high ($106.93 on 10/21/24) and 50 DMA line ($105) define near-term support levels to watch on pullbacks. Fundamentals remain strong.
>>> FEATURED STOCK ARTICLE : Found Support at 50-Day Moving Average Line Before Earnings Report - 11/5/2024 |
View all notes |
Set NEW NOTE alert |
Company Profile |
SEC
News |
Chart |
Request a new note
C
A
S
I |
NGVC
-
NYSE
Natural Grocers
Retail-Super/Mini Mkts
|
$46.57
|
-0.41
-0.87% |
$47.29
|
172,222
165.60% of 50 DAV
50 DAV is 104,000
|
$47.32
-1.58%
|
11/5/2024
|
$30.57
|
PP = $30.42
|
|
MB = $31.94
|
Most Recent Note - 11/25/2024 8:51:28 PM
G - Powered to another new all-time high with today's 7th consecutive volume-driven gain, getting very extended from any sound base. Bullish action came after it reported Sep '24 quarterly earnings +50% on +9% sales revenues versus the year-ago period. Prior high in the $30 area defines initial support to watch above its 50 DMA line.
>>> FEATURED STOCK ARTICLE : New High After 6th Consecutive Gain - 11/11/2024 |
View all notes |
Set NEW NOTE alert |
Company Profile |
SEC
News |
Chart |
Request a new note
C
A
S
I |
Symbol/Exchange
Company Name
Industry Group |
PRICE |
CHANGE
(%Change) |
Day High |
Volume
(% DAV)
(% 50 day avg vol) |
52 Wk Hi
% From Hi |
Featured
Date |
Price
Featured |
Pivot Featured |
|
Max Buy |
CLS
-
NYSE
Celestica
Elec-Contract Mfg
|
$86.67
|
+1.07
1.25% |
$86.95
|
1,608,767
68.69% of 50 DAV
50 DAV is 2,342,000
|
$93.15
-6.96%
|
10/11/2024
|
$57.62
|
PP = $63.59
|
|
MB = $66.77
|
Most Recent Note - 11/25/2024 8:48:45 PM
G - Pulled back today for a 2nd consecutive loss from its all-time high. It i very extended from any sound base. Its 50 DMA line ($65.74) and prior highs in the $63 area define initial support to watch on pullbacks.
>>> FEATURED STOCK ARTICLE : Pulling Back After Considerable Rally - 11/13/2024 |
View all notes |
Set NEW NOTE alert |
Company Profile |
SEC
News |
Chart |
Request a new note
C
A
S
I |
PAY
-
NYSE
Paymentus Holdings
Finance-CrdtCard/PmtPr
|
$38.09
|
+0.28
0.74% |
$38.76
|
356,076
107.58% of 50 DAV
50 DAV is 331,000
|
$37.90
0.50%
|
10/17/2024
|
$26.15
|
PP = $25.31
|
|
MB = $26.58
|
Most Recent Note - 11/25/2024 8:53:00 PM
G - Extended from any sound base and today it hit a new 52-week high with another gain backed by average volume. Bullish action came after it reported Sep '24 quarterly earnings +67% on +52% sales revenues versus the year-ago period.
>>> FEATURED STOCK ARTICLE : Extended From Prior Base After Considerable Spike Higher - 11/14/2024 |
View all notes |
Set NEW NOTE alert |
Company Profile |
SEC
News |
Chart |
Request a new note
C
A
S
I |
RMD
-
NYSE
ResMed
Medical-Products
|
$249.99
|
+0.43
0.17% |
$251.20
|
675,631
64.72% of 50 DAV
50 DAV is 1,044,000
|
$260.49
-4.03%
|
10/25/2024
|
$256.64
|
PP = $255.28
|
|
MB = $268.04
|
Most Recent Note - 11/25/2024 8:54:57 PM
Y - Color code was changed to yellow while rebounding above its 50 DMA line ($242) with above average volume behind a solid gain. Little resistance remains due to overhead supply.
>>> FEATURED STOCK ARTICLE : Recent Slump Below 50-Day Moving Average Raised Concerns - 11/18/2024 |
View all notes |
Set NEW NOTE alert |
Company Profile |
SEC
News |
Chart |
Request a new note
C
A
S
I |
ATGE
-
NYSE
Adtalem Global Education
Consumer Svcs-Education
|
$91.43
|
-0.14
-0.15% |
$91.83
|
185,413
49.58% of 50 DAV
50 DAV is 374,000
|
$92.93
-1.61%
|
10/30/2024
|
$83.34
|
PP = $80.28
|
|
MB = $84.29
|
Most Recent Note - 11/26/2024 7:11:57 PM
G - Perched at its all-time high today, pausing with light volume. Prior highs in the $80 area define initial support to watch on pullbacks. Fundamentals remain strong.
>>> FEATURED STOCK ARTICLE : Holding Ground Following Recent Technical Breakout - 11/4/2024 |
View all notes |
Set NEW NOTE alert |
Company Profile |
SEC
News |
Chart |
Request a new note
C
A
S
I |
TW
-
NASDAQ
Tradeweb Markets
Financial Svcs-Specialty
|
$136.32
|
+1.32
0.98% |
$136.96
|
881,090
103.78% of 50 DAV
50 DAV is 849,000
|
$138.25
-1.40%
|
11/19/2024
|
$134.41
|
PP = $136.23
|
|
MB = $143.04
|
Most Recent Note - 11/26/2024 7:08:33 PM
Y - Perched at its all-time high, encountering some distributional pressure. Subsequent volume-driven gains above the pivot point may trigger a proper technical buy signal. It was highlighted in yellow with pivot point cited based on its 10/15/24 high plus 10 cents. Found support recently at its 50 DMA line ($129.54).
>>> FEATURED STOCK ARTICLE : Tradeweb Markets Perched Near High - 11/19/2024 |
View all notes |
Set NEW NOTE alert |
Company Profile |
SEC
News |
Chart |
Request a new note
C
A
S
I |
Symbol/Exchange
Company Name
Industry Group |
PRICE |
CHANGE
(%Change) |
Day High |
Volume
(% DAV)
(% 50 day avg vol) |
52 Wk Hi
% From Hi |
Featured
Date |
Price
Featured |
Pivot Featured |
|
Max Buy |
|
|
|
THESE ARE NOT BUY RECOMMENDATIONS!
Comments contained in the body of this report are technical
opinions only. The material herein has been obtained
from sources believed to be reliable and accurate, however,
its accuracy and completeness cannot be guaranteed.
This site is not an investment advisor, hence it does
not endorse or recommend any securities or other investments.
Any recommendation contained in this report may not
be suitable for all investors and it is not to be deemed
an offer or solicitation on our part with respect to
the purchase or sale of any securities. All trademarks,
service marks and trade names appearing in this report
are the property of their respective owners, and are
likewise used for identification purposes only.
This report is a service available
only to active Paid Premium Members.
You may opt-out of receiving report notifications
at any time. Questions or comments may be submitted
by writing to Premium Membership Services 665 S.E. 10 Street, Suite 201 Deerfield Beach, FL 33441-5634 or by calling 1-800-965-8307
or 954-785-1121.
|
|
|