You are not logged in.
This means you
CAN ONLY VIEW reports that were published prior to Tuesday, April 15, 2025.
You
MUST UPGRADE YOUR MEMBERSHIP if you want to see any current reports.
AFTER MARKET UPDATE - FRIDAY, NOVEMBER 4TH, 2011
Previous After Market Report Next After Market Report >>>
|
|
|
|
DOW |
-61.23 |
11,983.24 |
-0.51% |
|
Volume |
861,482,670 |
-19% |
|
Volume |
1,881,498,120 |
-8% |
|
NASDAQ |
-11.82 |
2,686.15 |
-0.44% |
|
Advancers |
1,159 |
38% |
|
Advancers |
903 |
35% |
|
S&P 500 |
-7.92 |
1,253.23 |
-0.63% |
|
Decliners |
1,802 |
59% |
|
Decliners |
1,586 |
61% |
|
Russell 2000 |
-5.04 |
746.49 |
-0.67% |
|
52 Wk Highs |
38 |
|
|
52 Wk Highs |
34 |
|
|
S&P 600 |
-2.55 |
411.19 |
-0.62% |
|
52 Wk Lows |
16 |
|
|
52 Wk Lows |
42 |
|
|
 |
Major Averages Ended the Week Quietly Lower
Kenneth J. Gruneisen - Passed the CAN SLIM® Master's Exam
For the week, the Dow Jones Industrial Average fell -2.0%, S&P 500 Index lost -2.5%, and the Nasdaq Composite Index sank -1.9%. The major averages showed signs of fatigue after following through with solid volume-driven gains on Thursday, as Friday's trading volume totals were reported much lighter on the NYSE and on the Nasdaq exchange. Decliners led advancers by about a 3-2 margin on the NYSE and on the Nasdaq exchange. New 52-week lows still outnumbered new 52-week highs on the Nasdaq exchange, however new highs outnumbered new lows on the NYSE. There were 20 high-ranked companies from the CANSLIM.net Leaders List that made new 52-week highs and appeared on the CANSLIM.net BreakOuts Page, down from the prior session total of 28 stocks. There were gains for 6 of the 17 high-ranked companies currently included on the Featured Stocks Page.
The major averages ended the week on a down note following the G-20's failure to agree on boosting IMF funding for Europe's bailout. G-20 leaders decided to wait for more details on Europe's plan to combat its debt before committing more funds to the region's debt crisis. Focus remained on Europe as the Greek Prime Minister Papandreou faced a confidence vote in parliament. European markets reversed to trade lower.
News out of Euro zone offset a decline in U.S. unemployment rate to a six month low of 9.0%. An 80,000 increase in non-farm payrolls in October less than the 95,000 increase forecasted. Financial stocks led decliners with American International Group Inc (AIG -2.92%) falling after the insurer posted its largest loss since 2009. Starbucks Corp (SBUX +6.74%) rallied as earnings rose +29% in its most recent quarter. Chesapeake Energy (CHK -6.75%) sank even though the company posted an earning beat.
Groupon Inc (GRPN +30.55%) surged on its first day of trading as a public company. Bloomberg reported that the 3-year old company's market cap after its much-anticipated initial offering is actually greater than that of Alcoa, Inc. (AA +0.55%)
Our monthly newsletter CANSLIM.net News will be published soon with an informative review of current market conditions, leading groups, and best buy candidates. Via the Premium Member Homepage links to all prior reports and webcasts are always available.
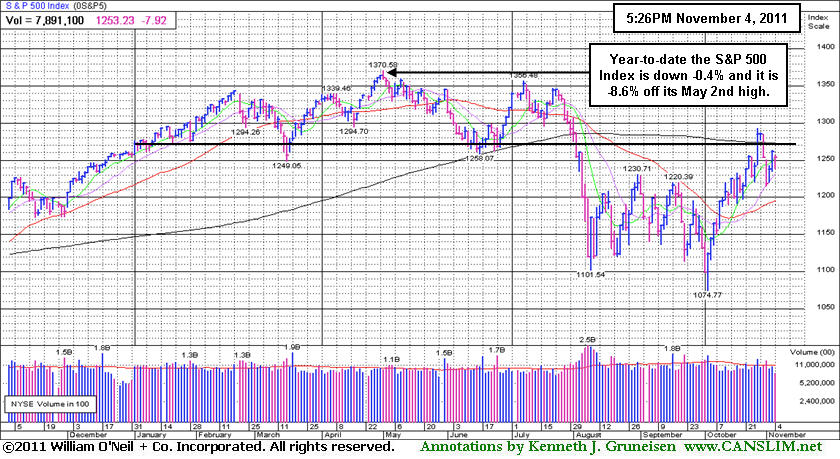
PICTURED: The S&P 500 Index's slump back under its 200-day moving average leaves it now -8.6% off its May 2nd high. Year-to-date the S&P 500 Index is down -0.4%, meanwhile the Dow is up +3.5%, and the Nasdaq is +1.25% higher.
|
 Kenneth J. Gruneisen started out as a licensed stockbroker in August 1987, a couple of months prior to the historic stock market crash that took the Dow Jones Industrial Average down -22.6% in a single day. He has published daily fact-based fundamental and technical analysis on high-ranked stocks online for two decades. Through FACTBASEDINVESTING.COM, Kenneth provides educational articles, news, market commentary, and other information regarding proven investment systems that work in good times and bad.
Comments contained in the body of this report are technical opinions only and are not necessarily those of Gruneisen Growth Corp. The material herein has been obtained from sources believed to be reliable and accurate, however, its accuracy and completeness cannot be guaranteed. Our firm, employees, and customers may effect transactions, including transactions contrary to any recommendation herein, or have positions in the securities mentioned herein or options with respect thereto. Any recommendation contained in this report may not be suitable for all investors and it is not to be deemed an offer or solicitation on our part with respect to the purchase or sale of any securities. |
|
 |
Financial Groups' Weakness Dragged Major Averages Lower
Kenneth J. Gruneisen - Passed the CAN SLIM® Master's Exam
The Bank Index ($BKX -1.50%) and Broker/Dealer Index ($XBD -1.03%) backpedaled and the Retail Index ($RLX -0.36%) also put a slightly negative drag on the major averages on Friday. The Healthcare Index ($HMO +0.90%) posted a gain. Commodity-linked groups were quiet as the Gold & Silver Index ($XAU -0.33%) inched lower and the Oil Services Index ($OSX +0.03%) and Integrated Oil Index ($XOI +0.20%) posted tiny gains. The tech sector was mixed with the Networking Index ($NWX -1.93%) losing ground and lagging while the Internet Index ($IIX +0.06%) finished flat and the Semiconductor Index ($SOX +1.12%) posted a small gain
Charts courtesy www.stockcharts.com
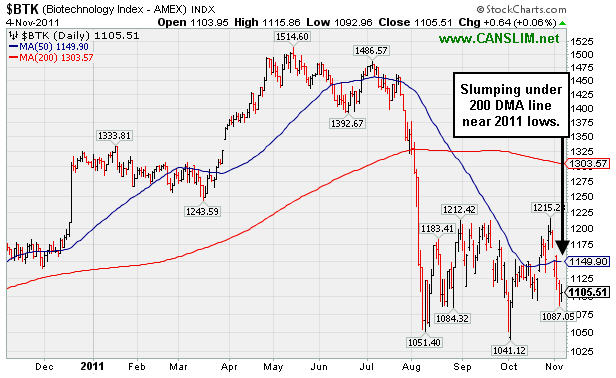
PICTURED: The Biotechnology Index ($BTK +0.06%) had a tough week, slumping under its 200-day moving average (DMA) line near its 2011 lows.
| Oil Services |
$OSX |
233.34 |
+0.07 |
+0.03% |
-4.81% |
| Healthcare |
$HMO |
2,224.18 |
+19.84 |
+0.90% |
+31.45% |
| Integrated Oil |
$XOI |
1,242.30 |
+2.43 |
+0.20% |
+2.40% |
| Semiconductor |
$SOX |
391.48 |
+4.33 |
+1.12% |
-4.94% |
| Networking |
$NWX |
241.16 |
-4.74 |
-1.93% |
-14.04% |
| Internet |
$IIX |
298.76 |
+0.18 |
+0.06% |
-2.91% |
| Broker/Dealer |
$XBD |
88.82 |
-0.92 |
-1.03% |
-26.90% |
| Retail |
$RLX |
538.93 |
-1.97 |
-0.36% |
+6.01% |
| Gold & Silver |
$XAU |
208.97 |
-0.69 |
-0.33% |
-7.77% |
| Bank |
$BKX |
39.50 |
-0.60 |
-1.50% |
-24.34% |
| Biotech |
$BTK |
1,105.51 |
+0.64 |
+0.06% |
-14.81% |
|
|
|
 |
Recent Damage Needs Repair For Outlook to Improve
Kenneth J. Gruneisen - Passed the CAN SLIM® Master's Exam
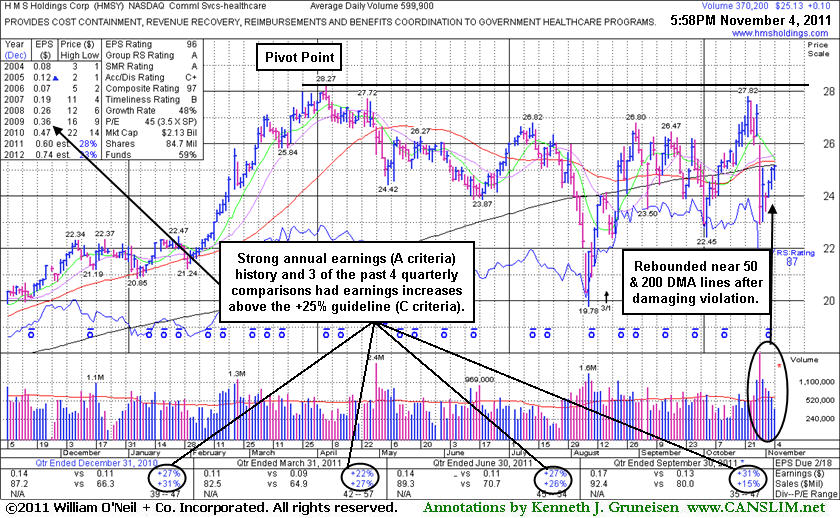
H M S Holdings Corp (HMSY +$0.10 or +0.40% to $25.13) posted a third consecutive small gain today with ever-lighter volume, finishing just below its 50-day and 200-day moving average (DMA) lines. Subsequent gains above those moving averages could help its outlook to improve, meanwhile it could continue to struggle. Disciplined investors will note that it did not trigger a technical buy signal after it was featured in yellow in the 10/27/11 mid-day report (read here) with pivot point based on its 52-week high plus 10 cents. Afterward it reported earnings +31% on +15% sales revenues for the quarter ended September 30, 2011 versus the year ago period, then gapped down and violated its 50 and 200 DMA lines raising concerns and triggering technical sell signals.
Its last appearance in this FSU section was on 5/23/11 with an annotated graph under the headline, "Volume Quiet While Sputtering Under 50-Day Average", and shortly thereafter it was dropped from the Featured Stocks list on 6/06/11. Later it slumped below its 200 DMA line and there was a 3:1 stock split (effective 8/17/11). It still has some work to do, repairing the recent technical damage. Disciplined investors may watch for gains above its 50 DMA and 200 DMA lines for its outlook to improve, meanwhile, volume-driven gains into new high ground could ultimately trigger a new buy signal. This Commercial Services - Healthcare firm has maintained a solid sales revenues and earnings growth history that still satisfies the C and A criteria. The number of top-rated funds owning its shares has risen from 488 in Jun '11 to 497 in Sep '11, a reassuring sign concerning the I criteria.
|
|
|
Color Codes Explained :
Y - Better candidates highlighted by our
staff of experts.
G - Previously featured
in past reports as yellow but may no longer be buyable under the
guidelines.
***Last / Change / Volume data in this table is the closing quote data***
Symbol/Exchange
Company Name
Industry Group |
PRICE |
CHANGE
(%Change) |
Day High |
Volume
(% DAV)
(% 50 day avg vol) |
52 Wk Hi
% From Hi |
Featured
Date |
Price
Featured |
Pivot Featured |
|
Max Buy |
AAPL
-
NASDAQ
Apple Inc
COMPUTER HARDWARE - Personal Computers
|
$400.24
|
-2.83
-0.70% |
$403.44
|
10,774,465
51.52% of 50 DAV
50 DAV is 20,912,200
|
$426.70
-6.20%
|
9/16/2011
|
$399.14
|
PP = $404.60
|
|
MB = $424.83
|
 Most Recent Note - 11/4/2011 6:25:07 PM
G - It has not formed a sound base pattern and ownership by top-rated funds has fallen some, as previously noted. Volume totals have recently been cooling while consolidating just above its 50 DMA line, and it is perched just -6.2% off its all-time high.
>>> The latest Featured Stock Update with an annotated graph appeared on 10/20/2011. Click here.
View all notes |
Alert me of new notes |
CANSLIM.net Company Profile |
SEC |
Zacks Reports |
StockTalk |
News |
Chart |
Request a new note
C
A N
S L
I M


|
ADS
-
NYSE
Alliance Data Sys Corp
COMPUTER SOFTWARE and SERVICES - Information and Delivery Service
|
$102.57
|
-0.18
-0.18% |
$103.34
|
671,793
70.32% of 50 DAV
50 DAV is 955,300
|
$107.18
-4.30%
|
10/21/2011
|
$97.94
|
PP = $101.15
|
|
MB = $106.21
|
Most Recent Note - 11/3/2011 2:37:50 PM
Y - Hit a new high today and briefly traded above its "max buy" level after gapping up. Reported earnings +39% on +20% sales revenues for the quarter ended September 30, 2011 versus the year ago period. Prior chart highs in the $101 define initial support to watch well above its 50 DMA line.
>>> The latest Featured Stock Update with an annotated graph appeared on 10/21/2011. Click here.
View all notes |
Alert me of new notes |
CANSLIM.net Company Profile |
SEC |
Zacks Reports |
StockTalk |
News |
Chart |
Request a new note
C
A N
S L
I M
|
ALXN
-
NASDAQ
Alexion Pharmaceuticals
DRUGS - Drug Manufacturers - Other
|
$66.04
|
+0.84
1.29% |
$66.42
|
1,058,657
69.76% of 50 DAV
50 DAV is 1,517,500
|
$70.42
-6.22%
|
9/15/2011
|
$63.20
|
PP = $60.81
|
|
MB = $63.85
|
Most Recent Note - 11/4/2011 6:27:08 PM
G - Small gain today, quietly consolidating above its 50 DMA line previously noted as chart support to watch on pullbacks. A violation of that important short-term average line would raise concerns and trigger a technical sell signal.
>>> The latest Featured Stock Update with an annotated graph appeared on 10/18/2011. Click here.
View all notes |
Alert me of new notes |
CANSLIM.net Company Profile |
SEC |
Zacks Reports |
StockTalk |
News |
Chart |
Request a new note
C
A N
S L
I M
|
CELG
-
NASDAQ
Celgene Corp
DRUGS - Drug Manufacturers - Major
|
$63.73
|
-0.41
-0.64% |
$64.03
|
2,448,501
63.51% of 50 DAV
50 DAV is 3,855,100
|
$68.25
-6.62%
|
9/16/2011
|
$61.21
|
PP = $62.59
|
|
MB = $65.72
|
Most Recent Note - 11/4/2011 6:28:08 PM
Y - Quietly consolidating just above its 50 DMA line which defines important near-term chart support to watch, and a violation would raise concerns and trigger a technical sell signal.
>>> The latest Featured Stock Update with an annotated graph appeared on 10/14/2011. Click here.
View all notes |
Alert me of new notes |
CANSLIM.net Company Profile |
SEC |
Zacks Reports |
StockTalk |
News |
Chart |
Request a new note
C
A N
S L
I M
|
CEVA
-
NASDAQ
Ceva Inc
ELECTRONICS - Semiconductor - Specialized
|
$31.78
|
+0.08
0.25% |
$32.00
|
228,393
95.96% of 50 DAV
50 DAV is 238,000
|
$35.60
-10.73%
|
10/28/2011
|
$34.38
|
PP = $35.70
|
|
MB = $37.49
|
Most Recent Note - 11/3/2011 2:09:26 PM
Y - Consolidating above prior highs since its gap up on 10/27/11 helped it break out of a "double bottom" base pattern after reporting earnings +86% on +39% sales revenues for the quarter ended September 30, 2011 versus the year ago period. It had slumped below its 200 DMA line during its consolidation since dropped from the Featured Stocks list on 6/17/11. In the 10/28/11 mid-day report (read here) it was featured again in yellow with pivot point based on its 52-week high plus 10 cents while rallying "straight up from the bottom" of a 22-week cup shaped base. It has encountered distributional pressure since, while volume-driven gains above its pivot point are needed to trigger a new (or add-on) technical buy signal. See the latest FSU analysis for more details and a new annotated graph.
>>> The latest Featured Stock Update with an annotated graph appeared on 11/2/2011. Click here.
View all notes |
Alert me of new notes |
CANSLIM.net Company Profile |
SEC |
Zacks Reports |
StockTalk |
News |
Chart |
Request a new note
C
A N
S L
I M
|
Symbol/Exchange
Company Name
Industry Group |
PRICE |
CHANGE
(%Change) |
Day High |
Volume
(% DAV)
(% 50 day avg vol) |
52 Wk Hi
% From Hi |
Featured
Date |
Price
Featured |
Pivot Featured |
|
Max Buy |
FEIC
-
NASDAQ
F E I Co
ELECTRONICS - Diversified Electronics
|
$40.25
|
-0.44
-1.08% |
$40.99
|
331,914
75.94% of 50 DAV
50 DAV is 437,100
|
$42.25
-4.73%
|
10/28/2011
|
$40.31
|
PP = $40.88
|
|
MB = $42.92
|
Most Recent Note - 11/3/2011 2:23:40 PM
Y - Consolidating near its 52-week high since its considerable gain on 10/28/11 triggered a technical buy signal. Disciplined investors limit losses and always sell if a stock falls -7% from their purchase price. If strength returns a stock can always be bought back.
>>> The latest Featured Stock Update with an annotated graph appeared on 10/28/2011. Click here.
View all notes |
Alert me of new notes |
CANSLIM.net Company Profile |
SEC |
Zacks Reports |
StockTalk |
News |
Chart |
Request a new note
C
A N
S L
I M
|
GNC
-
NYSE
G N C Holdings Inc
RETAIL - Drug Stores
|
$26.37
|
-0.25
-0.94% |
$26.64
|
829,033
65.83% of 50 DAV
50 DAV is 1,259,400
|
$27.13
-2.80%
|
10/26/2011
|
$24.60
|
PP = $24.80
|
|
MB = $26.04
|
Most Recent Note - 11/4/2011 6:29:37 PM
G - Hovering near its 52-week high, slightly extended from its prior base. Recent chart lows (near $23.80) define near term support to watch above its 50 DMA line.
>>> The latest Featured Stock Update with an annotated graph appeared on 10/26/2011. Click here.
View all notes |
Alert me of new notes |
CANSLIM.net Company Profile |
SEC |
Zacks Reports |
StockTalk |
News |
Chart |
Request a new note
C
A N
S L
I M
|
HMSY
-
NASDAQ
H M S Holdings Corp
COMPUTER SOFTWARE and SERVICES - Healthcare Information Service
|
$25.13
|
+0.10
0.40% |
$25.17
|
370,245
61.72% of 50 DAV
50 DAV is 599,900
|
$28.25
-11.03%
|
10/27/2011
|
$26.44
|
PP = $28.37
|
|
MB = $29.79
|
Most Recent Note - 11/4/2011 6:31:01 PM
G - Today's 3rd consecutive gain came with lighter volume. It remains below its 50 and 200 DMA lines and needs gains above those moving averages for its outlook to improve. See the latest FSU analysis for more details and a new annotated graph.
>>> The latest Featured Stock Update with an annotated graph appeared on 11/4/2011. Click here.
View all notes |
Alert me of new notes |
CANSLIM.net Company Profile |
SEC |
Zacks Reports |
StockTalk |
News |
Chart |
Request a new note
C
A N
S L
I M
|
ISRG
-
NASDAQ
Intuitive Surgical Inc
HEALTH SERVICES - Medical Appliances and Equipment
|
$432.23
|
-5.12
-1.17% |
$437.25
|
222,533
50.85% of 50 DAV
50 DAV is 437,600
|
$443.00
-2.43%
|
10/19/2011
|
$424.69
|
PP = $415.29
|
|
MB = $436.05
|
Most Recent Note - 11/4/2011 6:32:32 PM
Y - Small loss today on light volume, edging below its "max buy" level, and its color code is changed to yellow again. Prior highs define important support to watch on pullbacks.
>>> The latest Featured Stock Update with an annotated graph appeared on 10/19/2011. Click here.
View all notes |
Alert me of new notes |
CANSLIM.net Company Profile |
SEC |
Zacks Reports |
StockTalk |
News |
Chart |
Request a new note
C
A N
S L
I M
|
LABL
-
NASDAQ
Multi Color Corp
CONSUMER NON-DURABLES - Packaging and Containers
|
$27.02
|
-0.37
-1.35% |
$27.14
|
11,912
23.54% of 50 DAV
50 DAV is 50,600
|
$28.00
-3.50%
|
10/17/2011
|
$27.81
|
PP = $28.10
|
|
MB = $29.51
|
Most Recent Note - 11/3/2011 2:26:49 PM
Y - Quietly hovering only -3.6% off its 52-week high. Subsequent volume-driven gains into new high ground may trigger a technical buy signal. Recent lows near its 50 DMA line define near-term support to watch where any violation would raise concerns. Due to report earnings on Tuesday, November 8th before the opening bell.
>>> The latest Featured Stock Update with an annotated graph appeared on 10/17/2011. Click here.
View all notes |
Alert me of new notes |
CANSLIM.net Company Profile |
SEC |
Zacks Reports |
StockTalk |
News |
Chart |
Request a new note
C
A N
S L
I M
|
Symbol/Exchange
Company Name
Industry Group |
PRICE |
CHANGE
(%Change) |
Day High |
Volume
(% DAV)
(% 50 day avg vol) |
52 Wk Hi
% From Hi |
Featured
Date |
Price
Featured |
Pivot Featured |
|
Max Buy |
MG
-
NYSE
Mistras Group Inc
DIVERSIFIED SERVICES - Bulding and Faci;ity Management Services
|
$22.14
|
-0.75
-3.28% |
$22.42
|
140,052
65.11% of 50 DAV
50 DAV is 215,100
|
$23.51
-5.83%
|
10/28/2011
|
$22.49
|
PP = $23.61
|
|
MB = $24.79
|
Most Recent Note - 11/4/2011 6:34:29 PM
Y - Gapped down today, quietly finishing the week -5.8% off its all-time high. A subsequent breakout on heavy volume may trigger a new (or add-on) buy signal. Prior highs in the $20-21 area define initial chart support to watch above its 50 DMA line.
>>> The latest Featured Stock Update with an annotated graph appeared on 10/12/2011. Click here.
View all notes |
Alert me of new notes |
CANSLIM.net Company Profile |
SEC |
Zacks Reports |
StockTalk |
News |
Chart |
Request a new note
C
A N
S L
I M
|
MKTX
-
NASDAQ
Marketaxess Holdings Inc
FINANCIAL SERVICES - Investment Brokerage - Nationa
|
$28.40
|
-2.61
-8.42% |
$29.61
|
415,731
172.65% of 50 DAV
50 DAV is 240,800
|
$31.45
-9.70%
|
10/28/2011
|
$29.79
|
PP = $31.05
|
|
MB = $32.60
|
Most Recent Note - 11/4/2011 9:50:10 AM
Y - Gapped down today for a considerable loss. On the prior session it touched a new 52-week high and traded above its pivot point, then closed below the mark while volume backing its gain was just +21% above average. The minimum guideline requires at least +40% above average volume behind a gain above a stock's pivot point to trigger a proper new (or add-on) technical buy signal. Disciplined investors may use a tactic called pyramiding to accumulate shares without chasing the stock outside of the ideal buy range.
>>> The latest Featured Stock Update with an annotated graph appeared on 10/31/2011. Click here.
View all notes |
Alert me of new notes |
CANSLIM.net Company Profile |
SEC |
Zacks Reports |
StockTalk |
News |
Chart |
Request a new note
C
A N
S L
I M
|
OPNT
-
NASDAQ
Opnet Technologies
INTERNET - Internet Software and Services
|
$46.71
|
+0.99
2.17% |
$46.90
|
1,685,709
870.72% of 50 DAV
50 DAV is 193,600
|
$45.92
1.73%
|
10/11/2011
|
$38.45
|
PP = $42.02
|
|
MB = $44.12
|
Most Recent Note - 11/4/2011 6:36:27 PM
G - Today's 3rd consecutive gain with above average volume lifted it further from its prior base. Previous highs in the $41 area define near-term chart support to watch on pullbacks. Due to report earnings on Wednesday, November 9th.
>>> The latest Featured Stock Update with an annotated graph appeared on 10/25/2011. Click here.
View all notes |
Alert me of new notes |
CANSLIM.net Company Profile |
SEC |
Zacks Reports |
StockTalk |
News |
Chart |
Request a new note
C
A N
S L
I M
|
OSIS
-
NASDAQ
O S I Systems Inc
ELECTRONICS - Semiconductor Equipment and Mate
|
$45.58
|
+0.38
0.84% |
$45.68
|
99,968
65.86% of 50 DAV
50 DAV is 151,800
|
$45.57
0.02%
|
11/1/2011
|
$42.07
|
PP = $45.57
|
|
MB = $47.85
|
Most Recent Note - 11/4/2011 6:39:19 PM
Y - Touched a new 52-week high (N criteria) today, however the volume was lighter than average, not indicative of great institutional (I criteria) buying demand. Volume-driven gains above its pivot point may trigger a technical buy signal. See the latest FSU analysis for more details and an annotated graph.
>>> The latest Featured Stock Update with an annotated graph appeared on 11/1/2011. Click here.
View all notes |
Alert me of new notes |
CANSLIM.net Company Profile |
SEC |
Zacks Reports |
StockTalk |
News |
Chart |
Request a new note
C
A N
S L
I M
|
SWI
-
NYSE
Solarwinds Inc
COMPUTER SOFTWARE and SERVICES - Application Software
|
$28.88
|
+0.13
0.45% |
$29.00
|
832,583
73.04% of 50 DAV
50 DAV is 1,139,900
|
$29.50
-2.10%
|
10/27/2011
|
$27.78
|
PP = $25.62
|
|
MB = $26.90
|
Most Recent Note - 11/4/2011 6:41:16 PM
G - Small gain on light volume today helped it rise to its best close ever. It is extended from its previous base pattern. Prior highs in the $25-26 area define initial chart support to watch on pullbacks.
>>> The latest Featured Stock Update with an annotated graph appeared on 10/27/2011. Click here.
View all notes |
Alert me of new notes |
CANSLIM.net Company Profile |
SEC |
Zacks Reports |
StockTalk |
News |
Chart |
Request a new note
C
A N
S L
I M
|
Symbol/Exchange
Company Name
Industry Group |
PRICE |
CHANGE
(%Change) |
Day High |
Volume
(% DAV)
(% 50 day avg vol) |
52 Wk Hi
% From Hi |
Featured
Date |
Price
Featured |
Pivot Featured |
|
Max Buy |
UA
-
NYSE
Under Armour Inc Cl A
CONSUMER NON-DURABLES - Textile - Apparel Clothing
|
$84.30
|
-1.46
-1.70% |
$85.75
|
789,187
55.53% of 50 DAV
50 DAV is 1,421,100
|
$87.40
-3.55%
|
10/25/2011
|
$82.43
|
PP = $80.80
|
|
MB = $84.84
|
Most Recent Note - 11/4/2011 6:42:54 PM
Y - Small loss on light volume led to a close below its "max buy" level and its color code is changed to yellow again. No resistance remains due to overhead supply following its recent spurt of volume-driven gains. Prior highs near $80 define initial support above its 50 DMA line.
>>> The latest Featured Stock Update with an annotated graph appeared on 11/3/2011. Click here.
View all notes |
Alert me of new notes |
CANSLIM.net Company Profile |
SEC |
Zacks Reports |
StockTalk |
News |
Chart |
Request a new note
C
A N
S L
I M
|
V
-
NYSE
Visa Inc Cl A
DIVERSIFIED SERVICES - Business/Management Services
|
$92.64
|
-0.54
-0.58% |
$93.63
|
3,402,086
63.03% of 50 DAV
50 DAV is 5,397,600
|
$95.87
-3.37%
|
10/24/2011
|
$94.21
|
PP = $94.85
|
|
MB = $99.59
|
Most Recent Note - 11/4/2011 6:44:31 PM
Y - Quietly hovering within close striking distance of its 52-week high. It did not trigger a proper new technical buy signal since recently highlighted in yellow as an ideal looking set-up. Its 50 DMA line defines near-term chart support to watch.
>>> The latest Featured Stock Update with an annotated graph appeared on 10/24/2011. Click here.
View all notes |
Alert me of new notes |
CANSLIM.net Company Profile |
SEC |
Zacks Reports |
StockTalk |
News |
Chart |
Request a new note
C
A N
S L
I M
|
|
|
|
THESE ARE NOT BUY RECOMMENDATIONS!
Comments contained in the body of this report are technical
opinions only. The material herein has been obtained
from sources believed to be reliable and accurate, however,
its accuracy and completeness cannot be guaranteed.
This site is not an investment advisor, hence it does
not endorse or recommend any securities or other investments.
Any recommendation contained in this report may not
be suitable for all investors and it is not to be deemed
an offer or solicitation on our part with respect to
the purchase or sale of any securities. All trademarks,
service marks and trade names appearing in this report
are the property of their respective owners, and are
likewise used for identification purposes only.
This report is a service available
only to active Paid Premium Members.
You may opt-out of receiving report notifications
at any time. Questions or comments may be submitted
by writing to Premium Membership Services 665 S.E. 10 Street, Suite 201 Deerfield Beach, FL 33441-5634 or by calling 1-800-965-8307
or 954-785-1121.
|
|
|

