You are not logged in.
This means you
CAN ONLY VIEW reports that were published prior to Tuesday, April 15, 2025.
You
MUST UPGRADE YOUR MEMBERSHIP if you want to see any current reports.
AFTER MARKET UPDATE - THURSDAY, NOVEMBER 3RD, 2011
Previous After Market Report Next After Market Report >>>
|
|
|
|
DOW |
+208.43 |
12,044.47 |
+1.76% |
|
Volume |
1,060,404,560 |
+11% |
|
Volume |
2,054,868,060 |
+9% |
|
NASDAQ |
+57.99 |
2,697.97 |
+2.20% |
|
Advancers |
2,345 |
76% |
|
Advancers |
1,877 |
71% |
|
S&P 500 |
+23.25 |
1,261.15 |
+1.88% |
|
Decliners |
677 |
22% |
|
Decliners |
662 |
25% |
|
Russell 2000 |
+18.27 |
751.53 |
+2.49% |
|
52 Wk Highs |
48 |
|
|
52 Wk Highs |
40 |
|
|
S&P 600 |
+9.44 |
413.74 |
+2.33% |
|
52 Wk Lows |
14 |
|
|
52 Wk Lows |
50 |
|
|
 |
Major Average Follow Through With Gains on Higher Volume
Kenneth J. Gruneisen - Passed the CAN SLIM® Master's Exam
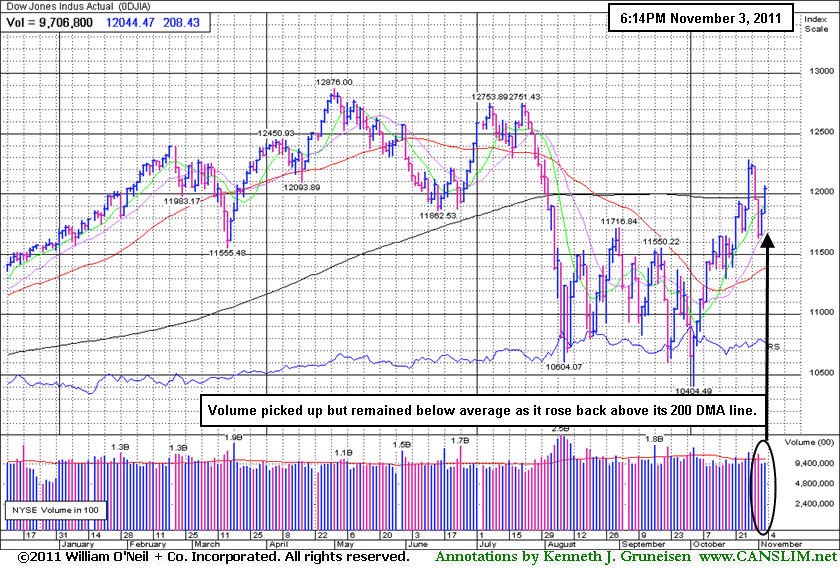
The major averages followed through with solid gains on Thursday while the trading volume totals were reported higher on the NYSE and on the Nasdaq exchange. That indicated a reassuring pick up in buying demand from institutional investors. Advancers led decliners by more than 3-1 on the NYSE and nearly 3-1 on the Nasdaq exchange. New 52-week lows still outnumbered new 52-week highs on the Nasdaq exchange, however new highs easily outnumbered new lows on the NYSE. Leadership also provided a reassuring expansion to 28 high-ranked companies from the CANSLIM.net Leaders List that made new 52-week highs and appeared on the CANSLIM.net BreakOuts Page, up from the prior session total of 12 stocks. There were gains for 16 of the 17 high-ranked companies currently included on the Featured Stocks Page.
The major averages benefited from a positive bias after the European Central Bank unexpectedly cut interest rates and pressure mounted for Greece to accept the bailout plan. New ECB head Mario Draghi surprised the market by lowering the region's benchmark rate to 1.25% from 1.5%. Stocks retreated briefly after he warned Europe was headed for a mild recession. Markets recovered amid reports Greece had scrapped its referendum vote on the bailout.
Thursday's economic releases were generally positive for the market. Initial jobless claims totaled 397,000 in the latest week, lower than the 402,000 consensus estimate. A separate report showed the service sector expanded in October, albeit at a slower pace than forecasted.
Qualcomm Inc (QCOM +7.53%) rallied on positive earnings. Shares of CVS Caremark Corp (CVS +4.31%) and Kraft Foods (KFT +3.29%) both rose on their better than expected results. However, Kellogg Company (K -7.64%) fell after posting disappointing earnings. Este Lauder Companies Inc (EL +17.94%) jumped after the cosmetics company announced a 2-1 stock split and dividend increase of 40%. Jefferies Group Inc (JEF -2.2%) finished in the upper third of its intra-day range following a great rebound after trading down as much as -20% after Egan-Jones lowered its credit rating on the broker citing concerns of its exposure sovereign debt obligations.
Our monthly newsletter CANSLIM.net News will be published soon with an informative review of current market conditions, leading groups, and best buy candidates. Via the Premium Member Homepage links to all prior reports and webcasts are always available.
PICTURED: The Dow Jones Industrial Average's gain helped it close back above its 200-day moving average (DMA) line. Volume picked up but remained below average behind the gain following losses on higher volume.
|
 Kenneth J. Gruneisen started out as a licensed stockbroker in August 1987, a couple of months prior to the historic stock market crash that took the Dow Jones Industrial Average down -22.6% in a single day. He has published daily fact-based fundamental and technical analysis on high-ranked stocks online for two decades. Through FACTBASEDINVESTING.COM, Kenneth provides educational articles, news, market commentary, and other information regarding proven investment systems that work in good times and bad.
Comments contained in the body of this report are technical opinions only and are not necessarily those of Gruneisen Growth Corp. The material herein has been obtained from sources believed to be reliable and accurate, however, its accuracy and completeness cannot be guaranteed. Our firm, employees, and customers may effect transactions, including transactions contrary to any recommendation herein, or have positions in the securities mentioned herein or options with respect thereto. Any recommendation contained in this report may not be suitable for all investors and it is not to be deemed an offer or solicitation on our part with respect to the purchase or sale of any securities. |
|
 |
Financial, Retail, Energy, Defensive, and Most Tech Groups Rose
Kenneth J. Gruneisen - Passed the CAN SLIM® Master's Exam
Financial shares rose and boosted the Broker/Dealer Index ($XBD +1.81%) and Bank Index ($BKX +1.83%), and strength in the Retail Index ($RLX +1.14%) also had a positive influence on the major averages on Thursday. Energy-related shares traded up and the Integrated Oil Index ($XOI +2.20%) and Oil Services Index ($OSX +2.58%) posted solid gains. Defensive groups also were on the rise as the Healthcare Index ($HMO +0.82%) and Gold & Silver Index ($XAU +2.87%) tallied gains. The Semiconductor Index ($SOX +3.00%) and the Networking Index ($NWX +3.07%) led the tech sector, followed by the Internet Index ($IIX +2.55%), meanwhile the Biotechnology Index ($BTK -1.84%) was a clear laggard as it lost ground on the widely positive session.
Charts courtesy www.stockcharts.com
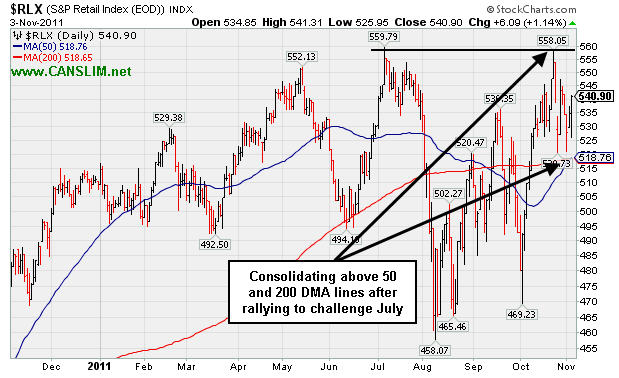
PICTURED: The Retail Index ($RLX +1.14%) is consolidating above 50 and 200 DMA lines after rallying to challenge July highs.
| Oil Services |
$OSX |
233.27 |
+5.87 |
+2.58% |
-4.83% |
| Healthcare |
$HMO |
2,204.34 |
+17.83 |
+0.82% |
+30.28% |
| Integrated Oil |
$XOI |
1,239.87 |
+26.65 |
+2.20% |
+2.20% |
| Semiconductor |
$SOX |
387.15 |
+11.27 |
+3.00% |
-5.99% |
| Networking |
$NWX |
245.90 |
+7.33 |
+3.07% |
-12.35% |
| Internet |
$IIX |
298.59 |
+7.44 |
+2.55% |
-2.97% |
| Broker/Dealer |
$XBD |
89.74 |
+1.60 |
+1.81% |
-26.15% |
| Retail |
$RLX |
540.90 |
+6.09 |
+1.14% |
+6.40% |
| Gold & Silver |
$XAU |
209.66 |
+5.85 |
+2.87% |
-7.47% |
| Bank |
$BKX |
40.10 |
+0.72 |
+1.83% |
-23.19% |
| Biotech |
$BTK |
1,104.86 |
-20.67 |
-1.84% |
-14.85% |
|
|
|
 |
Found Support Near Pivot Point After Volume-Driven Breakout
Kenneth J. Gruneisen - Passed the CAN SLIM® Master's Exam
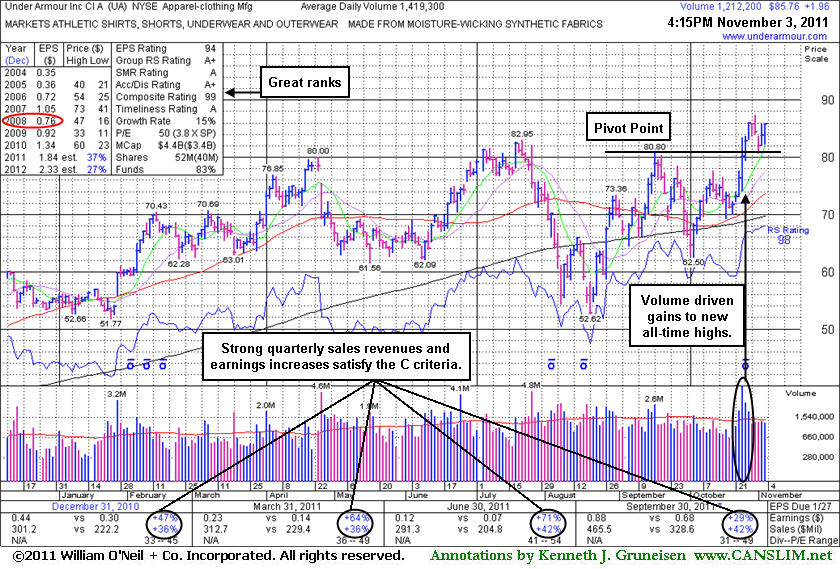
Under Armour Inc (UA +$1.96 or +2.34% to $85.76) finished near the session high today with a gain on lighter volume leaving it perched near its all-time high. No resistance remains due to overhead supply following its recent spurt of volume-driven gains. Prior highs near $80 define initial support to watch above its 50-day moving average (DMA) line. The high-ranked Apparel - Clothing Manufacturing firm was highlighted in yellow in the 10/25/11 mid-day report (read here) with an annotated graph illustrating its volume-driven breakout from a "reverse-head-and-shoulders" base pattern. After it got extended from the prior base its color code was change to green on 10/27/11. Then, its color code was changed to yellow again on 10/31/11 after an ordinary pullback on light volume, a healthy retreat which allowed disciplined investors to accumulate shares without chasing the stock above the pivot point by more than +5% or the "max buy" price referred to in CANSLIM.net reports. Today's strong close led to a finish above the "max buy" level, so its color code was changed to green after again getting extended from its prior base. Approximately 40% of successful breakouts pullback and test support near prior highs before going on to produce more substantial gains.
Earlier, UA did not confirm a proper technical buy signal after it had been featured in yellow in the 7/19/11 mid-day report, and its last appearance in this FSU section was on 7/26/11 with an annotated graph under the headline, "Confirming Gains Did Not Trigger Fresh Buy Signal." On August 2nd it was noted -"Down today on average volume, violating its 50 DMA line and raising concerns. UA did not confirm a proper technical buy signal since recently featured in yellow, and based on its damaging slump to a finish -16.6% off its 52-week high it will be dropped from the Featured Stocks list tonight." Additional losses on heavy volume followed, leading to a much deeper pullback below its 200 DMA line before support arrived and fresh buying demand soon lifted the shares back above its long-term and short-term moving averages, helping its outlook. Volume-driven gains during its rebound were bullish signs of heavy new institutional buying demand, a very reassuring characteristic when considering new buying efforts in any stock.
UA reported earnings +29% on +42% sales revenues for the quarter ended September 30, 2011 versus the year ago period. The number of top-rated funds owning its shares rose from 308 in Mar '10 to 442 in Sep '11, a reassuring trend concerning the I criteria. Earlier notes had acknowledged the downward turn in annual earnings (A criteria) in FY '08, a concern with respect to the fact-based investment system (see red oval).
|
|
|
Color Codes Explained :
Y - Better candidates highlighted by our
staff of experts.
G - Previously featured
in past reports as yellow but may no longer be buyable under the
guidelines.
***Last / Change / Volume data in this table is the closing quote data***
Symbol/Exchange
Company Name
Industry Group |
PRICE |
CHANGE
(%Change) |
Day High |
Volume
(% DAV)
(% 50 day avg vol) |
52 Wk Hi
% From Hi |
Featured
Date |
Price
Featured |
Pivot Featured |
|
Max Buy |
AAPL
-
NASDAQ
Apple Inc
COMPUTER HARDWARE - Personal Computers
|
$403.07
|
+5.66
1.42% |
$403.40
|
15,754,666
74.87% of 50 DAV
50 DAV is 21,044,100
|
$426.70
-5.54%
|
9/16/2011
|
$399.14
|
PP = $404.60
|
|
MB = $424.83
|
Most Recent Note - 11/2/2011 5:40:52 PM
G - It has not formed a sound base pattern and ownership by top-rated funds has fallen some, as previously noted. Volume totals have recently been cooling while consolidating just above its 50 DMA line, and it is perched just -6.9% off its all-time high after a tiny gain on light volume today.
>>> The latest Featured Stock Update with an annotated graph appeared on 10/20/2011. Click here.
View all notes |
Alert me of new notes |
CANSLIM.net Company Profile |
SEC |
Zacks Reports |
StockTalk |
News |
Chart |
Request a new note
C
A N
S L
I M


|
ADS
-
NYSE
Alliance Data Sys Corp
COMPUTER SOFTWARE and SERVICES - Information and Delivery Service
|
$102.75
|
+1.35
1.33% |
$107.18
|
812,267
85.05% of 50 DAV
50 DAV is 955,100
|
$105.67
-2.76%
|
10/21/2011
|
$97.94
|
PP = $101.15
|
|
MB = $106.21
|
 Most Recent Note - 11/3/2011 2:37:50 PM
Y - Hit a new high today and briefly traded above its "max buy" level after gapping up. Reported earnings +39% on +20% sales revenues for the quarter ended September 30, 2011 versus the year ago period. Prior chart highs in the $101 define initial support to watch well above its 50 DMA line.
>>> The latest Featured Stock Update with an annotated graph appeared on 10/21/2011. Click here.
View all notes |
Alert me of new notes |
CANSLIM.net Company Profile |
SEC |
Zacks Reports |
StockTalk |
News |
Chart |
Request a new note
C
A N
S L
I M
|
ALXN
-
NASDAQ
Alexion Pharmaceuticals
DRUGS - Drug Manufacturers - Other
|
$65.20
|
-0.91
-1.38% |
$67.05
|
1,085,215
70.88% of 50 DAV
50 DAV is 1,531,000
|
$70.42
-7.41%
|
9/15/2011
|
$63.20
|
PP = $60.81
|
|
MB = $63.85
|
Most Recent Note - 11/2/2011 5:45:05 PM
G - Quietly held its ground today, quietly consolidating above its 50 DMA line previously noted as chart support to watch on pullbacks. A violation of that important short-term average line would raise concerns and trigger a technical sell signal.
>>> The latest Featured Stock Update with an annotated graph appeared on 10/18/2011. Click here.
View all notes |
Alert me of new notes |
CANSLIM.net Company Profile |
SEC |
Zacks Reports |
StockTalk |
News |
Chart |
Request a new note
C
A N
S L
I M
|
CELG
-
NASDAQ
Celgene Corp
DRUGS - Drug Manufacturers - Major
|
$64.14
|
+0.35
0.55% |
$64.50
|
3,138,396
81.54% of 50 DAV
50 DAV is 3,849,000
|
$68.25
-6.02%
|
9/16/2011
|
$61.21
|
PP = $62.59
|
|
MB = $65.72
|
Most Recent Note - 11/2/2011 5:47:33 PM
Y - Quietly held its ground today following a gap down on the prior session. Its 50 DMA line defines important near-term chart support to watch, and a violation would raise concerns and trigger a technical sell signal.
>>> The latest Featured Stock Update with an annotated graph appeared on 10/14/2011. Click here.
View all notes |
Alert me of new notes |
CANSLIM.net Company Profile |
SEC |
Zacks Reports |
StockTalk |
News |
Chart |
Request a new note
C
A N
S L
I M
|
CEVA
-
NASDAQ
Ceva Inc
ELECTRONICS - Semiconductor - Specialized
|
$31.70
|
+1.63
5.42% |
$31.71
|
267,541
112.93% of 50 DAV
50 DAV is 236,900
|
$35.60
-10.96%
|
10/28/2011
|
$34.38
|
PP = $35.70
|
|
MB = $37.49
|
Most Recent Note - 11/3/2011 2:09:26 PM
Y - Consolidating above prior highs since its gap up on 10/27/11 helped it break out of a "double bottom" base pattern after reporting earnings +86% on +39% sales revenues for the quarter ended September 30, 2011 versus the year ago period. It had slumped below its 200 DMA line during its consolidation since dropped from the Featured Stocks list on 6/17/11. In the 10/28/11 mid-day report (read here) it was featured again in yellow with pivot point based on its 52-week high plus 10 cents while rallying "straight up from the bottom" of a 22-week cup shaped base. It has encountered distributional pressure since, while volume-driven gains above its pivot point are needed to trigger a new (or add-on) technical buy signal. See the latest FSU analysis for more details and a new annotated graph.
>>> The latest Featured Stock Update with an annotated graph appeared on 11/2/2011. Click here.
View all notes |
Alert me of new notes |
CANSLIM.net Company Profile |
SEC |
Zacks Reports |
StockTalk |
News |
Chart |
Request a new note
C
A N
S L
I M
|
Symbol/Exchange
Company Name
Industry Group |
PRICE |
CHANGE
(%Change) |
Day High |
Volume
(% DAV)
(% 50 day avg vol) |
52 Wk Hi
% From Hi |
Featured
Date |
Price
Featured |
Pivot Featured |
|
Max Buy |
FEIC
-
NASDAQ
F E I Co
ELECTRONICS - Diversified Electronics
|
$40.69
|
+1.56
3.99% |
$40.75
|
314,794
71.24% of 50 DAV
50 DAV is 441,900
|
$42.25
-3.69%
|
10/28/2011
|
$40.31
|
PP = $40.88
|
|
MB = $42.92
|
Most Recent Note - 11/3/2011 2:23:40 PM
Y - Consolidating near its 52-week high since its considerable gain on 10/28/11 triggered a technical buy signal. Disciplined investors limit losses and always sell if a stock falls -7% from their purchase price. If strength returns a stock can always be bought back.
>>> The latest Featured Stock Update with an annotated graph appeared on 10/28/2011. Click here.
View all notes |
Alert me of new notes |
CANSLIM.net Company Profile |
SEC |
Zacks Reports |
StockTalk |
News |
Chart |
Request a new note
C
A N
S L
I M
|
GNC
-
NYSE
G N C Holdings Inc
RETAIL - Drug Stores
|
$26.62
|
+0.68
2.62% |
$27.13
|
2,060,302
168.01% of 50 DAV
50 DAV is 1,226,300
|
$26.48
0.53%
|
10/26/2011
|
$24.60
|
PP = $24.80
|
|
MB = $26.04
|
Most Recent Note - 11/3/2011 12:30:59 PM
G - Hit a new 52-week high today and rose above its "max buy" level. Color code is changed to green after getting extended from its prior base. Recent chart lows (near $23.80) define near term support to watch above its 50 DMA line.
>>> The latest Featured Stock Update with an annotated graph appeared on 10/26/2011. Click here.
View all notes |
Alert me of new notes |
CANSLIM.net Company Profile |
SEC |
Zacks Reports |
StockTalk |
News |
Chart |
Request a new note
C
A N
S L
I M
|
HMSY
-
NASDAQ
H M S Holdings Corp
COMPUTER SOFTWARE and SERVICES - Healthcare Information Service
|
$25.03
|
+0.50
2.04% |
$25.10
|
582,216
96.83% of 50 DAV
50 DAV is 601,300
|
$28.25
-11.38%
|
10/27/2011
|
$26.44
|
PP = $28.37
|
|
MB = $29.79
|
Most Recent Note - 11/2/2011 5:56:37 PM
G - Posted a gain today with above average volume but it remains below its 50 and 200 DMA lines and needs gains above those moving averages for its outlook to improve. Last week it reported earnings +31% on +15% sales revenues for the quarter ended September 30, 2011 versus the year ago period, then it gapped down and violated its 50 and 200 DMA lines raising concerns and triggering technical sell signals. Disciplined investors will note that it did not trigger a technical buy signal.
>>> The latest Featured Stock Update with an annotated graph appeared on 5/23/2011. Click here.
View all notes |
Alert me of new notes |
CANSLIM.net Company Profile |
SEC |
Zacks Reports |
StockTalk |
News |
Chart |
Request a new note
C
A N
S L
I M
|
ISRG
-
NASDAQ
Intuitive Surgical Inc
HEALTH SERVICES - Medical Appliances and Equipment
|
$437.35
|
+10.25
2.40% |
$438.21
|
269,851
60.91% of 50 DAV
50 DAV is 443,000
|
$443.00
-1.28%
|
10/19/2011
|
$424.69
|
PP = $415.29
|
|
MB = $436.05
|
Most Recent Note - 11/3/2011 2:30:21 PM
G - Trading up today on light volume while rising above its "max buy" level, and its color code is changed to green after getting extended from its prior base. Prior highs define important support to watch on pullbacks.
>>> The latest Featured Stock Update with an annotated graph appeared on 10/19/2011. Click here.
View all notes |
Alert me of new notes |
CANSLIM.net Company Profile |
SEC |
Zacks Reports |
StockTalk |
News |
Chart |
Request a new note
C
A N
S L
I M
|
LABL
-
NASDAQ
Multi Color Corp
CONSUMER NON-DURABLES - Packaging and Containers
|
$27.39
|
+1.14
4.34% |
$27.51
|
30,421
57.83% of 50 DAV
50 DAV is 52,600
|
$28.00
-2.18%
|
10/17/2011
|
$27.81
|
PP = $28.10
|
|
MB = $29.51
|
Most Recent Note - 11/3/2011 2:26:49 PM
Y - Quietly hovering only -3.6% off its 52-week high. Subsequent volume-driven gains into new high ground may trigger a technical buy signal. Recent lows near its 50 DMA line define near-term support to watch where any violation would raise concerns. Due to report earnings on Tuesday, November 8th before the opening bell.
>>> The latest Featured Stock Update with an annotated graph appeared on 10/17/2011. Click here.
View all notes |
Alert me of new notes |
CANSLIM.net Company Profile |
SEC |
Zacks Reports |
StockTalk |
News |
Chart |
Request a new note
C
A N
S L
I M
|
Symbol/Exchange
Company Name
Industry Group |
PRICE |
CHANGE
(%Change) |
Day High |
Volume
(% DAV)
(% 50 day avg vol) |
52 Wk Hi
% From Hi |
Featured
Date |
Price
Featured |
Pivot Featured |
|
Max Buy |
MG
-
NYSE
Mistras Group Inc
DIVERSIFIED SERVICES - Bulding and Faci;ity Management Services
|
$22.89
|
+0.73
3.29% |
$23.34
|
162,891
74.79% of 50 DAV
50 DAV is 217,800
|
$23.51
-2.64%
|
10/28/2011
|
$22.49
|
PP = $23.61
|
|
MB = $24.79
|
Most Recent Note - 11/3/2011 2:13:23 PM
Y - Rising near its all-time high today without great volume conviction behind its gain while poised for a best-ever close. Its orderly consolidation was identified as an advanced "3-weeks tight" base. Color code was changed to yellow with new pivot point cited based on its 52-week high plus 10 cents. A subsequent breakout on heavy volume may trigger a new (or add-on) buy signal. Prior highs in the $20-21 area define initial chart support to watch above its 50 DMA line.
>>> The latest Featured Stock Update with an annotated graph appeared on 10/12/2011. Click here.
View all notes |
Alert me of new notes |
CANSLIM.net Company Profile |
SEC |
Zacks Reports |
StockTalk |
News |
Chart |
Request a new note
C
A N
S L
I M
|
MKTX
-
NASDAQ
Marketaxess Holdings Inc
FINANCIAL SERVICES - Investment Brokerage - Nationa
|
$31.01
|
+2.06
7.12% |
$31.45
|
291,969
121.15% of 50 DAV
50 DAV is 241,000
|
$30.95
0.20%
|
10/28/2011
|
$29.79
|
PP = $31.05
|
|
MB = $32.60
|
Most Recent Note - 11/3/2011 6:28:53 PM
Y - Hit a new 52-week high and traded above its pivot point today, however it closed below the mark and volume was just +21% above average behind the considerable gain. The minimum guideline requires at least +40% above average volume behind a gain above a stock's pivot point to trigger a proper new (or add-on) technical buy signal. Disciplined investors may use a tactic called pyramiding to accumulate shares without chasing the stock outside of the ideal buy range.
>>> The latest Featured Stock Update with an annotated graph appeared on 10/31/2011. Click here.
View all notes |
Alert me of new notes |
CANSLIM.net Company Profile |
SEC |
Zacks Reports |
StockTalk |
News |
Chart |
Request a new note
C
A N
S L
I M
|
OPNT
-
NASDAQ
Opnet Technologies
INTERNET - Internet Software and Services
|
$45.72
|
+1.40
3.16% |
$45.89
|
343,890
181.47% of 50 DAV
50 DAV is 189,500
|
$45.92
-0.43%
|
10/11/2011
|
$38.45
|
PP = $42.02
|
|
MB = $44.12
|
Most Recent Note - 11/3/2011 6:30:52 PM
G - Solid gain and strong finish today with +81% above average volume lifted it beyond its "max buy" level and its color code is changed to green. Prior highs in the $41 area define near-term chart support to watch on pullbacks. Due to report earnings on Wednesday, November 9th.
>>> The latest Featured Stock Update with an annotated graph appeared on 10/25/2011. Click here.
View all notes |
Alert me of new notes |
CANSLIM.net Company Profile |
SEC |
Zacks Reports |
StockTalk |
News |
Chart |
Request a new note
C
A N
S L
I M
|
OSIS
-
NASDAQ
O S I Systems Inc
ELECTRONICS - Semiconductor Equipment and Mate
|
$45.20
|
+1.76
4.05% |
$45.30
|
120,872
79.31% of 50 DAV
50 DAV is 152,400
|
$45.57
-0.81%
|
11/1/2011
|
$42.07
|
PP = $45.57
|
|
MB = $47.85
|
Most Recent Note - 11/3/2011 2:15:32 PM
Y - Rising today without great volume conviction, yet trading within close striking distance of its 52-week high. Volume-driven gains above its pivot point may trigger a technical buy signal. Annual earnings (A criteria) growth has been strong and quarterly earnings increases have been above the +25% guideline satisfying the C criteria. Ownership by top-rated funds fell from 352 in Mar '11 to 333 in Sep '11. See the latest FSU analysis for more details and an annotated graph.
>>> The latest Featured Stock Update with an annotated graph appeared on 11/1/2011. Click here.
View all notes |
Alert me of new notes |
CANSLIM.net Company Profile |
SEC |
Zacks Reports |
StockTalk |
News |
Chart |
Request a new note
C
A N
S L
I M
|
SWI
-
NYSE
Solarwinds Inc
COMPUTER SOFTWARE and SERVICES - Application Software
|
$28.75
|
+0.67
2.39% |
$28.90
|
1,899,203
170.24% of 50 DAV
50 DAV is 1,115,600
|
$29.50
-2.54%
|
10/27/2011
|
$27.78
|
PP = $25.62
|
|
MB = $26.90
|
Most Recent Note - 11/3/2011 6:47:48 PM
G - Added to its spurt of volume-driven gains today, rallying to its second-best close ever. It is extended from its previous base pattern. Prior highs in the $25-26 area define initial chart support to watch on pullbacks.
>>> The latest Featured Stock Update with an annotated graph appeared on 10/27/2011. Click here.
View all notes |
Alert me of new notes |
CANSLIM.net Company Profile |
SEC |
Zacks Reports |
StockTalk |
News |
Chart |
Request a new note
C
A N
S L
I M
|
Symbol/Exchange
Company Name
Industry Group |
PRICE |
CHANGE
(%Change) |
Day High |
Volume
(% DAV)
(% 50 day avg vol) |
52 Wk Hi
% From Hi |
Featured
Date |
Price
Featured |
Pivot Featured |
|
Max Buy |
UA
-
NYSE
Under Armour Inc Cl A
CONSUMER NON-DURABLES - Textile - Apparel Clothing
|
$85.76
|
+1.96
2.34% |
$86.00
|
1,215,616
85.65% of 50 DAV
50 DAV is 1,419,300
|
$87.40
-1.88%
|
10/25/2011
|
$82.43
|
PP = $80.80
|
|
MB = $84.84
|
Most Recent Note - 11/3/2011 5:30:53 PM
G - Extended from its prior base, and color code is changed to green. No resistance remains due to overhead supply following its recent spurt of volume-driven gains. Prior highs near $80 define initial support above its 50 DMA line.
>>> The latest Featured Stock Update with an annotated graph appeared on 11/3/2011. Click here.
View all notes |
Alert me of new notes |
CANSLIM.net Company Profile |
SEC |
Zacks Reports |
StockTalk |
News |
Chart |
Request a new note
C
A N
S L
I M
|
V
-
NYSE
Visa Inc Cl A
DIVERSIFIED SERVICES - Business/Management Services
|
$93.18
|
+1.68
1.84% |
$93.80
|
4,602,670
84.43% of 50 DAV
50 DAV is 5,451,300
|
$95.87
-2.81%
|
10/24/2011
|
$94.21
|
PP = $94.85
|
|
MB = $99.59
|
Most Recent Note - 11/2/2011 6:14:33 PM
Y - Finished in the lower third of its intra-day range today after encountering more distributional pressure. It did not trigger a proper new technical buy signal since recently highlighted in yellow as an ideal looking set-up. Its 50 DMA line defines near-term chart support to watch.
>>> The latest Featured Stock Update with an annotated graph appeared on 10/24/2011. Click here.
View all notes |
Alert me of new notes |
CANSLIM.net Company Profile |
SEC |
Zacks Reports |
StockTalk |
News |
Chart |
Request a new note
C
A N
S L
I M
|
|
|
|
THESE ARE NOT BUY RECOMMENDATIONS!
Comments contained in the body of this report are technical
opinions only. The material herein has been obtained
from sources believed to be reliable and accurate, however,
its accuracy and completeness cannot be guaranteed.
This site is not an investment advisor, hence it does
not endorse or recommend any securities or other investments.
Any recommendation contained in this report may not
be suitable for all investors and it is not to be deemed
an offer or solicitation on our part with respect to
the purchase or sale of any securities. All trademarks,
service marks and trade names appearing in this report
are the property of their respective owners, and are
likewise used for identification purposes only.
This report is a service available
only to active Paid Premium Members.
You may opt-out of receiving report notifications
at any time. Questions or comments may be submitted
by writing to Premium Membership Services 665 S.E. 10 Street, Suite 201 Deerfield Beach, FL 33441-5634 or by calling 1-800-965-8307
or 954-785-1121.
|
|
|

