You are not logged in.
This means you
CAN ONLY VIEW reports that were published prior to Tuesday, April 15, 2025.
You
MUST UPGRADE YOUR MEMBERSHIP if you want to see any current reports.
AFTER MARKET UPDATE - WEDNESDAY, NOVEMBER 2ND, 2011
Previous After Market Report Next After Market Report >>>
|
|
|
|
DOW |
+178.08 |
11,836.04 |
+1.53% |
|
Volume |
957,338,450 |
-28% |
|
Volume |
1,879,262,090 |
-17% |
|
NASDAQ |
+33.02 |
2,639.98 |
+1.27% |
|
Advancers |
2,490 |
81% |
|
Advancers |
1,954 |
74% |
|
S&P 500 |
+19.62 |
1,237.90 |
+1.61% |
|
Decliners |
515 |
17% |
|
Decliners |
570 |
22% |
|
Russell 2000 |
+19.37 |
733.26 |
+2.71% |
|
52 Wk Highs |
25 |
|
|
52 Wk Highs |
22 |
|
|
S&P 600 |
+10.16 |
404.30 |
+2.58% |
|
52 Wk Lows |
15 |
|
|
52 Wk Lows |
30 |
|
|
 |
Major Averages Post Gains With Less Volume Conviction
Kenneth J. Gruneisen - Passed the CAN SLIM® Master's Exam
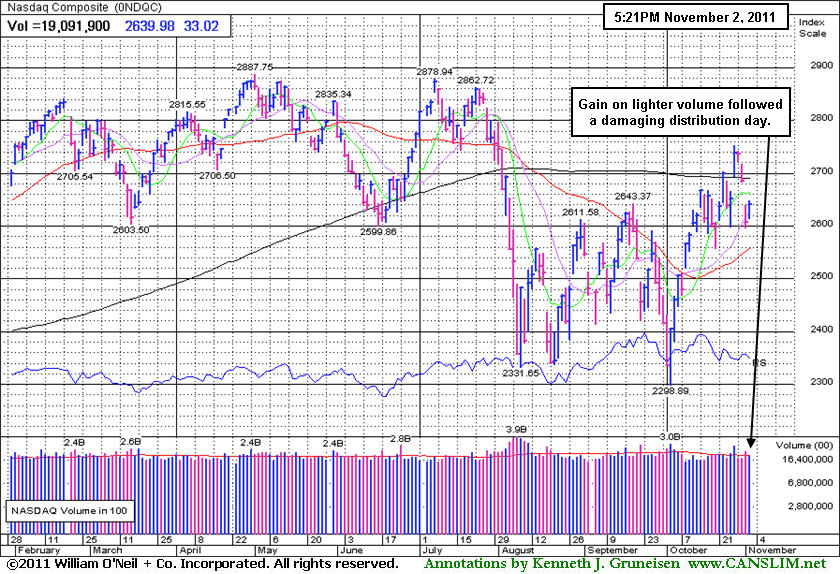
The major averages snapped a two-day decline on encouraging signs on employment. Trading volume was reported lighter on the NYSE and on the Nasdaq exchange, however, which is a sign of lackluster buying demand from institutional investors following damaging distributional pressure which has put the current uptrend under pressure. Advancers led decliners by almost 5-1 on the NYSE and 7-2 on the Nasdaq exchange. New 52-week lows outnumbered new 52-week highs on the Nasdaq exchange, however new highs took the lead again on the NYSE. There were 12 high-ranked companies from the CANSLIM.net Leaders List that made new 52-week highs and appeared on the CANSLIM.net BreakOuts Page, up from the prior session total of 4 stocks. There were gains for 16 of the 17 high-ranked companies currently included on the Featured Stocks Page.
Stocks rose after the ADP report showed companies added more to payrolls in October. The market gave back some gains following the FOMC meeting. Some investors were disappointed no stimulus measures accompanied the Fed's decision to keep rates unchanged. In its statement, the Fed noted the economy improved but downside risks remain. In a separate report, the Fed adjusted its 2011 and 2012 growth estimates downward. Meanwhile, Europe continued to make headlines as leaders gathered ahead of the G-20 summit to tell Greek Prime Minister Papandreou there are no alternatives to the bailout.
Energy-related shares led the advance driven by positive earnings results from EOG Resources Inc (EOG +11.83%) and Pioneer Natural Resources Co (PXD +12.58%). Financials rallied with MasterCard Inc (MA +6.99%) up after profits topped expectations. A vote by Congress to ban new state and local taxes on wireless services helped telecom stocks, yet AT&T (T +1.32%) and Verizon Communications Inc (VZ +0.90%) posted only small gains. Meanwhile, Career Education Corp (CECO -47.84%) tumbled on disappointing earnings and the resignation of its CEO.
The October 2011 issue of our monthly newsletter CANSLIM.net News will be published soon with an informative review of current market conditions, leading groups, and best buy candidates. Via the Premium Member Homepage links to all prior reports and webcasts are always available.
PICTURED: The Nasdaq Composite Index posted a gain on lighter volume following a damaging distribution day.
|
 Kenneth J. Gruneisen started out as a licensed stockbroker in August 1987, a couple of months prior to the historic stock market crash that took the Dow Jones Industrial Average down -22.6% in a single day. He has published daily fact-based fundamental and technical analysis on high-ranked stocks online for two decades. Through FACTBASEDINVESTING.COM, Kenneth provides educational articles, news, market commentary, and other information regarding proven investment systems that work in good times and bad.
Comments contained in the body of this report are technical opinions only and are not necessarily those of Gruneisen Growth Corp. The material herein has been obtained from sources believed to be reliable and accurate, however, its accuracy and completeness cannot be guaranteed. Our firm, employees, and customers may effect transactions, including transactions contrary to any recommendation herein, or have positions in the securities mentioned herein or options with respect thereto. Any recommendation contained in this report may not be suitable for all investors and it is not to be deemed an offer or solicitation on our part with respect to the purchase or sale of any securities. |
|
 |
Financial, Defensive, and Energy-Linked Groups Led Bounce
Kenneth J. Gruneisen - Passed the CAN SLIM® Master's Exam
The Broker/Dealer Index ($XBD +2.89%) and Bank Index ($BKX +3.28%) reclaimed some of the prior session's lost ground and helped underpin the market's bounce on Wednesday. Defensive groups and energy-related shares tallied solid gains as the Healthcare Index ($HMO +2.14%), Gold & Silver Index ($XAU +2.24%), Integrated Oil Index ($XOI +2.17%), and Oil Services Index ($OSX +2.37%) each tallied better than +2% gains. The Retail Index ($RLX +1.33%) posted a smaller gain. The tech sector had a mostlyu positive bias as the Semiconductor Index ($SOX +0.49%), Networking Index ($NWX +1.19%), and Internet Index ($IIX +1.68%) rose, meanwhile the Biotechnology Index ($BTK -1.02%) was a laggard while it ended the mostly positive session in the red.
Charts courtesy www.stockcharts.com
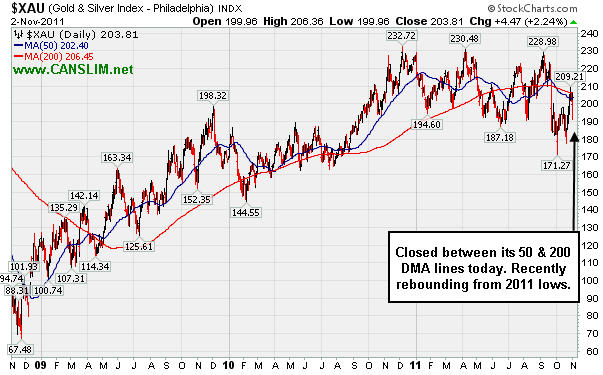
PICTURED: The Gold & Silver Index ($XAU +2.24%) closed between its 50-day and 200-day moving average lines today. It recently has been rebounding from 2011.
| Oil Services |
$OSX |
227.40 |
+5.27 |
+2.37% |
-7.23% |
| Healthcare |
$HMO |
2,186.52 |
+45.80 |
+2.14% |
+29.23% |
| Integrated Oil |
$XOI |
1,213.22 |
+25.73 |
+2.17% |
+0.00% |
| Semiconductor |
$SOX |
375.88 |
+1.83 |
+0.49% |
-8.73% |
| Networking |
$NWX |
238.57 |
+2.81 |
+1.19% |
-14.97% |
| Internet |
$IIX |
291.15 |
+4.80 |
+1.68% |
-5.39% |
| Broker/Dealer |
$XBD |
88.14 |
+2.47 |
+2.89% |
-27.46% |
| Retail |
$RLX |
534.81 |
+7.01 |
+1.33% |
+5.20% |
| Gold & Silver |
$XAU |
203.81 |
+4.47 |
+2.24% |
-10.05% |
| Bank |
$BKX |
39.38 |
+1.25 |
+3.28% |
-24.57% |
| Biotech |
$BTK |
1,125.53 |
-11.65 |
-1.02% |
-13.26% |
|
|
|
 |
Following Double Bottom Perched Within Range of New Highs
Kenneth J. Gruneisen - Passed the CAN SLIM® Master's Exam
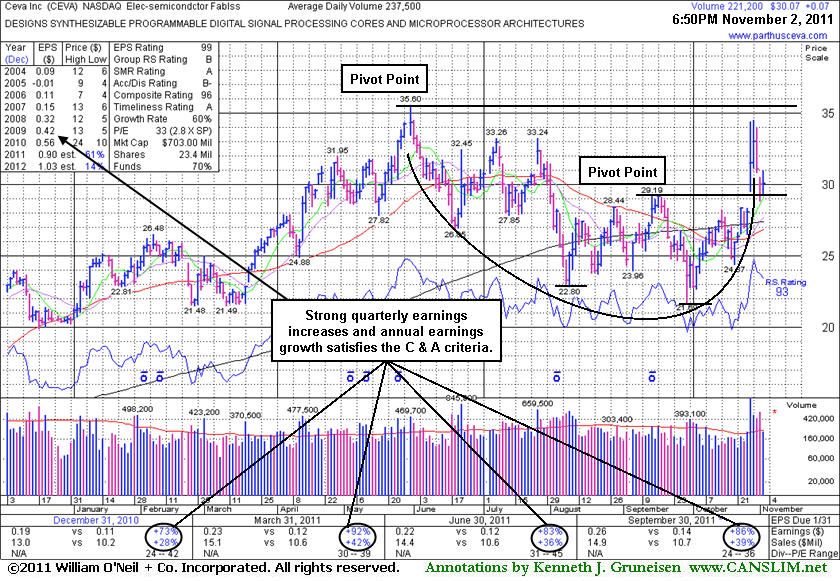
Ceva Inc (CEVA +$0.07 or +0.23% to $30.07) quietly held its ground today after 2 consecutive losses on above average volume following 2 consecutive volume-driven gains. In the 10/28/11 mid-day report (read here) it was featured again in yellow with a pivot point based on its 52-week high plus 10 cents while rallying "straight up from the bottom" of a 22-week cup shaped base. Little overhead supply remains to act as resistance, but it has encountered distributional pressure since. Volume-driven gains above its pivot point are still needed to trigger a new (or add-on) technical buy signal. Disciplined investors always limit losses if any stock falls more than -7% from their purchase price.
Its last appearance in this FSU section was on 5/25/11 with an annotated graph under the headline, "Twice Average Volume Behind Technical Breakout." However it made only limited progress and was dropped from the Featured Stocks list on 6/17/11. Afterward it slumped below its 200-day moving average (DMA) line during its deep consolidation before recently rebounding impressively. It gapped up on 10/27/11 and broke out of a "double bottom" base pattern after reporting earnings +86% on +39% sales revenues for the quarter ended September 30, 2011 versus the year ago period. It has a good annual earnings (A criteria) history, and strong quarterly sales revenues and earnings increases satisfy the C criteria. However, Return On Equity is reported at 8%, below the 17% guideline. The number of top-rated funds owning its shares rose from 223 in Dec '10 to 292 in Sep '11, a very reassuring sign concerning the investment system's I criteria. Its current Up/Down Volume Ratio of 1.4 is also an unbiased indication of recent accumulation.
|
|
|
Color Codes Explained :
Y - Better candidates highlighted by our
staff of experts.
G - Previously featured
in past reports as yellow but may no longer be buyable under the
guidelines.
***Last / Change / Volume data in this table is the closing quote data***
Symbol/Exchange
Company Name
Industry Group |
PRICE |
CHANGE
(%Change) |
Day High |
Volume
(% DAV)
(% 50 day avg vol) |
52 Wk Hi
% From Hi |
Featured
Date |
Price
Featured |
Pivot Featured |
|
Max Buy |
AAPL
-
NASDAQ
Apple Inc
COMPUTER HARDWARE - Personal Computers
|
$397.41
|
+0.90
0.23% |
$400.44
|
11,705,541
55.01% of 50 DAV
50 DAV is 21,278,800
|
$426.70
-6.86%
|
9/16/2011
|
$399.14
|
PP = $404.60
|
|
MB = $424.83
|
 Most Recent Note - 11/2/2011 5:40:52 PM
G - It has not formed a sound base pattern and ownership by top-rated funds has fallen some, as previously noted. Volume totals have recently been cooling while consolidating just above its 50 DMA line, and it is perched just -6.9% off its all-time high after a tiny gain on light volume today.
>>> The latest Featured Stock Update with an annotated graph appeared on 10/20/2011. Click here.
View all notes |
Alert me of new notes |
CANSLIM.net Company Profile |
SEC |
Zacks Reports |
StockTalk |
News |
Chart |
Request a new note
C
A N
S L
I M


|
ADS
-
NYSE
Alliance Data Sys Corp
COMPUTER SOFTWARE and SERVICES - Information and Delivery Service
|
$101.40
|
+1.22
1.22% |
$101.99
|
738,883
76.89% of 50 DAV
50 DAV is 960,900
|
$105.67
-4.04%
|
10/21/2011
|
$97.94
|
PP = $101.15
|
|
MB = $106.21
|
Most Recent Note - 11/2/2011 5:43:03 PM
Y - Posted a small gain today with below average volume, closing just above its pivot point. Trading near prior chart highs in the $101 that define initial support to watch well above its 50 DMA line.
>>> The latest Featured Stock Update with an annotated graph appeared on 10/21/2011. Click here.
View all notes |
Alert me of new notes |
CANSLIM.net Company Profile |
SEC |
Zacks Reports |
StockTalk |
News |
Chart |
Request a new note
C
A N
S L
I M
|
ALXN
-
NASDAQ
Alexion Pharmaceuticals
DRUGS - Drug Manufacturers - Other
|
$66.11
|
-0.16
-0.24% |
$67.32
|
1,007,800
65.23% of 50 DAV
50 DAV is 1,545,100
|
$70.42
-6.12%
|
9/15/2011
|
$63.20
|
PP = $60.81
|
|
MB = $63.85
|
Most Recent Note - 11/2/2011 5:45:05 PM
G - Quietly held its ground today, quietly consolidating above its 50 DMA line previously noted as chart support to watch on pullbacks. A violation of that important short-term average line would raise concerns and trigger a technical sell signal.
>>> The latest Featured Stock Update with an annotated graph appeared on 10/18/2011. Click here.
View all notes |
Alert me of new notes |
CANSLIM.net Company Profile |
SEC |
Zacks Reports |
StockTalk |
News |
Chart |
Request a new note
C
A N
S L
I M
|
CELG
-
NASDAQ
Celgene Corp
DRUGS - Drug Manufacturers - Major
|
$63.79
|
+0.23
0.36% |
$64.32
|
3,201,110
83.01% of 50 DAV
50 DAV is 3,856,400
|
$68.25
-6.53%
|
9/16/2011
|
$61.21
|
PP = $62.59
|
|
MB = $65.72
|
Most Recent Note - 11/2/2011 5:47:33 PM
Y - Quietly held its ground today following a gap down on the prior session. Its 50 DMA line defines important near-term chart support to watch, and a violation would raise concerns and trigger a technical sell signal.
>>> The latest Featured Stock Update with an annotated graph appeared on 10/14/2011. Click here.
View all notes |
Alert me of new notes |
CANSLIM.net Company Profile |
SEC |
Zacks Reports |
StockTalk |
News |
Chart |
Request a new note
C
A N
S L
I M
|
CEVA
-
NASDAQ
Ceva Inc
ELECTRONICS - Semiconductor - Specialized
|
$30.07
|
+0.07
0.23% |
$30.98
|
232,070
97.71% of 50 DAV
50 DAV is 237,500
|
$35.60
-15.53%
|
10/28/2011
|
$34.38
|
PP = $35.70
|
|
MB = $37.49
|
Most Recent Note - 11/2/2011 5:51:07 PM
Y - Quietly held its ground today after 2 consecutive losses on above average volume following 2 consecutive volume-driven gains. It gapped up on 10/27/11 and broke out of a "double bottom" base pattern after reporting earnings +86% on +39% sales revenues for the quarter ended September 30, 2011 versus the year ago period. It had slumped below its 200 DMA line during its consolidation since dropped from the Featured Stocks list on 6/17/11. In the 10/28/11 mid-day report (read here) it was featured again in yellow with pivot point based on its 52-week high plus 10 cents while rallying "straight up from the bottom" of a 22-week cup shaped base. It has encountered distributional pressure since, while volume-driven gains above its pivot point are needed to trigger a new (or add-on) technical buy signal.
>>> The latest Featured Stock Update with an annotated graph appeared on 11/2/2011. Click here.
View all notes |
Alert me of new notes |
CANSLIM.net Company Profile |
SEC |
Zacks Reports |
StockTalk |
News |
Chart |
Request a new note
C
A N
S L
I M
|
Symbol/Exchange
Company Name
Industry Group |
PRICE |
CHANGE
(%Change) |
Day High |
Volume
(% DAV)
(% 50 day avg vol) |
52 Wk Hi
% From Hi |
Featured
Date |
Price
Featured |
Pivot Featured |
|
Max Buy |
FEIC
-
NASDAQ
F E I Co
ELECTRONICS - Diversified Electronics
|
$39.13
|
+1.34
3.55% |
$39.20
|
419,360
93.63% of 50 DAV
50 DAV is 447,900
|
$42.25
-7.38%
|
10/28/2011
|
$40.31
|
PP = $40.88
|
|
MB = $42.92
|
Most Recent Note - 11/2/2011 5:52:56 PM
Y - Quietly rose and finished near the session high today following 2 consecutive losses with above average volume. Spiked to a new 52-week high on 10/28/11 and triggered a technical buy signal with 4 times average volume while rallying straight up from the bottom of a 16-week cup shaped base.
>>> The latest Featured Stock Update with an annotated graph appeared on 10/28/2011. Click here.
View all notes |
Alert me of new notes |
CANSLIM.net Company Profile |
SEC |
Zacks Reports |
StockTalk |
News |
Chart |
Request a new note
C
A N
S L
I M
|
GNC
-
NYSE
G N C Holdings Inc
RETAIL - Drug Stores
|
$25.94
|
+1.38
5.62% |
$26.38
|
3,072,277
262.27% of 50 DAV
50 DAV is 1,171,400
|
$26.48
-2.04%
|
10/26/2011
|
$24.60
|
PP = $24.80
|
|
MB = $26.04
|
Most Recent Note - 11/2/2011 5:54:48 PM
Y - Up today with above average volume, challenging its 52-week high and finishing the session near its "max buy" level. No overhead supply remains to act as resistance after 4 consecutive winning weeks with ever-increasing volume. On 10/25/11 it priced a Secondary Offering after the 10/24/11 gain with more than 4 times average volume triggered a technical buy signal. Strong quarterly and annual earnings history satisfies the C and A criteria.
>>> The latest Featured Stock Update with an annotated graph appeared on 10/26/2011. Click here.
View all notes |
Alert me of new notes |
CANSLIM.net Company Profile |
SEC |
Zacks Reports |
StockTalk |
News |
Chart |
Request a new note
C
A N
S L
I M
|
HMSY
-
NASDAQ
H M S Holdings Corp
COMPUTER SOFTWARE and SERVICES - Healthcare Information Service
|
$24.53
|
+0.56
2.34% |
$24.60
|
765,731
125.61% of 50 DAV
50 DAV is 609,600
|
$28.25
-13.15%
|
10/27/2011
|
$26.44
|
PP = $28.37
|
|
MB = $29.79
|
Most Recent Note - 11/2/2011 5:56:37 PM
G - Posted a gain today with above average volume but it remains below its 50 and 200 DMA lines and needs gains above those moving averages for its outlook to improve. Last week it reported earnings +31% on +15% sales revenues for the quarter ended September 30, 2011 versus the year ago period, then it gapped down and violated its 50 and 200 DMA lines raising concerns and triggering technical sell signals. Disciplined investors will note that it did not trigger a technical buy signal.
>>> The latest Featured Stock Update with an annotated graph appeared on 5/23/2011. Click here.
View all notes |
Alert me of new notes |
CANSLIM.net Company Profile |
SEC |
Zacks Reports |
StockTalk |
News |
Chart |
Request a new note
C
A N
S L
I M
|
ISRG
-
NASDAQ
Intuitive Surgical Inc
HEALTH SERVICES - Medical Appliances and Equipment
|
$427.10
|
+0.93
0.22% |
$431.72
|
240,618
53.69% of 50 DAV
50 DAV is 448,200
|
$443.00
-3.59%
|
10/19/2011
|
$424.69
|
PP = $415.29
|
|
MB = $436.05
|
Most Recent Note - 11/2/2011 5:58:54 PM
Y - Held its ground with a small gain today on very light volume, lingering above its pivot point and below its "max buy" level. Prior highs define important support to watch on pullbacks.
>>> The latest Featured Stock Update with an annotated graph appeared on 10/19/2011. Click here.
View all notes |
Alert me of new notes |
CANSLIM.net Company Profile |
SEC |
Zacks Reports |
StockTalk |
News |
Chart |
Request a new note
C
A N
S L
I M
|
LABL
-
NASDAQ
Multi Color Corp
CONSUMER NON-DURABLES - Packaging and Containers
|
$26.25
|
+0.23
0.88% |
$26.43
|
44,370
82.63% of 50 DAV
50 DAV is 53,700
|
$28.00
-6.25%
|
10/17/2011
|
$27.81
|
PP = $28.10
|
|
MB = $29.51
|
Most Recent Note - 11/2/2011 6:00:06 PM
Y - Small gain today on lighter volume, finishing -6.3% off its 52-week high. Subsequent volume-driven gains into new high ground may trigger a technical buy signal. Recent lows near its 50 DMA line define near-term support to watch where any violation would raise concerns. Due to report earnings on Tuesday, November 8th before the opening bell.
>>> The latest Featured Stock Update with an annotated graph appeared on 10/17/2011. Click here.
View all notes |
Alert me of new notes |
CANSLIM.net Company Profile |
SEC |
Zacks Reports |
StockTalk |
News |
Chart |
Request a new note
C
A N
S L
I M
|
Symbol/Exchange
Company Name
Industry Group |
PRICE |
CHANGE
(%Change) |
Day High |
Volume
(% DAV)
(% 50 day avg vol) |
52 Wk Hi
% From Hi |
Featured
Date |
Price
Featured |
Pivot Featured |
|
Max Buy |
MG
-
NYSE
Mistras Group Inc
DIVERSIFIED SERVICES - Bulding and Faci;ity Management Services
|
$22.16
|
+0.44
2.03% |
$22.35
|
95,980
43.02% of 50 DAV
50 DAV is 223,100
|
$23.51
-5.74%
|
10/28/2011
|
$22.49
|
PP = $23.61
|
|
MB = $24.79
|
Most Recent Note - 11/2/2011 6:02:06 PM
Y - Posted a small gain today on lighter volume. Near its all-time high, its orderly consolidation was identified as an advanced "3-weeks tight" base. Color code was changed to yellow with new pivot point cited based on its 52-week high plus 10 cents. A subsequent breakout on heavy volume may trigger a new (or add-on) buy signal. Prior highs in the $20-21 area define initial chart support to watch above its 50 DMA line.
>>> The latest Featured Stock Update with an annotated graph appeared on 10/12/2011. Click here.
View all notes |
Alert me of new notes |
CANSLIM.net Company Profile |
SEC |
Zacks Reports |
StockTalk |
News |
Chart |
Request a new note
C
A N
S L
I M
|
MKTX
-
NASDAQ
Marketaxess Holdings Inc
FINANCIAL SERVICES - Investment Brokerage - Nationa
|
$28.95
|
+0.06
0.21% |
$29.05
|
553,774
232.97% of 50 DAV
50 DAV is 237,700
|
$30.95
-6.46%
|
10/28/2011
|
$29.79
|
PP = $31.05
|
|
MB = $32.60
|
Most Recent Note - 11/2/2011 6:05:44 PM
Y - Finished near the session high today with a small gain on above average volume after trading in the red and testing near its 50 DMA line at the session lows. A subsequent breakout would trigger a new technical buy signal.
>>> The latest Featured Stock Update with an annotated graph appeared on 10/31/2011. Click here.
View all notes |
Alert me of new notes |
CANSLIM.net Company Profile |
SEC |
Zacks Reports |
StockTalk |
News |
Chart |
Request a new note
C
A N
S L
I M
|
OPNT
-
NASDAQ
Opnet Technologies
INTERNET - Internet Software and Services
|
$44.32
|
+0.86
1.98% |
$44.57
|
448,072
244.98% of 50 DAV
50 DAV is 182,900
|
$45.92
-3.48%
|
10/11/2011
|
$38.45
|
PP = $42.02
|
|
MB = $44.12
|
Most Recent Note - 11/2/2011 6:07:34 PM
Y - Posted a small gain today with volume more than 2 times average. Encountering some distributional pressure while churning above average volume without making more meaningful price progress in the past week. Prior highs in the $41 area define near-term chart support to watch. Due to report earnings on Wednesday, November 9th.
>>> The latest Featured Stock Update with an annotated graph appeared on 10/25/2011. Click here.
View all notes |
Alert me of new notes |
CANSLIM.net Company Profile |
SEC |
Zacks Reports |
StockTalk |
News |
Chart |
Request a new note
C
A N
S L
I M
|
OSIS
-
NASDAQ
O S I Systems Inc
ELECTRONICS - Semiconductor Equipment and Mate
|
$43.44
|
+0.99
2.33% |
$43.83
|
168,737
111.45% of 50 DAV
50 DAV is 151,400
|
$45.57
-4.67%
|
11/1/2011
|
$42.07
|
PP = $45.57
|
|
MB = $47.85
|
Most Recent Note - 11/2/2011 6:09:23 PM
Y - Up today with near average volume. Subsequent volume-driven gains above its pivot point may trigger a technical buy signal. Annual earnings (A criteria) growth has been strong and quarterly earnings increases have been above the +25% guideline satisfying the C criteria. Ownership by top-rated funds fell from 352 in Mar '11 to 333 in Sep '11. See the latest FSU analysis for more details and an annotated graph.
>>> The latest Featured Stock Update with an annotated graph appeared on 11/1/2011. Click here.
View all notes |
Alert me of new notes |
CANSLIM.net Company Profile |
SEC |
Zacks Reports |
StockTalk |
News |
Chart |
Request a new note
C
A N
S L
I M
|
SWI
-
NYSE
Solarwinds Inc
COMPUTER SOFTWARE and SERVICES - Application Software
|
$28.08
|
+0.32
1.15% |
$28.30
|
1,716,432
156.78% of 50 DAV
50 DAV is 1,094,800
|
$29.50
-4.81%
|
10/27/2011
|
$27.78
|
PP = $25.62
|
|
MB = $26.90
|
Most Recent Note - 11/2/2011 6:10:19 PM
G - Holding its ground near all-time highs, extended from its previous base pattern. Prior highs in the $25-26 area define initial chart support to watch on pullbacks.
>>> The latest Featured Stock Update with an annotated graph appeared on 10/27/2011. Click here.
View all notes |
Alert me of new notes |
CANSLIM.net Company Profile |
SEC |
Zacks Reports |
StockTalk |
News |
Chart |
Request a new note
C
A N
S L
I M
|
Symbol/Exchange
Company Name
Industry Group |
PRICE |
CHANGE
(%Change) |
Day High |
Volume
(% DAV)
(% 50 day avg vol) |
52 Wk Hi
% From Hi |
Featured
Date |
Price
Featured |
Pivot Featured |
|
Max Buy |
UA
-
NYSE
Under Armour Inc Cl A
CONSUMER NON-DURABLES - Textile - Apparel Clothing
|
$83.80
|
+1.75
2.13% |
$85.77
|
1,334,634
92.55% of 50 DAV
50 DAV is 1,442,100
|
$87.40
-4.12%
|
10/25/2011
|
$82.43
|
PP = $80.80
|
|
MB = $84.84
|
Most Recent Note - 11/2/2011 6:13:04 PM
Y - Perched near its all-time high, holding its ground above prior highs near $80 that define initial support above its 50 DMA line. No resistance remains due to overhead supply following its recent spurt of volume-driven gains.
>>> The latest Featured Stock Update with an annotated graph appeared on 7/26/2011. Click here.
View all notes |
Alert me of new notes |
CANSLIM.net Company Profile |
SEC |
Zacks Reports |
StockTalk |
News |
Chart |
Request a new note
C
A N
S L
I M
|
V
-
NYSE
Visa Inc Cl A
DIVERSIFIED SERVICES - Business/Management Services
|
$91.50
|
+1.47
1.63% |
$93.99
|
6,141,208
113.12% of 50 DAV
50 DAV is 5,428,900
|
$95.87
-4.56%
|
10/24/2011
|
$94.21
|
PP = $94.85
|
|
MB = $99.59
|
Most Recent Note - 11/2/2011 6:14:33 PM
Y - Finished in the lower third of its intra-day range today after encountering more distributional pressure. It did not trigger a proper new technical buy signal since recently highlighted in yellow as an ideal looking set-up. Its 50 DMA line defines near-term chart support to watch.
>>> The latest Featured Stock Update with an annotated graph appeared on 10/24/2011. Click here.
View all notes |
Alert me of new notes |
CANSLIM.net Company Profile |
SEC |
Zacks Reports |
StockTalk |
News |
Chart |
Request a new note
C
A N
S L
I M
|
|
|
|
THESE ARE NOT BUY RECOMMENDATIONS!
Comments contained in the body of this report are technical
opinions only. The material herein has been obtained
from sources believed to be reliable and accurate, however,
its accuracy and completeness cannot be guaranteed.
This site is not an investment advisor, hence it does
not endorse or recommend any securities or other investments.
Any recommendation contained in this report may not
be suitable for all investors and it is not to be deemed
an offer or solicitation on our part with respect to
the purchase or sale of any securities. All trademarks,
service marks and trade names appearing in this report
are the property of their respective owners, and are
likewise used for identification purposes only.
This report is a service available
only to active Paid Premium Members.
You may opt-out of receiving report notifications
at any time. Questions or comments may be submitted
by writing to Premium Membership Services 665 S.E. 10 Street, Suite 201 Deerfield Beach, FL 33441-5634 or by calling 1-800-965-8307
or 954-785-1121.
|
|
|

