You are not logged in.
This means you
CAN ONLY VIEW reports that were published prior to Tuesday, April 15, 2025.
You
MUST UPGRADE YOUR MEMBERSHIP if you want to see any current reports.
AFTER MARKET UPDATE - TUESDAY, NOVEMBER 1ST, 2011
Previous After Market Report Next After Market Report >>>
|
|
|
|
DOW |
-297.05 |
11,657.96 |
-2.48% |
|
Volume |
1,329,221,320 |
+16% |
|
Volume |
2,254,311,400 |
+31% |
|
NASDAQ |
-77.45 |
2,606.96 |
-2.89% |
|
Advancers |
450 |
15% |
|
Advancers |
414 |
16% |
|
S&P 500 |
-35.02 |
1,218.28 |
-2.79% |
|
Decliners |
2,605 |
84% |
|
Decliners |
2,160 |
82% |
|
Russell 2000 |
-27.17 |
713.89 |
-3.67% |
|
52 Wk Highs |
12 |
|
|
52 Wk Highs |
12 |
|
|
S&P 600 |
-14.24 |
394.14 |
-3.49% |
|
52 Wk Lows |
32 |
|
|
52 Wk Lows |
58 |
|
|
 |
Volume Increases as Indices Endure Heavier Distributional Pressure
Kenneth J. Gruneisen - Passed the CAN SLIM® Master's Exam
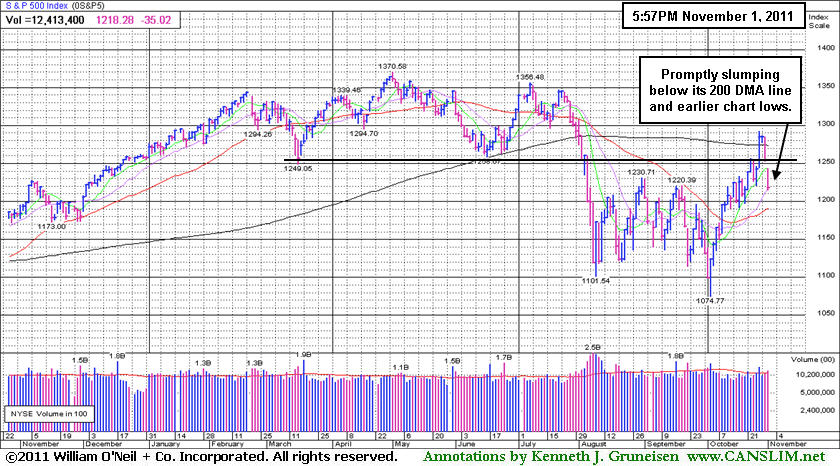
The major averages fell sharply amid growing concerns of Europe's ability to fund its rescue package. Trading volume was reported higher on the NYSE and on the Nasdaq exchange, a sign of distributional pressure or heavier selling from institutional investors. Decliners led advancers by more nearly 6-1 on the NYSE and by 5-1 on the Nasdaq exchange. New 52-week lows outnumbered new 52-week highs on the NYSE and on the Nasdaq exchange. There were only 4 high-ranked companies from the CANSLIM.net Leaders List that made new 52-week highs and appeared on the CANSLIM.net BreakOuts Page, down abruptly from the prior session total of 27 stocks. There were losses for all of the 17 high-ranked companies currently included on the Featured Stocks Page.
Tuesday began with a sharply lower open for the major averages. Weaker manufacturing data from China added to the unease over Europe's sovereign debt crisis. China's PMI recorded its lowest reading since Feb 2009. The weak report added pressure to Alcoa Inc (AA -3.35%), Freeport McMoRan Copper & Gold (FCX -3.73%), and Halliburton Co (HAL -5.65%). U.S. manufacturing activity expanded less than expected in October.
Stocks fell after Greece's Prime Minister George Papandreou said he will put the European Union's financing plan up to a referendum which some fear could derail Europe's bailout efforts. The beleaguered nation risks default if rejected by voters. European markets were sharply lower overnight. Citigroup Inc (C -7.66%) and Morgan Stanley (MS -7.99%) were among the well-known financial shares leading the decline as concerns over Europe and the fallout from the MF Global bankruptcy weighed on the sector.
Third-quarter earnings did not help to ease the cautious tone. Profit misses from Archer Daniels Midland Co (ADM -4.15%), Baker Hughes Inc (BHI -7.67%), Metro PCS Communications Inc (PCS -9.88%), and Henry Schein Inc (HSIC -7.17%) offset better-than-expected results from Pfizer Inc (PFE +0.36%), Emerson Electric Co (EME +0.39%), and CME Group Inc (CME -8.59%).
The Federal Reserve's two day FOMC meeting commenced. It is expected the central bank will keep rates unchanged.
The October 2011 issue of our monthly newsletter CANSLIM.net News will be published soon with an informative review of current market conditions, leading groups, and best buy candidates. Via the Premium Member Homepage links to all prior reports and webcasts are always available.
PICTURED: The S&P 500 Index promptly slumped back below its 200-day moving average (DMA) line and earlier chart lows.
|
 Kenneth J. Gruneisen started out as a licensed stockbroker in August 1987, a couple of months prior to the historic stock market crash that took the Dow Jones Industrial Average down -22.6% in a single day. He has published daily fact-based fundamental and technical analysis on high-ranked stocks online for two decades. Through FACTBASEDINVESTING.COM, Kenneth provides educational articles, news, market commentary, and other information regarding proven investment systems that work in good times and bad.
Comments contained in the body of this report are technical opinions only and are not necessarily those of Gruneisen Growth Corp. The material herein has been obtained from sources believed to be reliable and accurate, however, its accuracy and completeness cannot be guaranteed. Our firm, employees, and customers may effect transactions, including transactions contrary to any recommendation herein, or have positions in the securities mentioned herein or options with respect thereto. Any recommendation contained in this report may not be suitable for all investors and it is not to be deemed an offer or solicitation on our part with respect to the purchase or sale of any securities. |
|
 |
Financial Groups Led Broad Based Declines
Kenneth J. Gruneisen - Passed the CAN SLIM® Master's Exam
Financial shares were the hardest hit as the Broker/Dealer Index ($XBD -5.75%) and Bank Index ($BKX -4.89%) suffered large losses. Energy-related shares retreated and the Oil Services Index ($OSX -4.04%) and Integrated Oil Index ($XOI -2.76%) fell. The tech sector saw unanimous losses in the -3% range for the Networking Index ($NWX -3.55%), Semiconductor Index ($SOX -3.22%), Internet Index ($IIX -3.06%), and Biotechnology Index ($BTK -2.93%). The Retail Index ($RLX -1.26%) was not hurt as badly as most other groups. In defensive areas, the Gold & Silver Index ($XAU -0.94%) did a better job of holding its ground, but the Healthcare Index ($HMO -2.42%) also faced pressure.
Charts courtesy www.stockcharts.com
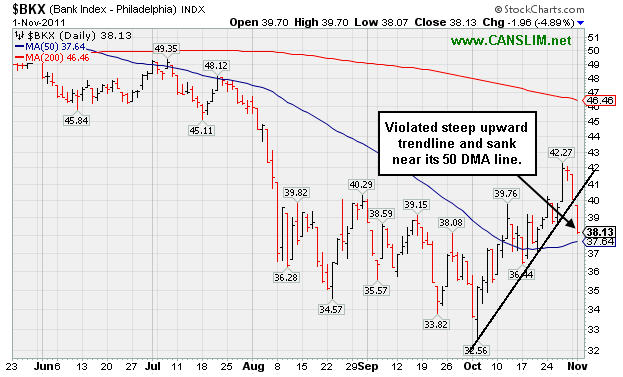
PICTURED: The Bank Index ($BKX -4.89%) violated a steep upward trendline and sank toward its 50-day moving average (DMA) line.
| Oil Services |
$OSX |
222.13 |
-9.35 |
-4.04% |
-9.38% |
| Healthcare |
$HMO |
2,140.72 |
-53.17 |
-2.42% |
+26.52% |
| Integrated Oil |
$XOI |
1,187.49 |
-33.76 |
-2.76% |
-2.12% |
| Semiconductor |
$SOX |
374.05 |
-12.44 |
-3.22% |
-9.17% |
| Networking |
$NWX |
235.76 |
-8.68 |
-3.55% |
-15.97% |
| Internet |
$IIX |
286.35 |
-9.05 |
-3.06% |
-6.95% |
| Broker/Dealer |
$XBD |
85.67 |
-5.22 |
-5.75% |
-29.50% |
| Retail |
$RLX |
527.80 |
-6.73 |
-1.26% |
+3.82% |
| Gold & Silver |
$XAU |
199.34 |
-1.90 |
-0.94% |
-12.02% |
| Bank |
$BKX |
38.13 |
-1.96 |
-4.89% |
-26.97% |
| Biotech |
$BTK |
1,137.18 |
-34.31 |
-2.93% |
-12.36% |
|
|
|
 |
Pullback My Be Handle Following Cup Shaped Base
Kenneth J. Gruneisen - Passed the CAN SLIM® Master's Exam
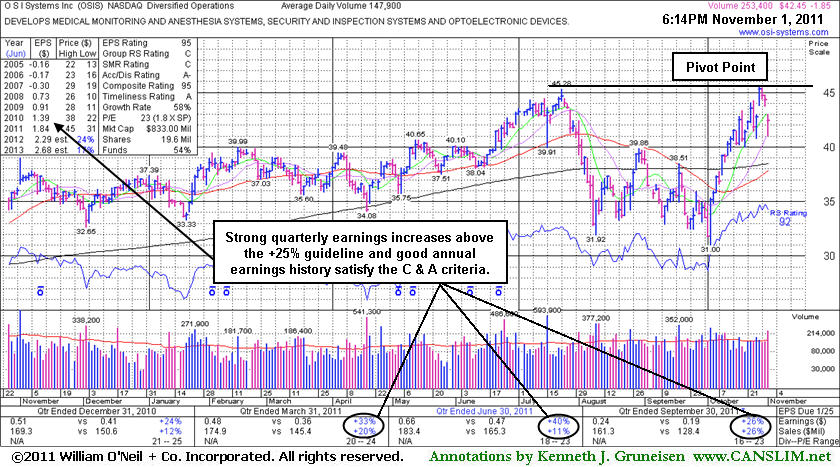
O S I Systems Inc (OSIS -$1.85 or -4.18% to $42.45) gapped down today, pulling back after recently wedging to a new 52-week high without great volume conviction. It may be forming a handle following a 14-week cup shaped base, however it is normally considered ideal for volume to dry up during the period when a handle forms. In the mid-day report today its color code was changed to yellow with pivot point cited based on its 10/27/11 high. Subsequent volume-driven gains above its pivot point may trigger a technical buy signal. Annual earnings (A criteria) growth has been strong and quarterly earnings increases have been above the +25% guideline satisfying the C criteria. Ownership by top-rated funds fell from 352 in Mar '11 to 333 in Sep '11. That may serve as a reminder for disciplined investors to watch for proof of fresh buying demand from the institutional crowd to confirm a proper technical buy signal. As always, limit losses if any stock ever falls more than -7% from the purchase price.
|
|
|
Color Codes Explained :
Y - Better candidates highlighted by our
staff of experts.
G - Previously featured
in past reports as yellow but may no longer be buyable under the
guidelines.
***Last / Change / Volume data in this table is the closing quote data***
Symbol/Exchange
Company Name
Industry Group |
PRICE |
CHANGE
(%Change) |
Day High |
Volume
(% DAV)
(% 50 day avg vol) |
52 Wk Hi
% From Hi |
Featured
Date |
Price
Featured |
Pivot Featured |
|
Max Buy |
AAPL
-
NASDAQ
Apple Inc
COMPUTER HARDWARE - Personal Computers
|
$396.51
|
-8.27
-2.04% |
$399.50
|
18,973,247
86.49% of 50 DAV
50 DAV is 21,937,700
|
$426.70
-7.08%
|
9/16/2011
|
$399.14
|
PP = $404.60
|
|
MB = $424.83
|
Most Recent Note - 10/31/2011 6:07:50 PM
G - Volume totals have recently been cooling while consolidating above its 50 DMA line and it is now perched just -5.1% off its all-time high. It has not formed a sound base pattern and ownership by top-rated funds has fallen some.
>>> The latest Featured Stock Update with an annotated graph appeared on 10/20/2011. Click here.
View all notes |
Alert me of new notes |
CANSLIM.net Company Profile |
SEC |
Zacks Reports |
StockTalk |
News |
Chart |
Request a new note
C
A N
S L
I M


|
ADS
-
NYSE
Alliance Data Sys Corp
COMPUTER SOFTWARE and SERVICES - Information and Delivery Service
|
$100.18
|
-2.26
-2.21% |
$101.66
|
917,384
94.91% of 50 DAV
50 DAV is 966,600
|
$105.67
-5.20%
|
10/21/2011
|
$97.94
|
PP = $101.15
|
|
MB = $106.21
|
 Most Recent Note - 11/1/2011 4:39:55 PM
Y - Pulled back for a second consecutive session on near average volume, closing just below its pivot point. Prior chart highs near $101 define initial support to watch above its 50 DMA line.
>>> The latest Featured Stock Update with an annotated graph appeared on 10/21/2011. Click here.
View all notes |
Alert me of new notes |
CANSLIM.net Company Profile |
SEC |
Zacks Reports |
StockTalk |
News |
Chart |
Request a new note
C
A N
S L
I M
|
ALXN
-
NASDAQ
Alexion Pharmaceuticals
DRUGS - Drug Manufacturers - Other
|
$66.27
|
-1.24
-1.84% |
$66.75
|
1,509,423
97.35% of 50 DAV
50 DAV is 1,550,500
|
$70.42
-5.89%
|
9/15/2011
|
$63.20
|
PP = $60.81
|
|
MB = $63.85
|
Most Recent Note - 11/1/2011 4:42:19 PM
G - A small gap down today led to a dip near its 50 DMA line noted as chart support to watch on pullbacks. Finished near the session high with a small loss on average volume.
>>> The latest Featured Stock Update with an annotated graph appeared on 10/18/2011. Click here.
View all notes |
Alert me of new notes |
CANSLIM.net Company Profile |
SEC |
Zacks Reports |
StockTalk |
News |
Chart |
Request a new note
C
A N
S L
I M
|
CELG
-
NASDAQ
Celgene Corp
DRUGS - Drug Manufacturers - Major
|
$63.56
|
-1.27
-1.96% |
$64.06
|
3,602,286
92.31% of 50 DAV
50 DAV is 3,902,400
|
$68.25
-6.87%
|
9/16/2011
|
$61.21
|
PP = $62.59
|
|
MB = $65.72
|
Most Recent Note - 11/1/2011 4:45:06 PM
Y - Pulled back today for a second consecutive small gap down on just below average volume. Dipping under its "max buy" level, its color code was changed to yellow. Its 50 DMA line defines important near-term chart support.
>>> The latest Featured Stock Update with an annotated graph appeared on 10/14/2011. Click here.
View all notes |
Alert me of new notes |
CANSLIM.net Company Profile |
SEC |
Zacks Reports |
StockTalk |
News |
Chart |
Request a new note
C
A N
S L
I M
|
CEVA
-
NASDAQ
Ceva Inc
ELECTRONICS - Semiconductor - Specialized
|
$30.00
|
-1.07
-3.44% |
$30.53
|
576,555
257.39% of 50 DAV
50 DAV is 224,000
|
$35.60
-15.73%
|
10/28/2011
|
$34.38
|
PP = $35.70
|
|
MB = $37.49
|
Most Recent Note - 11/1/2011 4:47:37 PM
Y - Small gap down today was its 2nd consecutive loss on above average volume following 2 consecutive volume-driven gains. It gapped up on 10/27/11 and broke out of a "double bottom" base pattern after reporting earnings +86% on +39% sales revenues for the quarter ended September 30, 2011 versus the year ago period. It had slumped below its 200 DMA line during its consolidation since dropped from the Featured Stocks list on 6/17/11. In the 10/28/11 mid-day report (read here) it was featured again in yellow with pivot point based on its 52-week high plus 10 cents while rallying "straight up from the bottom" of a 22-week cup shaped base. No overhead supply remains to act as resistance, and volume-driven gains above its pivot point may trigger a new technical buy signal.
>>> The latest Featured Stock Update with an annotated graph appeared on 5/25/2011. Click here.
View all notes |
Alert me of new notes |
CANSLIM.net Company Profile |
SEC |
Zacks Reports |
StockTalk |
News |
Chart |
Request a new note
C
A N
S L
I M
|
Symbol/Exchange
Company Name
Industry Group |
PRICE |
CHANGE
(%Change) |
Day High |
Volume
(% DAV)
(% 50 day avg vol) |
52 Wk Hi
% From Hi |
Featured
Date |
Price
Featured |
Pivot Featured |
|
Max Buy |
FEIC
-
NASDAQ
F E I Co
ELECTRONICS - Diversified Electronics
|
$37.79
|
-1.97
-4.95% |
$39.13
|
785,727
185.23% of 50 DAV
50 DAV is 424,200
|
$42.25
-10.56%
|
10/28/2011
|
$40.31
|
PP = $40.88
|
|
MB = $42.92
|
Most Recent Note - 11/1/2011 4:50:07 PM
Y - Gapped down today for a 2nd consecutive loss with above average volume. Spiked to a new 52-week high on 10/28/11 and triggered a technical buy signal with 4 times average volume while rallying straight up from the bottom of a 16-week cup shaped base.
>>> The latest Featured Stock Update with an annotated graph appeared on 10/28/2011. Click here.
View all notes |
Alert me of new notes |
CANSLIM.net Company Profile |
SEC |
Zacks Reports |
StockTalk |
News |
Chart |
Request a new note
C
A N
S L
I M
|
GNC
-
NYSE
G N C Holdings Inc
RETAIL - Drug Stores
|
$24.56
|
-0.19
-0.77% |
$24.79
|
950,115
84.82% of 50 DAV
50 DAV is 1,120,200
|
$26.48
-7.25%
|
10/26/2011
|
$24.60
|
PP = $24.80
|
|
MB = $26.04
|
Most Recent Note - 10/31/2011 6:18:56 PM
Y - Perched -6.5% off its 52-week high today. No overhead supply remains to act as resistance after 4 consecutive winning weeks with ever-increasing volume. On 10/25/11 it priced a Secondary Offering after the 10/24/11 gain with more than 4 times average volume triggered a technical buy signal. Strong quarterly and annual earnings history satisfies the C and A criteria.
>>> The latest Featured Stock Update with an annotated graph appeared on 10/26/2011. Click here.
View all notes |
Alert me of new notes |
CANSLIM.net Company Profile |
SEC |
Zacks Reports |
StockTalk |
News |
Chart |
Request a new note
C
A N
S L
I M
|
HMSY
-
NASDAQ
H M S Holdings Corp
COMPUTER SOFTWARE and SERVICES - Healthcare Information Service
|
$23.97
|
-0.47
-1.92% |
$24.13
|
867,856
162.76% of 50 DAV
50 DAV is 533,200
|
$28.25
-15.14%
|
10/27/2011
|
$26.44
|
PP = $28.37
|
|
MB = $29.79
|
Most Recent Note - 11/1/2011 4:54:00 PM
G - Slumped further below its 50 and 200 DMA lines today with above average volume behind its loss. Last week it reported earnings +31% on +15% sales revenues for the quarter ended September 30, 2011 versus the year ago period, then it gapped down and violated its 50 and 200 DMA lines raising concerns and triggering technical sell signals. Disciplined investors will note that it did not trigger a technical buy signal.
>>> The latest Featured Stock Update with an annotated graph appeared on 5/23/2011. Click here.
View all notes |
Alert me of new notes |
CANSLIM.net Company Profile |
SEC |
Zacks Reports |
StockTalk |
News |
Chart |
Request a new note
C
A N
S L
I M
|
ISRG
-
NASDAQ
Intuitive Surgical Inc
HEALTH SERVICES - Medical Appliances and Equipment
|
$426.17
|
-7.69
-1.77% |
$431.45
|
412,236
89.87% of 50 DAV
50 DAV is 458,700
|
$443.00
-3.80%
|
10/19/2011
|
$424.69
|
PP = $415.29
|
|
MB = $436.05
|
Most Recent Note - 11/1/2011 4:55:57 PM
Y - Color code is changed to yellow after a loss on below average volume led to a dip below its "max buy" level. Prior highs define important support to watch on pullbacks.
>>> The latest Featured Stock Update with an annotated graph appeared on 10/19/2011. Click here.
View all notes |
Alert me of new notes |
CANSLIM.net Company Profile |
SEC |
Zacks Reports |
StockTalk |
News |
Chart |
Request a new note
C
A N
S L
I M
|
LABL
-
NASDAQ
Multi Color Corp
CONSUMER NON-DURABLES - Packaging and Containers
|
$26.02
|
-0.49
-1.85% |
$26.48
|
62,252
112.17% of 50 DAV
50 DAV is 55,500
|
$28.00
-7.07%
|
10/17/2011
|
$27.81
|
PP = $28.10
|
|
MB = $29.51
|
Most Recent Note - 11/1/2011 5:20:15 PM
Y - Down today on slightly higher volume, finishing -7.1% off its 52-week high. Subsequent volume-driven gains into new high ground may trigger a technical buy signal. Recent lows near its 50 DMA line define near-term support to watch where any violation would raise concerns. Due to report earnings on Tuesday, November 8th before the opening bell.
>>> The latest Featured Stock Update with an annotated graph appeared on 10/17/2011. Click here.
View all notes |
Alert me of new notes |
CANSLIM.net Company Profile |
SEC |
Zacks Reports |
StockTalk |
News |
Chart |
Request a new note
C
A N
S L
I M
|
Symbol/Exchange
Company Name
Industry Group |
PRICE |
CHANGE
(%Change) |
Day High |
Volume
(% DAV)
(% 50 day avg vol) |
52 Wk Hi
% From Hi |
Featured
Date |
Price
Featured |
Pivot Featured |
|
Max Buy |
MG
-
NYSE
Mistras Group Inc
DIVERSIFIED SERVICES - Bulding and Faci;ity Management Services
|
$21.72
|
-0.08
-0.37% |
$21.86
|
171,735
76.84% of 50 DAV
50 DAV is 223,500
|
$23.51
-7.61%
|
10/28/2011
|
$22.49
|
PP = $23.61
|
|
MB = $24.79
|
Most Recent Note - 10/31/2011 6:27:32 PM
Y - Pulled back today on light volume. Near its all-time high, its orderly consolidation was identified as an advanced "3-weeks tight" base. Color code was changed to yellow with new pivot point cited based on its 52-week high plus 10 cents. A subsequent breakout on heavy volume may trigger a new (or add-on) buy signal. Prior highs in the $20-21 area define initial chart support to watch above its 50 DMA line.
>>> The latest Featured Stock Update with an annotated graph appeared on 10/12/2011. Click here.
View all notes |
Alert me of new notes |
CANSLIM.net Company Profile |
SEC |
Zacks Reports |
StockTalk |
News |
Chart |
Request a new note
C
A N
S L
I M
|
MKTX
-
NASDAQ
Marketaxess Holdings Inc
FINANCIAL SERVICES - Investment Brokerage - Nationa
|
$28.89
|
-0.34
-1.16% |
$29.77
|
255,509
97.49% of 50 DAV
50 DAV is 262,100
|
$30.95
-6.65%
|
10/28/2011
|
$29.79
|
PP = $31.05
|
|
MB = $32.60
|
Most Recent Note - 10/31/2011 6:29:42 PM
Y - Perched near its 52-week high today after an 8-week base-on-base pattern. Color code was changed to yellow in the 10/28/11 mid-day report (read here) and new pivot point cited was based on its 52-week high plus 10 cents. A subsequent breakout would trigger a new technical buy signal. Its rebound above its 50 DMA line last week helped its outlook. Fundamentals remain strong and it just reported earnings +55% on +24% sales revenues for the quarter ended September 30, 2011 versus the year ago period. See the latest FSU analysis for more details and a new annotated graph.
>>> The latest Featured Stock Update with an annotated graph appeared on 10/31/2011. Click here.
View all notes |
Alert me of new notes |
CANSLIM.net Company Profile |
SEC |
Zacks Reports |
StockTalk |
News |
Chart |
Request a new note
C
A N
S L
I M
|
OPNT
-
NASDAQ
Opnet Technologies
INTERNET - Internet Software and Services
|
$43.46
|
-0.28
-0.64% |
$44.61
|
490,184
270.67% of 50 DAV
50 DAV is 181,100
|
$45.92
-5.35%
|
10/11/2011
|
$38.45
|
PP = $42.02
|
|
MB = $44.12
|
Most Recent Note - 11/1/2011 1:06:13 PM
Y - Encountering some distributional pressure while churning above average volume without making more meaningful price progress in the past week. Prior highs in the $41 area define near-term chart support to watch. Due to report earnings on Wednesday, November 9th.
>>> The latest Featured Stock Update with an annotated graph appeared on 10/25/2011. Click here.
View all notes |
Alert me of new notes |
CANSLIM.net Company Profile |
SEC |
Zacks Reports |
StockTalk |
News |
Chart |
Request a new note
C
A N
S L
I M
|
OSIS
-
NASDAQ
O S I Systems Inc
ELECTRONICS - Semiconductor Equipment and Mate
|
$42.45
|
-1.85
-4.18% |
$43.00
|
254,696
171.74% of 50 DAV
50 DAV is 148,300
|
$45.57
-6.85%
|
11/1/2011
|
$42.07
|
PP = $45.57
|
|
MB = $47.85
|
Most Recent Note - 11/1/2011 1:14:56 PM
Y - Gapped down today, pulling back after recently wedging to a new 52-week high without great volume conviction. It may be forming a handle following a 14-week cup shaped base. Color code is changed to yellow with pivot point cited based on its 10/27/11 high. Subsequent volume-driven gains above its pivot point may trigger a technical buy signal. Annual earnings (A criteria) growth has been strong and quarterly earnings increases have been above the +25% guideline satisfying the C criteria. Ownership by top-rated funds fell from 352 in Mar '11 to 333 in Sep '11.
>>> The latest Featured Stock Update with an annotated graph appeared on 11/1/2011. Click here.
View all notes |
Alert me of new notes |
CANSLIM.net Company Profile |
SEC |
Zacks Reports |
StockTalk |
News |
Chart |
Request a new note
C
A N
S L
I M
|
SWI
-
NYSE
Solarwinds Inc
COMPUTER SOFTWARE and SERVICES - Application Software
|
$27.76
|
-1.10
-3.81% |
$28.41
|
1,733,076
167.77% of 50 DAV
50 DAV is 1,033,000
|
$29.50
-5.90%
|
10/27/2011
|
$27.78
|
PP = $25.62
|
|
MB = $26.90
|
Most Recent Note - 11/1/2011 1:34:55 PM
G - Pulling back today following 3 consecutive volume-driven gains for new all-time highs. Prior highs in the $25-26 area define initial chart support to watch on pullbacks.
>>> The latest Featured Stock Update with an annotated graph appeared on 10/27/2011. Click here.
View all notes |
Alert me of new notes |
CANSLIM.net Company Profile |
SEC |
Zacks Reports |
StockTalk |
News |
Chart |
Request a new note
C
A N
S L
I M
|
Symbol/Exchange
Company Name
Industry Group |
PRICE |
CHANGE
(%Change) |
Day High |
Volume
(% DAV)
(% 50 day avg vol) |
52 Wk Hi
% From Hi |
Featured
Date |
Price
Featured |
Pivot Featured |
|
Max Buy |
UA
-
NYSE
Under Armour Inc Cl A
CONSUMER NON-DURABLES - Textile - Apparel Clothing
|
$82.05
|
-2.36
-2.80% |
$83.68
|
1,281,540
86.33% of 50 DAV
50 DAV is 1,484,500
|
$87.40
-6.12%
|
10/25/2011
|
$82.43
|
PP = $80.80
|
|
MB = $84.84
|
Most Recent Note - 11/1/2011 5:22:42 PM
Y - Pulled back today for its 3rd consecutive small loss on light volume. Color code was changed to yellow after dipping under its "max buy" level. Prior highs near $80 define initial support well above its 50 DMA line.
>>> The latest Featured Stock Update with an annotated graph appeared on 7/26/2011. Click here.
View all notes |
Alert me of new notes |
CANSLIM.net Company Profile |
SEC |
Zacks Reports |
StockTalk |
News |
Chart |
Request a new note
C
A N
S L
I M
|
V
-
NYSE
Visa Inc Cl A
DIVERSIFIED SERVICES - Business/Management Services
|
$90.03
|
-3.23
-3.46% |
$92.46
|
7,635,126
139.12% of 50 DAV
50 DAV is 5,488,100
|
$95.87
-6.09%
|
10/24/2011
|
$94.21
|
PP = $94.85
|
|
MB = $99.59
|
Most Recent Note - 11/1/2011 5:24:37 PM
Y - Gapped down today for a damaging loss on above average volume indicative of distributional pressure. It did not trigger a proper new technical buy signal since recently highlighted in yellow as an ideal looking set-up. Its 50 DMA line defines near-term chart support to watch.
>>> The latest Featured Stock Update with an annotated graph appeared on 10/24/2011. Click here.
View all notes |
Alert me of new notes |
CANSLIM.net Company Profile |
SEC |
Zacks Reports |
StockTalk |
News |
Chart |
Request a new note
C
A N
S L
I M
|
|
|
|
THESE ARE NOT BUY RECOMMENDATIONS!
Comments contained in the body of this report are technical
opinions only. The material herein has been obtained
from sources believed to be reliable and accurate, however,
its accuracy and completeness cannot be guaranteed.
This site is not an investment advisor, hence it does
not endorse or recommend any securities or other investments.
Any recommendation contained in this report may not
be suitable for all investors and it is not to be deemed
an offer or solicitation on our part with respect to
the purchase or sale of any securities. All trademarks,
service marks and trade names appearing in this report
are the property of their respective owners, and are
likewise used for identification purposes only.
This report is a service available
only to active Paid Premium Members.
You may opt-out of receiving report notifications
at any time. Questions or comments may be submitted
by writing to Premium Membership Services 665 S.E. 10 Street, Suite 201 Deerfield Beach, FL 33441-5634 or by calling 1-800-965-8307
or 954-785-1121.
|
|
|

